| IN BRIEF
Actuarial technique is not a service for insurers. It is a method for putting a number on uncertainty — and most organisations are already carrying uncertainty they have priced by assumption rather than by measurement. Three worked cases follow: an extended warranty, a receivables book and an inventory decision. None involves an insurance company. Each turns on a figure nobody in the organisation had calculated, and in each the arithmetic is straightforward once someone asks for it. A pattern runs through all three. The average is usually about right. The average is also not the number that determines whether the organisation survives the event. This article is deliberately arithmetic rather than conceptual. The numbers are illustrative, but the method is not. |
The Warranty Nobody Priced
A regional appliance retailer sells a three-year extended warranty for US$120 on a product costing US$900. The warranty is profitable, in the sense that the finance team can see the premium income and cannot see any corresponding cost line until claims arrive. Nobody in the business owns the failure-rate assumption, because nobody has ever been asked to state one.
The actuarial calculation takes an afternoon. Suppose failures run at roughly four per cent in the first year, seven in the second and eleven in the third, giving a claim probability across the term of about twenty-two per cent. Suppose eighty-five per cent of claims are repaired at an average of US$310 and the remainder are replaced at US$900. The average claim then costs US$398.50, the expected claim cost per policy sold is US$87.67, and after US$12 of administration the expected margin is US$20.33 — about seventeen per cent of the premium.
That is a reasonable margin. The question an actuary asks next is how much has to change before it is not.
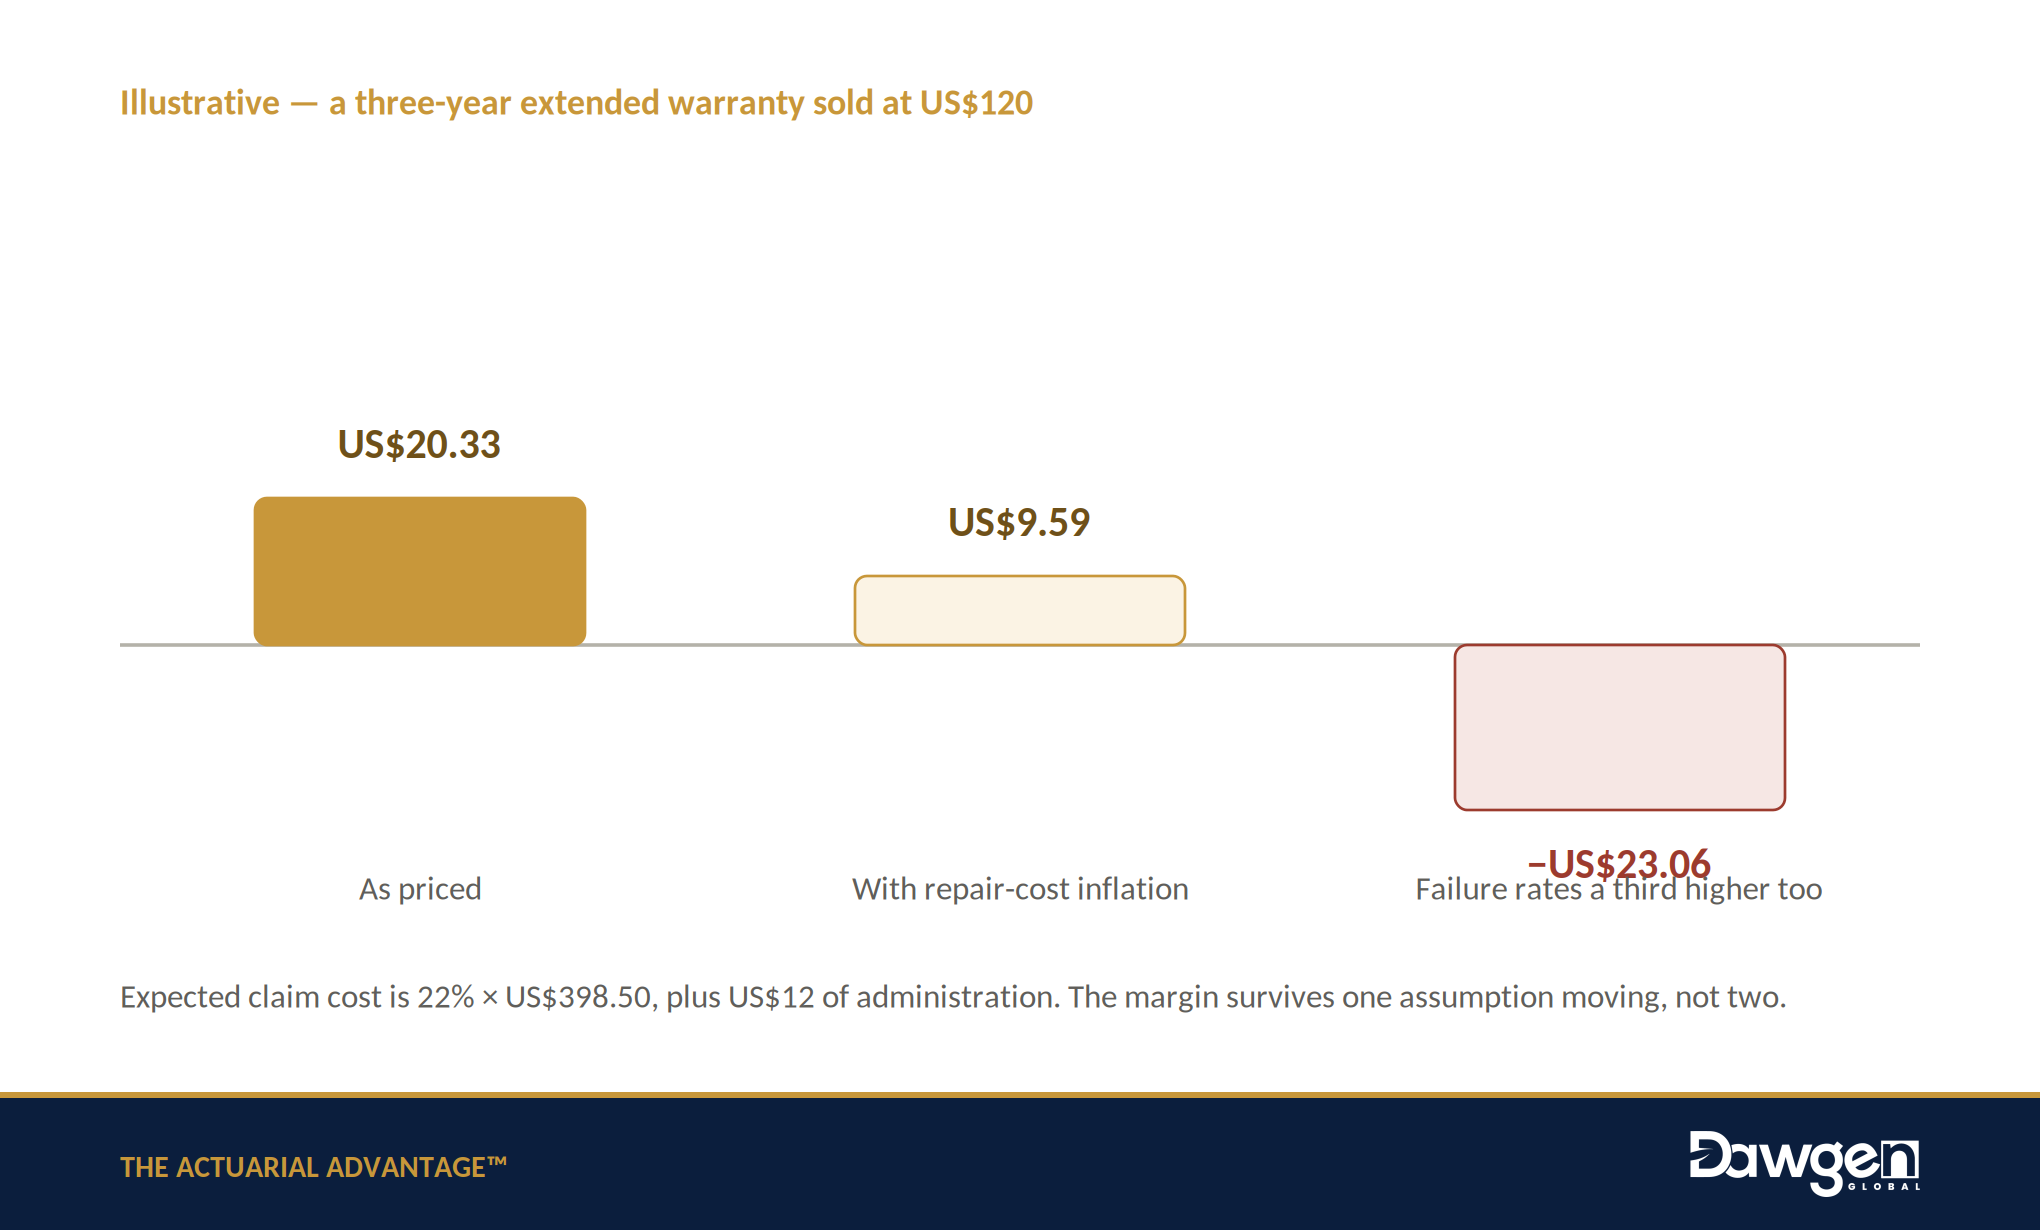
The margin survives one assumption moving. It does not survive two. Figures illustrative.
Repair and replacement costs are not stable. At eight per cent annual cost inflation, with claims arising on average midway through the term, the average claim rises to US$447.30 and the margin falls to US$9.59. Add a failure rate one third higher than assumed — well within the range of ordinary estimation error when the underlying rate has never been measured — and the product loses US$23.06 on every policy sold.
| The warranty did not become unprofitable. It was always priced on a number nobody had calculated, and the loss was arriving on a delay. |
Three features of this case generalise. The exposure is long-dated, so the consequence surfaces years after the pricing decision. It is sensitive to two or three assumptions rather than to everything. And the assumptions are knowable — the retailer holds the service records that would establish the true failure rate, and has never analysed them.
The same structure appears in service contracts, maintenance agreements, guarantees, loyalty and rewards programmes, deposit schemes, and any arrangement in which money is collected today against an obligation that matures later. Each is, in economic substance, an insurance contract written by an organisation that does not consider itself an insurer.
Why the Average Can Be Right and the Answer Still Wrong
A distributor turns over US$18 million a year and carries US$4.2 million in receivables. Four customers account for forty-six per cent of that balance, and the largest single account owes US$740,000. Historical bad debts have run at about 1.1 per cent, so the provision is set at roughly US$46,000. The auditors are satisfied and the provision has proved adequate for several years.
Now express the same position as an exposure rather than a provision. If each major customer carries something like a three per cent annual probability of failure and a loss given default of sixty-five per cent, the expected loss from the largest account is about US$14,400 a year. Summed across the four, the expected loss is close to the historical provision. On average, the provision is correct.
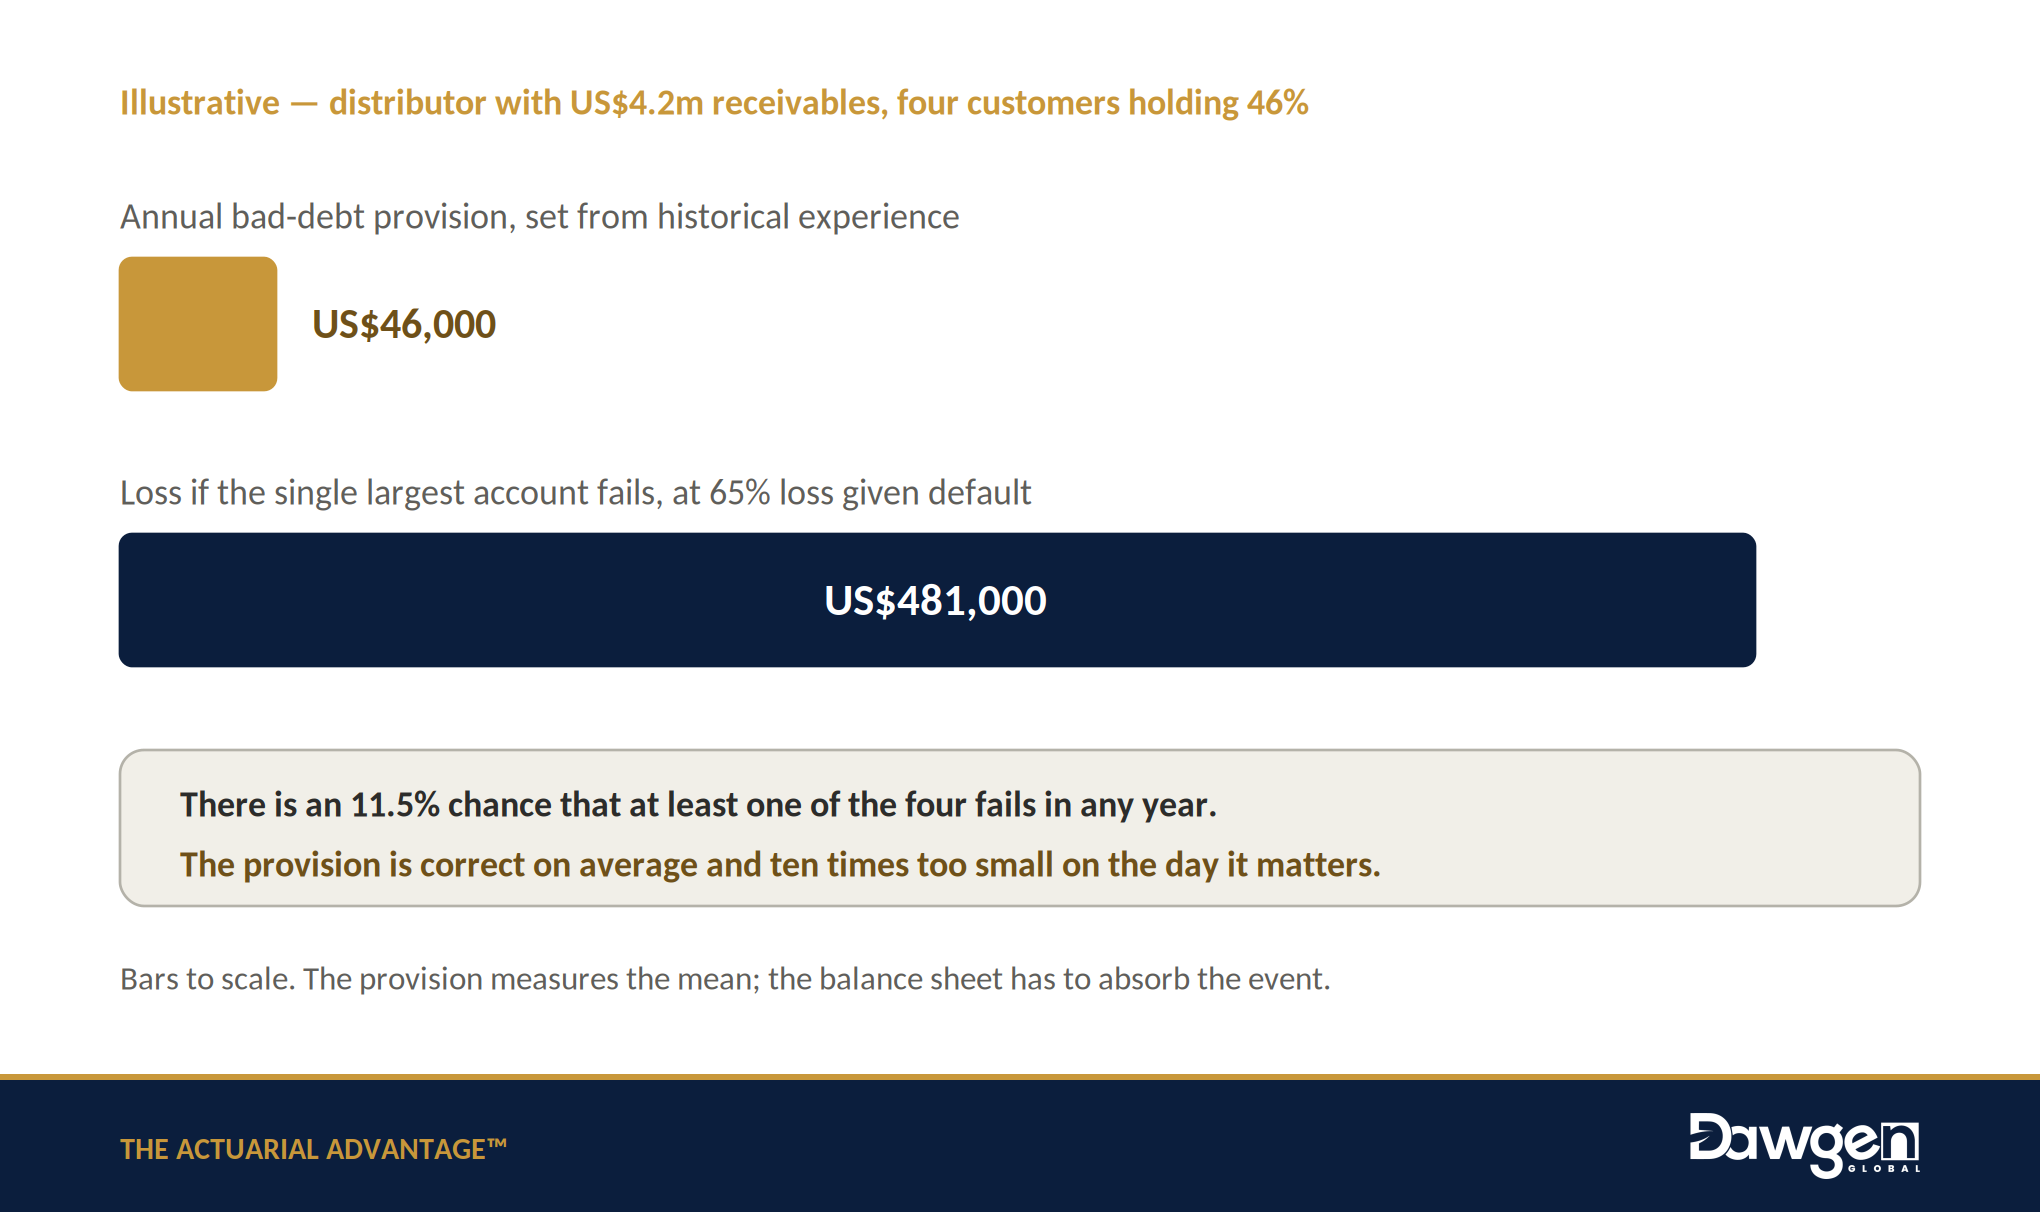
The provision measures the mean. The balance sheet has to absorb the event. Figures illustrative.
The distribution tells a different story. The probability that at least one of the four fails in any given year is 11.5 per cent — not remote, and roughly a one-in-nine event. If it is the largest, the loss is US$481,000, arriving in a single quarter, against an annual provision ten times smaller.
The provision is not wrong. It answers the accounting question, which is what the expected loss is. It does not answer the management question, which is whether the organisation could absorb the loss it is actually exposed to, and what it would cost to reduce that exposure through credit insurance, tighter limits, security, or deliberate diversification of the customer base.
This distinction — between the expected value and the shape of the distribution around it — is the single most transferable idea in actuarial practice. It applies wherever an organisation has satisfied itself with an average.
How Much Inventory Is the Right Amount?
A distributor holds six weeks of stock and is considering eight. The additional two weeks represent about US$400,000 of inventory. Carrying it costs financing at nine per cent, storage at four and obsolescence at three — sixteen per cent in total, or US$64,000 a year.
The benefit is harder to see, which is why the decision is usually made by judgement. Quantified, it is the avoided cost of running out. If the probability of a supply interruption exceeding six weeks is around twelve per cent in a given year, the expected shortfall beyond existing cover is nine days, and each day of stockout costs US$14,000 in lost contribution margin, then the expected annual benefit is about US$15,120. Against US$64,000 of carrying cost, the additional stock is not justified.
Change two inputs and the conclusion reverses. If the interruption probability is thirty per cent — plausible for a single-source import route through a hurricane season — and the daily margin at risk is US$30,000, the expected benefit becomes US$81,000 and the additional stock pays for itself.
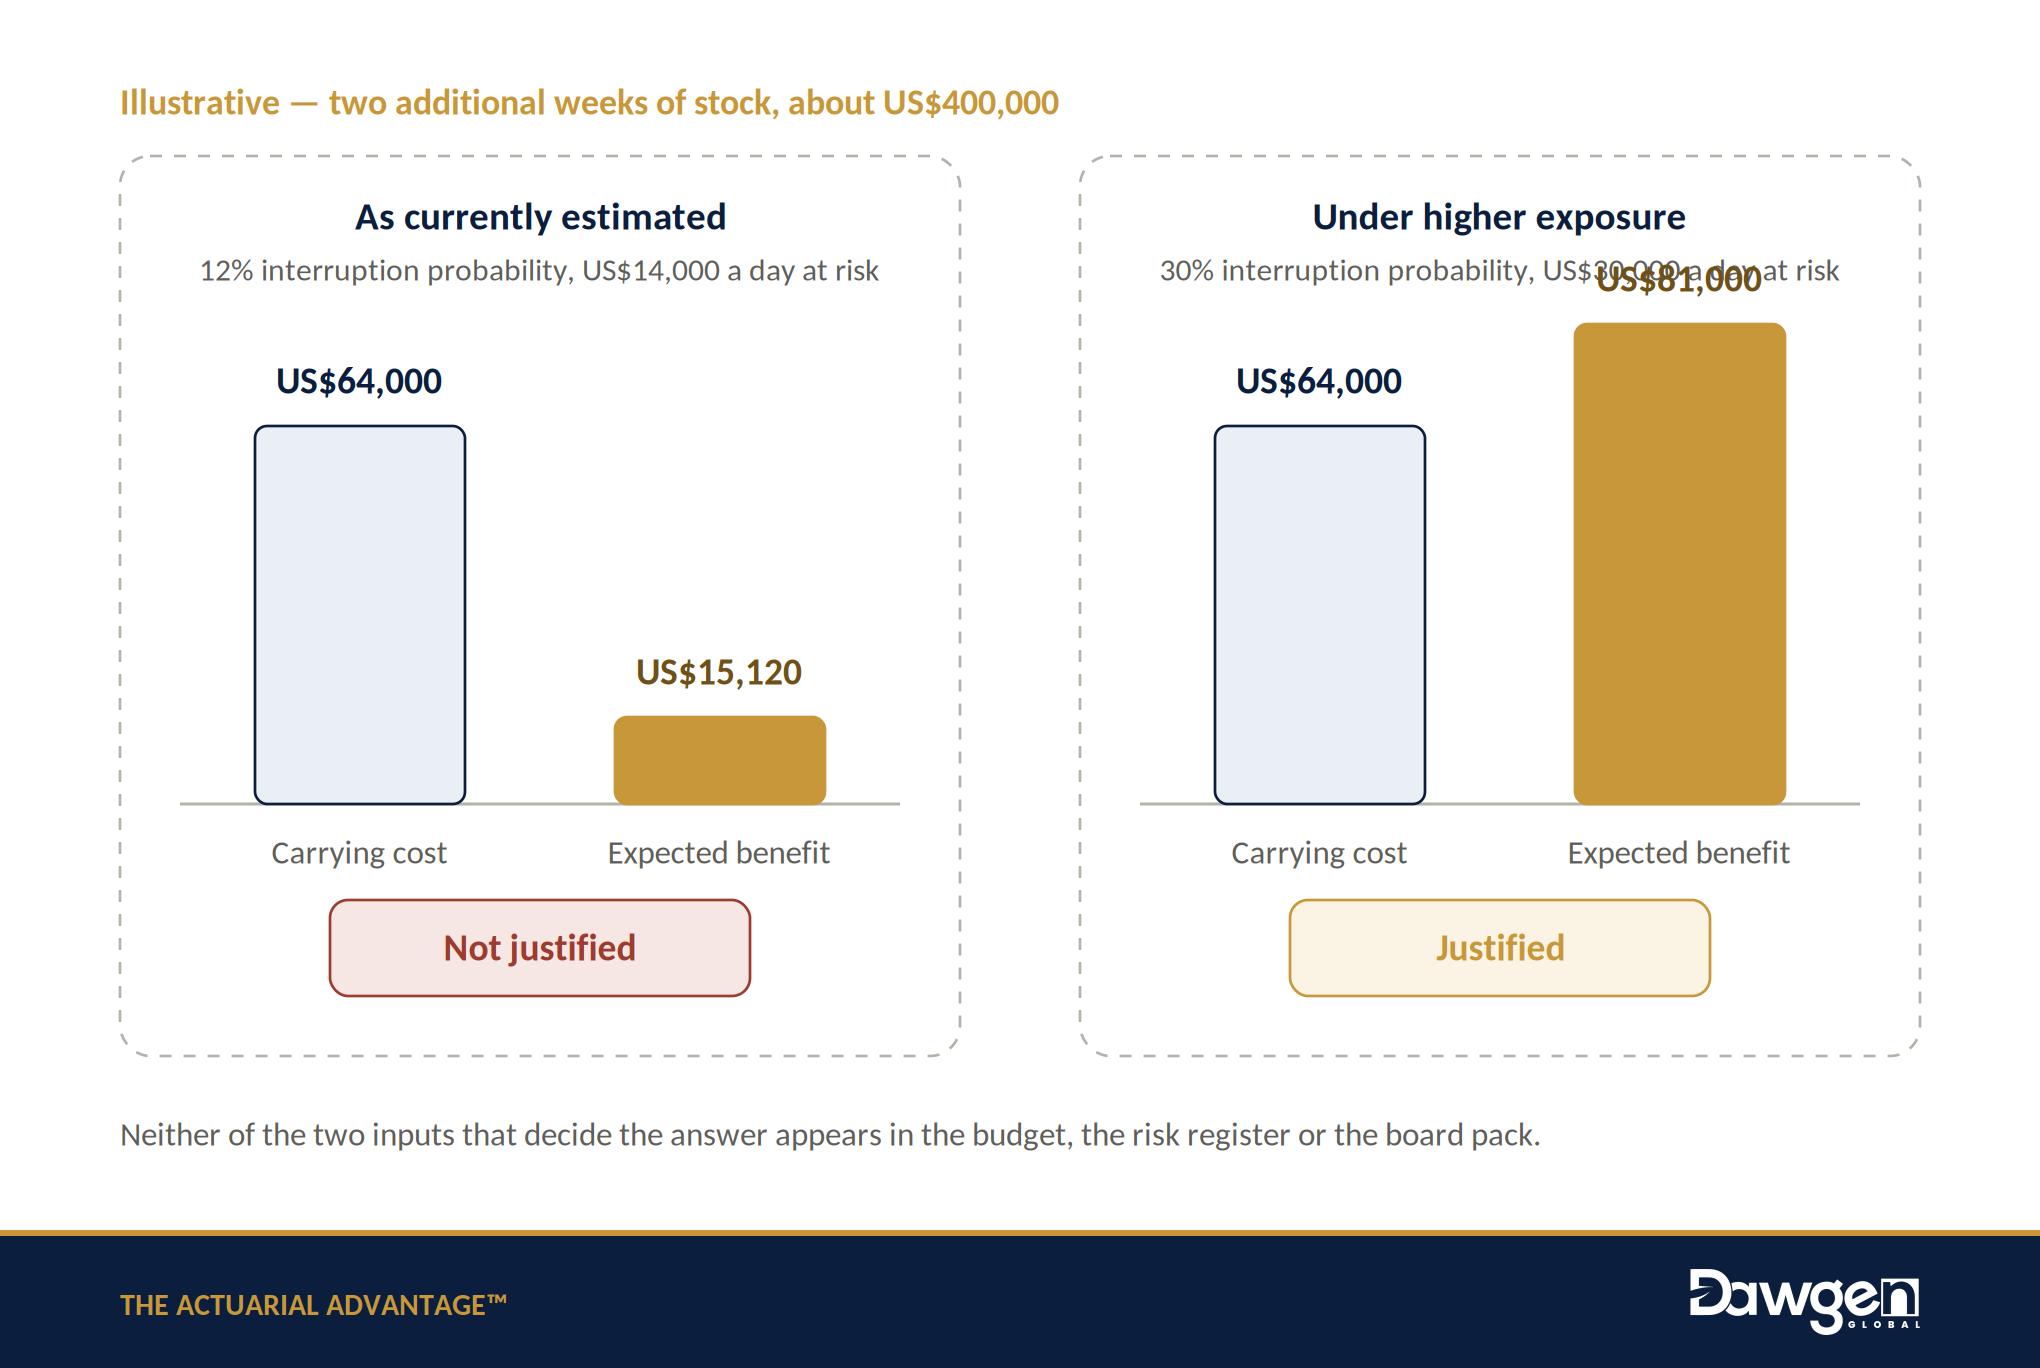
| Neither of the two inputs that decide the answer appears anywhere in the budget, the risk register or the board pack. |
That is the finding worth carrying away. The organisation is not choosing badly. It is choosing without the two numbers that determine which choice is correct, and both are estimable from shipping records, supplier history and margin data it already holds.
Why One Event Is Never One Loss
Risk registers are organised as lists, and lists imply independence. Caribbean exposures are not independent, and the consequence of treating them as though they were is systematic understatement.
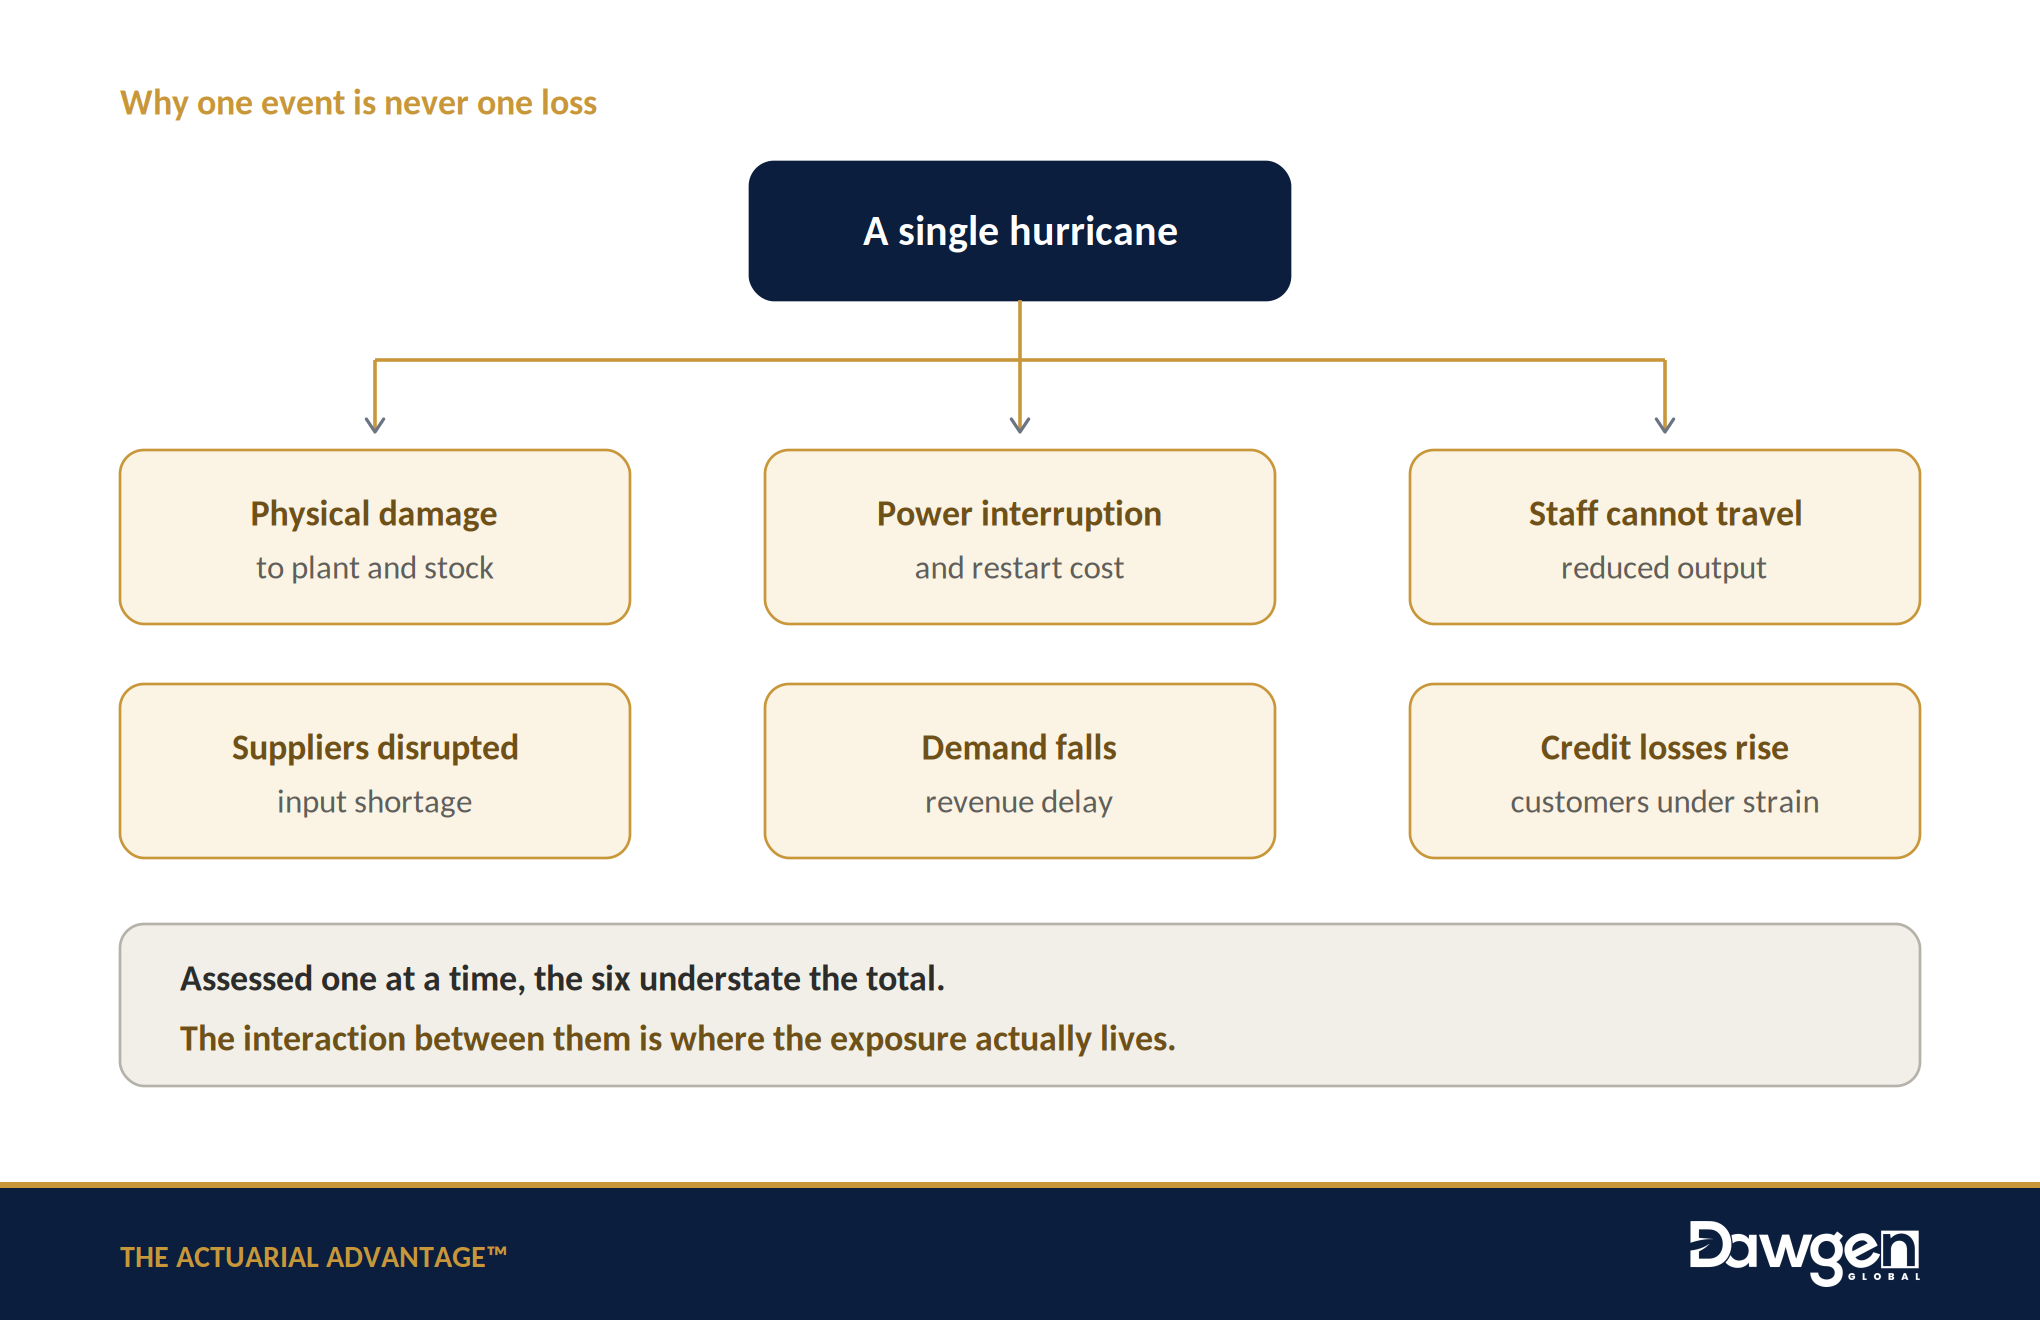
Assessed one at a time, the six understate the total. The interaction is where the exposure lives.
A single severe weather event damages physical assets, interrupts power, prevents staff from reaching the workplace, disrupts suppliers, suppresses customer demand and weakens the credit quality of the customers who owe money — simultaneously, and for overlapping periods. Each of those six may be individually survivable. The organisation does not experience them individually.
The compounding is not merely additive either. Revenue falls at the same moment that restoration expenditure rises, which is a liquidity event rather than a profit event. Receivables slow while payables accelerate. Insurance recoveries arrive after the cash has been needed. An organisation can be comfortably solvent on paper throughout and still fail because the money was required in week three and arrived in month five.
Scenario modelling addresses this directly by running the combination rather than the components, and by reporting the result as a cash-flow path rather than a single loss figure. The output management needs is not what a severe event would cost. It is how much cash would be required, in which weeks, and whether the organisation would have it.
What About Cyber?
Cybersecurity is reported to boards in technical language: vulnerabilities identified, controls tested, patches applied, incidents contained. All of it is necessary and none of it answers the question a board is accountable for, which is what an incident would cost and whether the current level of spending is proportionate to that.
The actuarial contribution is to convert the technical assessment into a frequency and severity model. How often does an incident of each type occur in organisations of this size and sector? Given an incident, what is the distribution of business interruption, data restoration, forensic investigation, legal and regulatory cost, customer compensation, and lost revenue? How does the answer change with the quality of detection and response?
That framing makes two decisions tractable that are otherwise argued about. Whether a proposed security investment is worth its cost becomes a comparison between the spend and the modelled reduction in expected loss. And whether the cyber insurance limit is adequate becomes a comparison between the limit and the modelled severe-case loss, rather than a figure carried forward from the previous renewal.
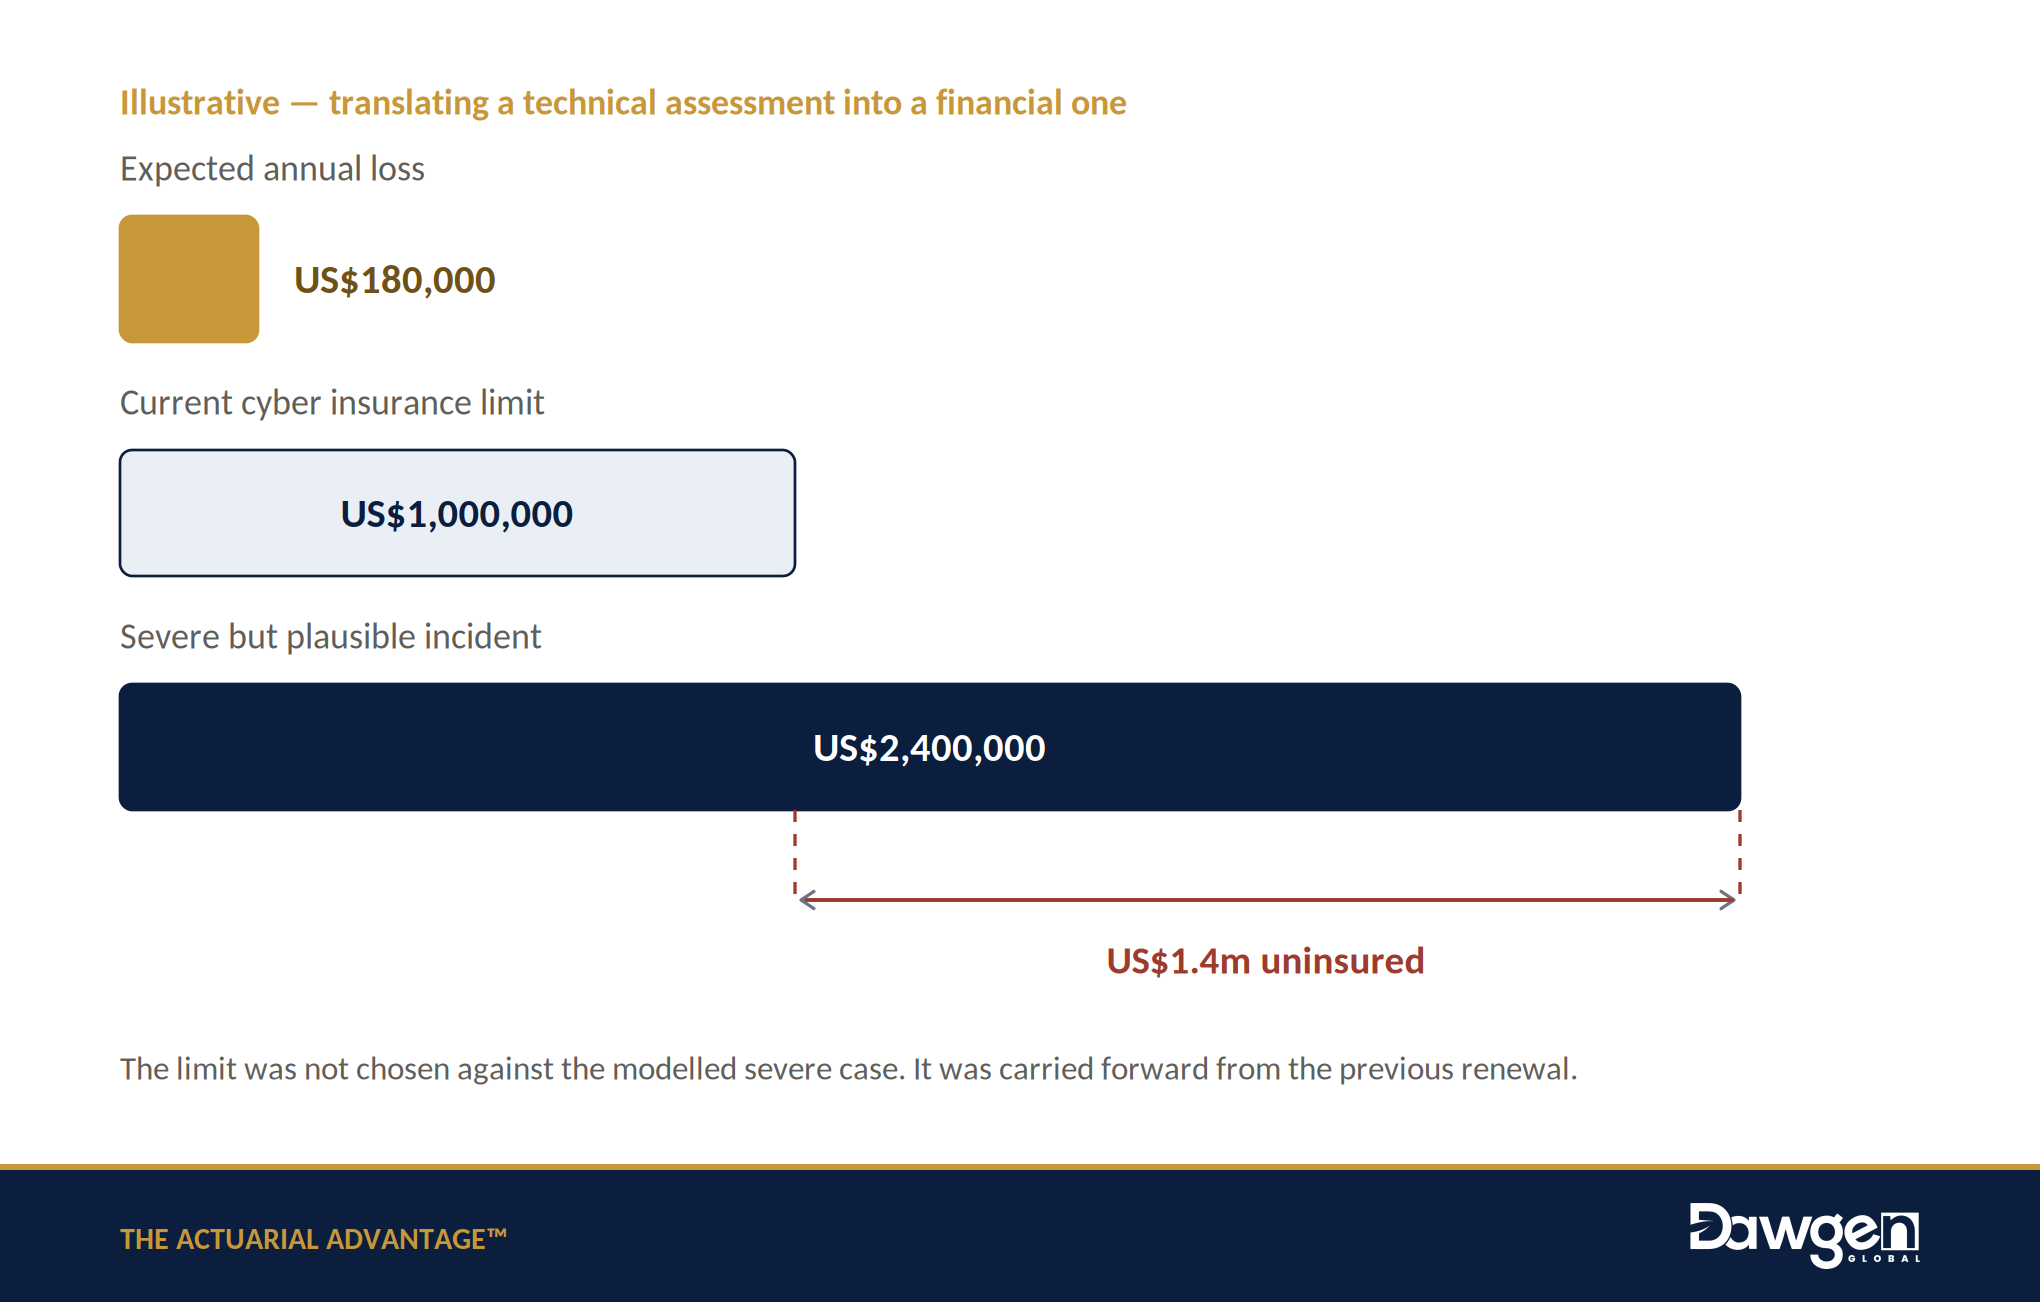
Quantification does not replace technical testing, and it is worthless without it — the model is only as good as the assessment of the controls feeding it. It translates the technical work into the terms in which capital is allocated.
Models That Make Decisions About People
Organisations are increasingly deploying statistical and machine-learning models that decide who receives credit, at what price, on what terms, and with what level of service. These models are frequently built quickly, deployed widely, and reviewed by nobody outside the team that built them.
Actuarial practice has spent a century on precisely this problem, and carries a professional framework for it: documented assumptions, stated limitations, independent validation, back-testing against emerging experience, and a discipline of monitoring model performance as conditions drift away from the data the model was trained on.
The questions worth asking about any model that affects a customer are simple, and most organisations cannot currently answer them. Who validated it, and did they build it? What data was it trained on, and does that data still resemble the population it now decides about? What happens to its accuracy when economic conditions change? Has anyone tested whether its outcomes differ systematically across groups in ways the organisation could not defend? When it degrades, who notices, and how quickly?
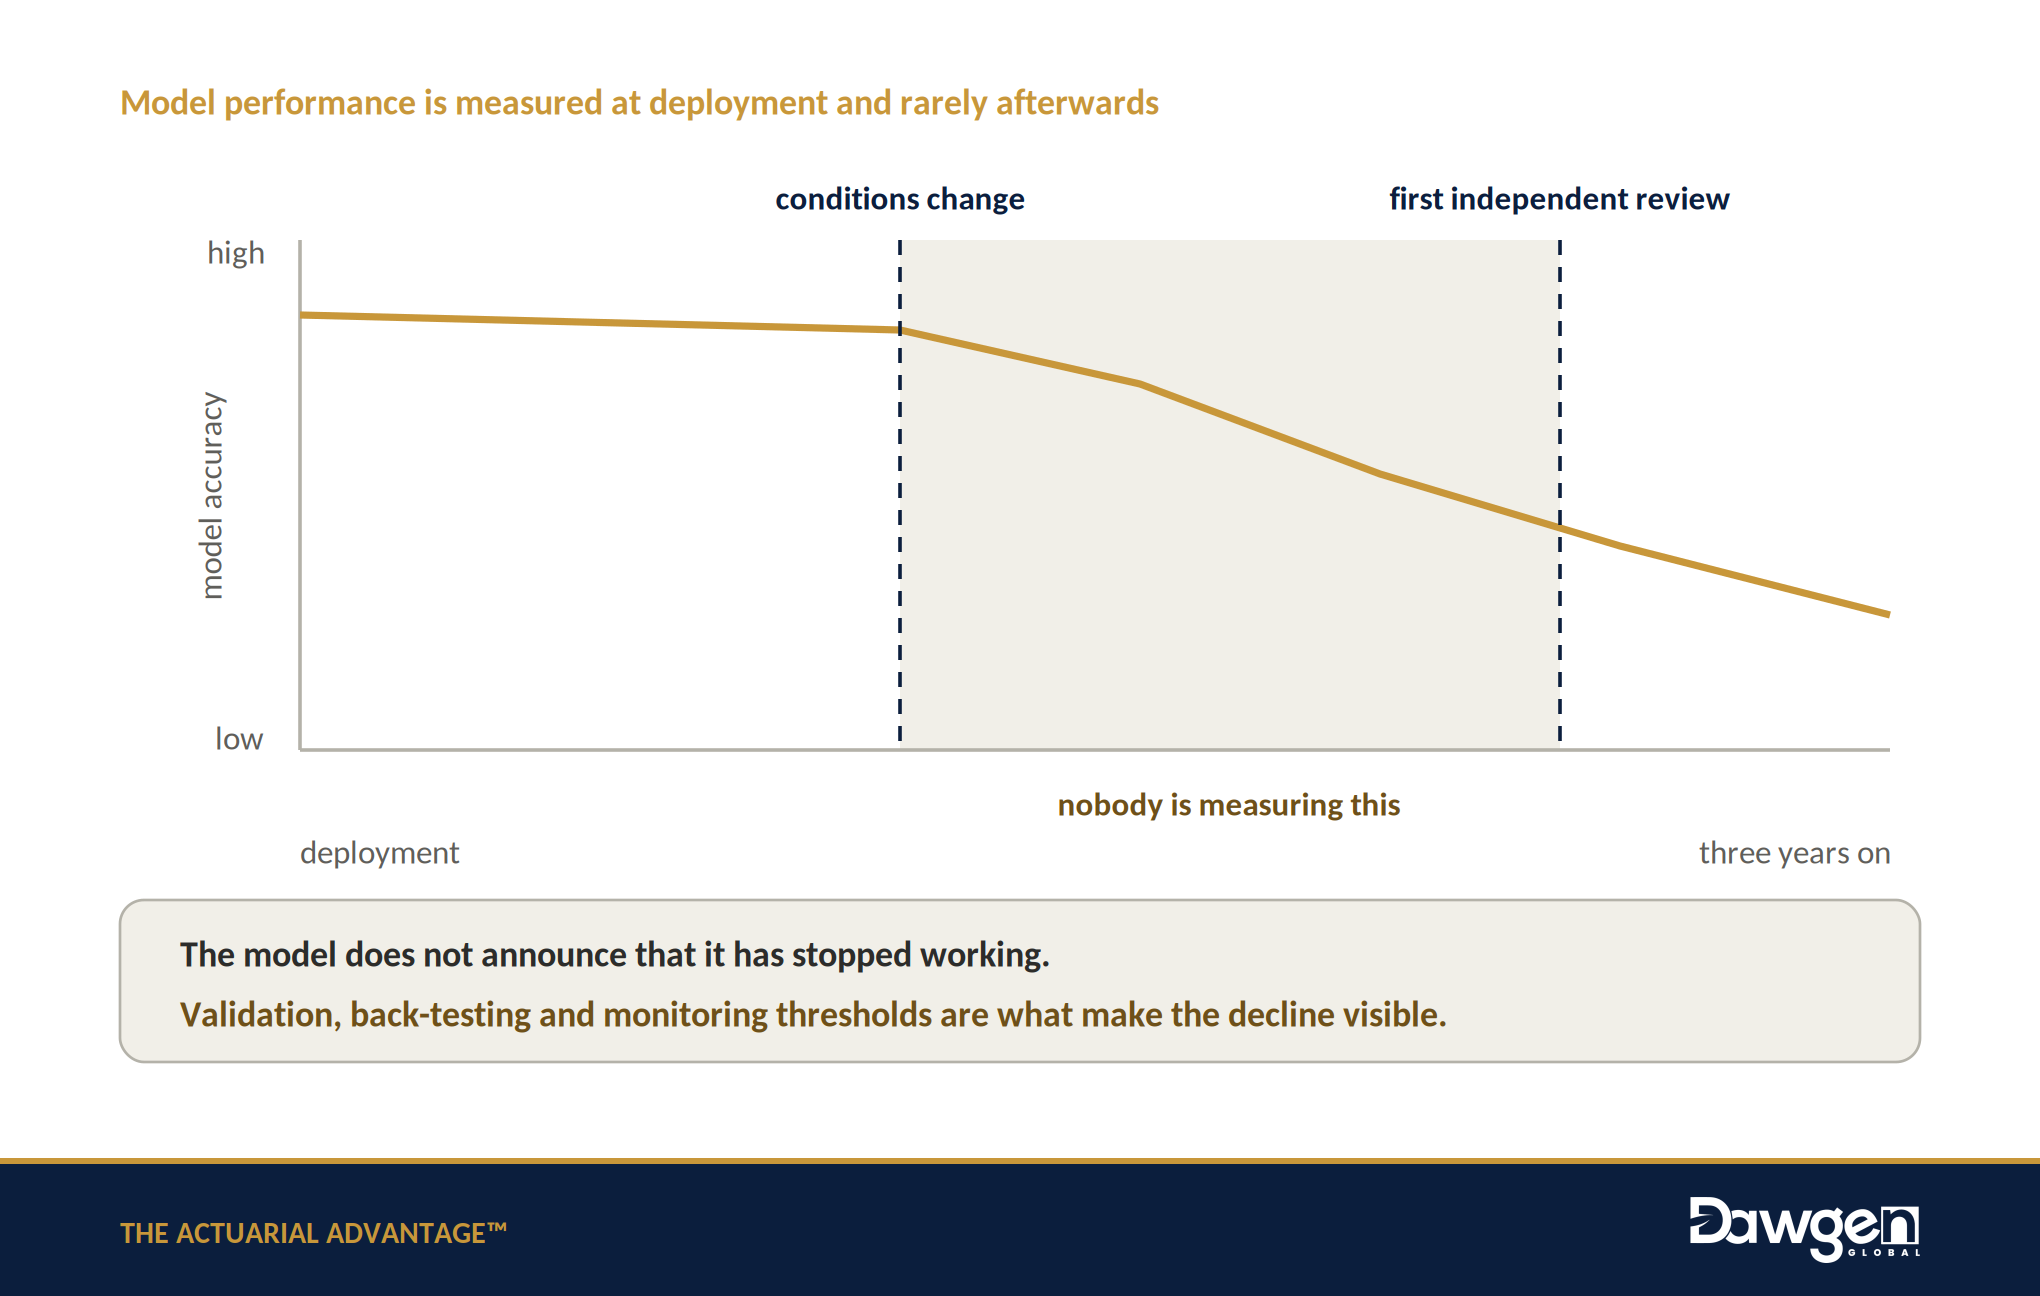
A model that produces a precise answer is not the same as a model that produces a reliable one, and the difference is invisible in the output. It is visible only in the validation.
Where Else the Same Method Applies
The three worked cases share a structure: a long-dated or uncertain obligation, two or three assumptions carrying most of the answer, and data already held by the organisation. That structure recurs across settings common in the region.
| Setting | The question management is really asking | What quantification adds |
| Workforce and long-term benefits | What will our people cost us over ten years, not next year? | Projects salary progression, turnover, retirement patterns, medical inflation and long-service obligations as a single cost trajectory rather than an annual budget line |
| Healthcare and medical benefit | Is this benefit sustainable, or only affordable in year one? | Separates the first-year premium from the trend, and tests benefit design against utilisation and demographic change |
| Customer value and retention | Which customers are actually profitable once risk is priced in? | Combines expected revenue with churn, service cost, payment behaviour and default probability into a risk-adjusted lifetime value |
| Pricing and product design | Does this price cover the cost we cannot yet see? | Estimates the expected cost and its variability where the obligation extends beyond the sale |
| Transactions and valuation | What long-tail liabilities does financial due diligence miss? | Surfaces reserve adequacy, benefit deficits, warranty and self-insured exposures that affect price, structure and indemnities |
| Capital and liquidity | Could we fund a severe year while continuing to invest? | Produces a cash-flow path under stress rather than a solvency ratio at a point in time |
| Public policy and social protection | Who bears the cost of this reform, and when? | Shows how alternative policy choices affect different cohorts and how long-term obligations compare with projected resources |
| Climate and catastrophe exposure | What is not covered, and what would it cost us? | Quantifies the protection gap, the resilience investment case and the business-interruption path |
The method is constant. Only the obligation being measured changes.
What Separates a Useful Engagement from an Expensive One
The value of actuarial work has almost nothing to do with the sophistication of the model. Judged against the following, a great deal of technically excellent analysis fails.
- It starts from a decision management actually has to take, with a date attached, rather than from a general request for analysis.
- It states its assumptions in plain terms, and identifies which two or three carry most of the answer.
- It reports a range and the shape of the distribution, not a single figure.
- It expresses the result in cash and timing, not only in profit or provision.
- It states plainly what the model cannot do and where it should not be relied upon.
- It says what it would take to change the conclusion — and how likely that is.
- It ends with a recommended action, an owner and an indicative cost.
- It leaves behind monitoring thresholds, so the organisation learns when the answer has stopped holding.
A model that management cannot interpret has no strategic value whatever its technical merit, and a model that answers a question nobody was asking has less.
Eight Questions Worth Putting to Your Finance Team
Not to your actuary — to the people who already hold the data.
- Which of our products or contracts collect money now against an obligation that matures later, and who set the assumption behind the price?
- What is our largest single customer exposure, and what would we lose if that customer failed next quarter?
- Which of our costs would rise at the same moment our revenue fell?
- What is the longest period we could fund operations with no receipts from our four largest accounts?
- Which decisions are we currently making on a rule of thumb because the underlying number has never been calculated?
- Which models produce figures in our financial statements, and who reviewed them who did not build them?
- Where are we relying on an average that would not survive the event it averages?
- If our three most important assumptions were each wrong by a third, which decision would we regret?
| IF SEVERAL OF THESE HAVE NO READY ANSWER
That is the normal position, not a governance failure. None of these figures is produced by ordinary financial reporting, and none is difficult to estimate once someone is asked to. It becomes a failure only after the questions have been raised and left unanswered. |
Why the Delivery Model Matters as Much as the Analysis
Each of the cases in this article ends somewhere other than actuarial. The warranty finding leads to pricing, product terms and revenue recognition. The receivables finding leads to credit policy, contract terms, security and possibly insurance. The inventory finding leads to procurement, working capital and financing. The model-governance finding leads to internal audit, technology and data controls.
An organisation that receives a technically excellent analysis and then has to procure separately for everything that follows from it has bought a calculation rather than a solution.
Dawgen Global’s Caribbean Integrated Borderless Delivery model exists to close that gap. Actuarial professionals work alongside colleagues in accounting and financial reporting, audit and assurance, enterprise risk, internal audit, technology and data, cybersecurity and AI governance, tax, human resources, corporate finance and transactions — under one engagement, one methodology and one accountable relationship, across multiple Caribbean jurisdictions.
Capability is held by the firm and delivered by a team rather than vested in an individual. For work of this kind — where a model may be relied upon for years and revisited annually — continuity of methodology and of quality standards matters more to a client than any single practitioner’s availability.
The Point of All This
Actuarial science is often described as the study of risk. It is more useful to describe it as the practice of attaching a number, and a range around that number, to a question the organisation is currently answering by assumption.
| Every organisation already prices uncertainty. The only question is whether it does so deliberately. |
The warranty was priced. The provision was set. The inventory level was chosen. In each case a number was arrived at, defended and acted upon. What was missing was not the decision but the evidence — and in all three cases the evidence was already sitting in the organisation’s own records, waiting for someone to ask it a question.
That is a smaller and more practical starting point than most boards expect. Not a transformation programme. One decision, one afternoon of arithmetic, and an honest look at what the numbers say.
How Dawgen Global Can Help
Dawgen Global helps organisations across the Caribbean quantify uncertainty, strengthen financial resilience and convert analysis into decisions. Our Actuarial & Insurance Regulatory Advisory practice works across:
- Enterprise risk quantification, stress testing and strategic scenario modelling
- Pricing, product profitability, and warranty and guarantee exposure
- Credit, receivables and customer-concentration analysis
- Actuarial model design, migration, independent validation and assumption governance
- Life and health insurance reserving, pricing and IFRS 17 effectiveness review
- Reinsurance structuring, retention strategy, and capital and solvency modelling
- Cyber and operational risk quantification
- Actuarial due diligence and transaction support
- Independent actuarial review and specialist expert support to other professional firms
Where an engagement calls for specialist capability outside that core — including pension and employee-benefit valuation, and catastrophe and climate modelling — we resource it through our associate network and coordinate delivery within the same engagement, so the client retains one relationship and one point of accountability.
| REQUEST AN ACTUARIAL RISK DISCOVERY SESSION
A structured half-day session with your board or executive team, followed by a short written output: a priority-risk map identifying which of your exposures can be quantified, what data each would require, what a first quantification would involve, and what it would cost. Fixed scope. Fixed fee. Delivered within three weeks. Email: [email protected] · Telephone: 876-929-3670 or 876-665-5926 · US toll free: 855-354-2447 Contact form: www.dawgen.global/contact-us/ |
Dawgen Global — Smarter and More Effective Decisions.
| This article is published as part of The Actuarial Advantage™, a Dawgen Global editorial series on risk quantification, insurance and long-term financial decision-making in the Caribbean. It is general commentary and does not constitute actuarial, accounting, legal or investment advice. All figures are illustrative and are used to demonstrate method; they are not estimates of any organisation’s exposure and should not be relied upon as benchmarks. |
About Dawgen Global
Dawgen Global is an independent, integrated multidisciplinary professional services firm headquartered at 47 Trinidad Terrace, New Kingston, Jamaica, serving more than 15 territories across the Caribbean. Founded and led by Dr. Dawkins Brown, Executive Chairman, the firm is independent and not affiliated with any international network. It delivers a full suite of professional services under one roof: audit and assurance; tax advisory; IT and digital transformation; risk management; cybersecurity; actuarial and insurance regulatory advisory; HR advisory; mergers and acquisitions; corporate recovery; business advisory and strategy; accounting BPO and virtual CFO services; and legal process outsourcing.
The proposition is simple: big-firm capability without the big-firm price. Dawgen Global’s integrated approach is built for the specific complexities and opportunities of the Caribbean market, helping organizations make sharper, better-informed decisions that drive measurable progress.
To explore a partnership, reach out:
- Website: dawgen.global
- Email: [email protected]
- WhatsApp (Global): +1 555-795-9071
- Caribbean offices: +1 876-665-5926 | +1 876-929-3670 | +1 876-926-5210