
Turning uncertainty into measurable, manageable and strategically useful information
What the 2025 Season Showed About Measuring Risk
When Hurricane Melissa struck Jamaica in late October 2025, the Government received a payout of US$70.8 million from the regional parametric facility — the largest single payout in that facility’s history — followed by a further US$21.1 million when a separate excess-rainfall policy triggered. The combined US$91.9 million reached the Treasury within days rather than months.
That is a genuine achievement of risk financing, and it is worth understanding precisely why. The facility itself is explicit that its payouts are designed to deliver rapid liquidity after an event, not to cover the cost of rebuilding. The payout was fast because it was parametric: it responded to measured hazard intensity against a pre-agreed model, not to an assessment of what was actually damaged.
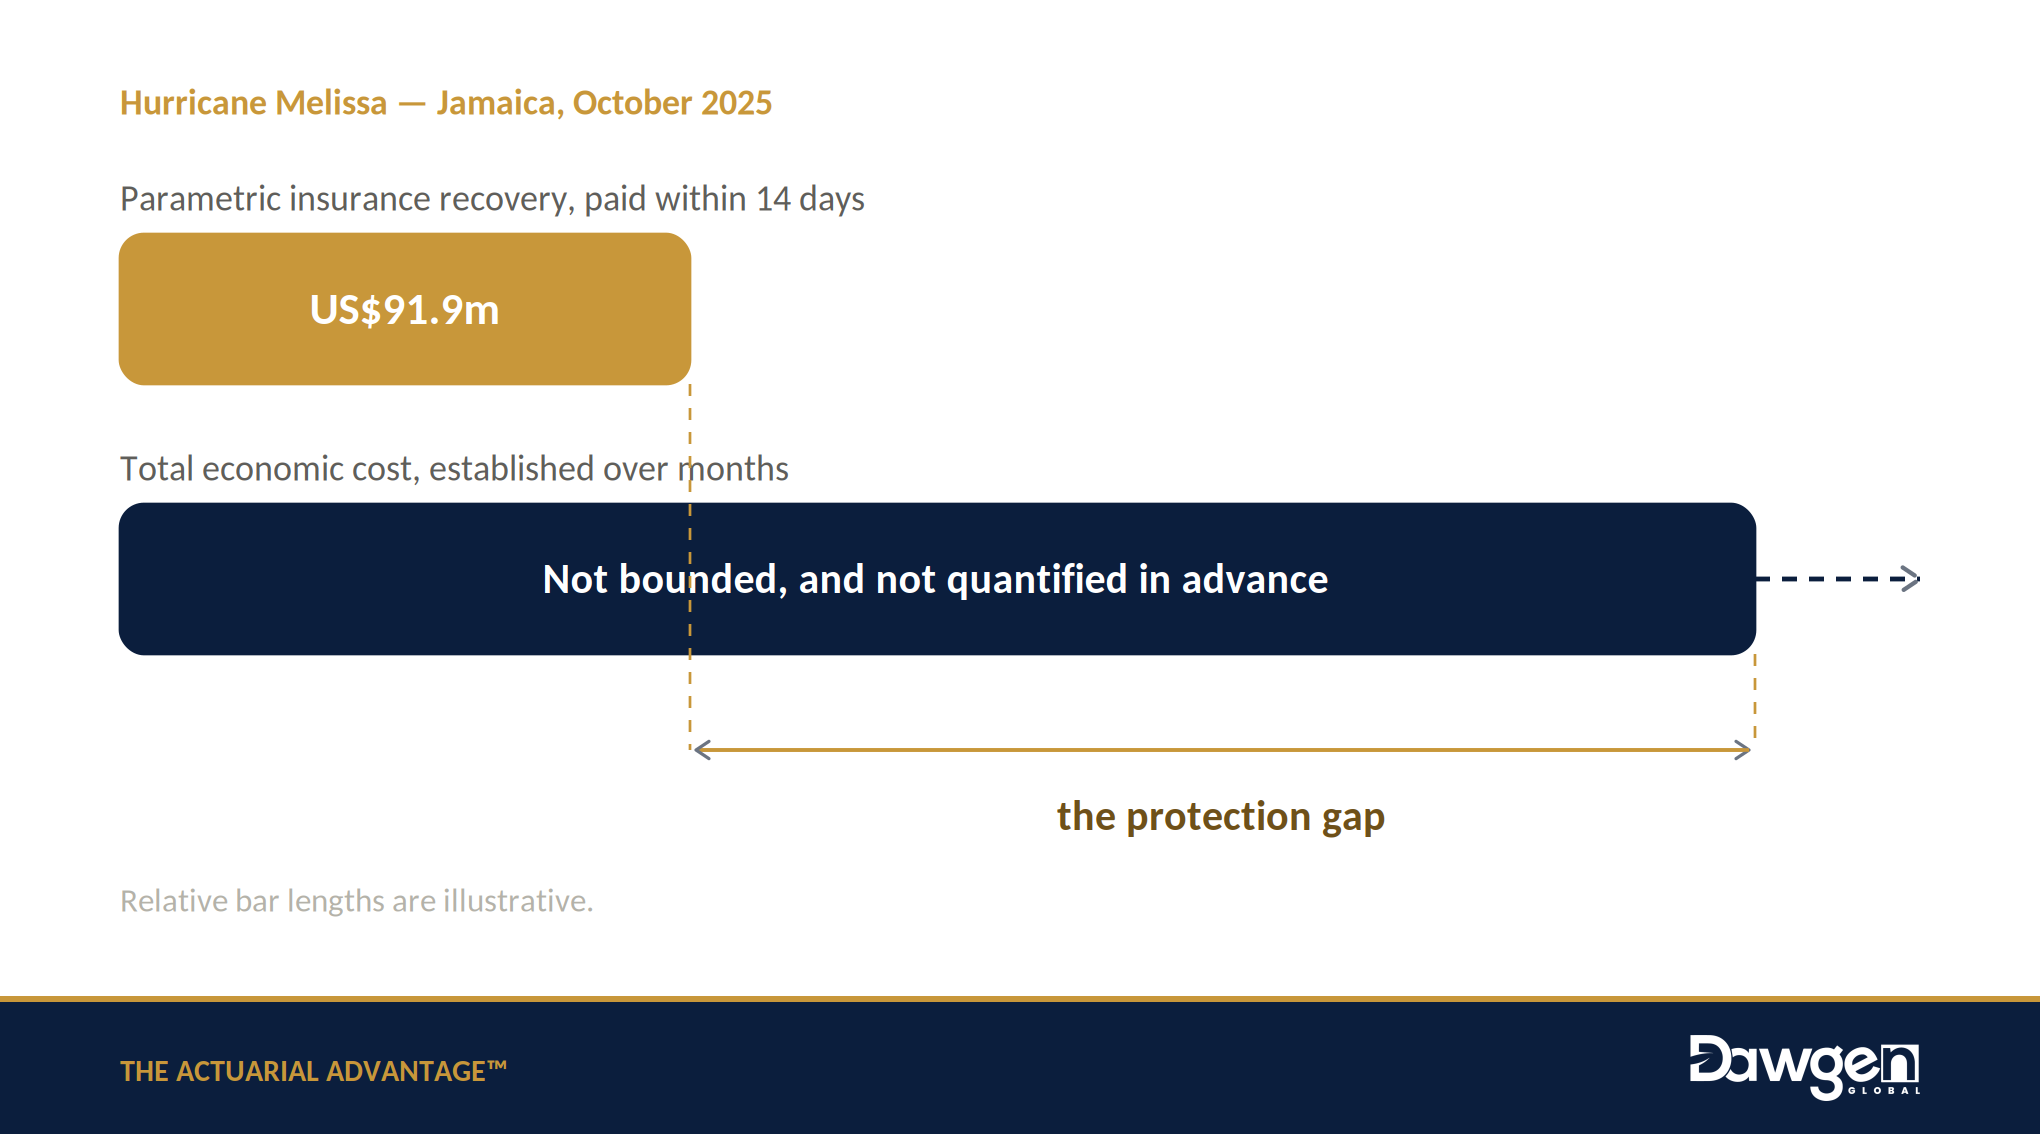
So two numbers existed after Melissa. One was known within fourteen days and was bounded by a contract signed months earlier. The other — the full economic cost absorbed by government, businesses, insurers and households — was far larger, took much longer to establish, and was bounded by nothing.
| The difference between those two numbers is the protection gap. It is not a surprise. It is a calculation — and it can be done before the storm, not after it. |
One number was bounded by a contract signed months earlier. The other was bounded by nothing.
This is the single clearest illustration of what actuarial analysis contributes. The parametric payout was quantified in advance because someone modelled the hazard, the exposure and the trigger. Everything the payout did not cover was left unquantified because nobody had been asked to model it. The distinction was not one of luck. It was one of whether the question had been posed as a measurable one.
Every Caribbean organisation carries some version of that same asymmetry: a portion of its exposure that has been priced, insured and contracted, and a larger portion that sits unmeasured on the balance sheet under a heading like “high” in a risk register.
Why Is a Risk Register Not Enough?
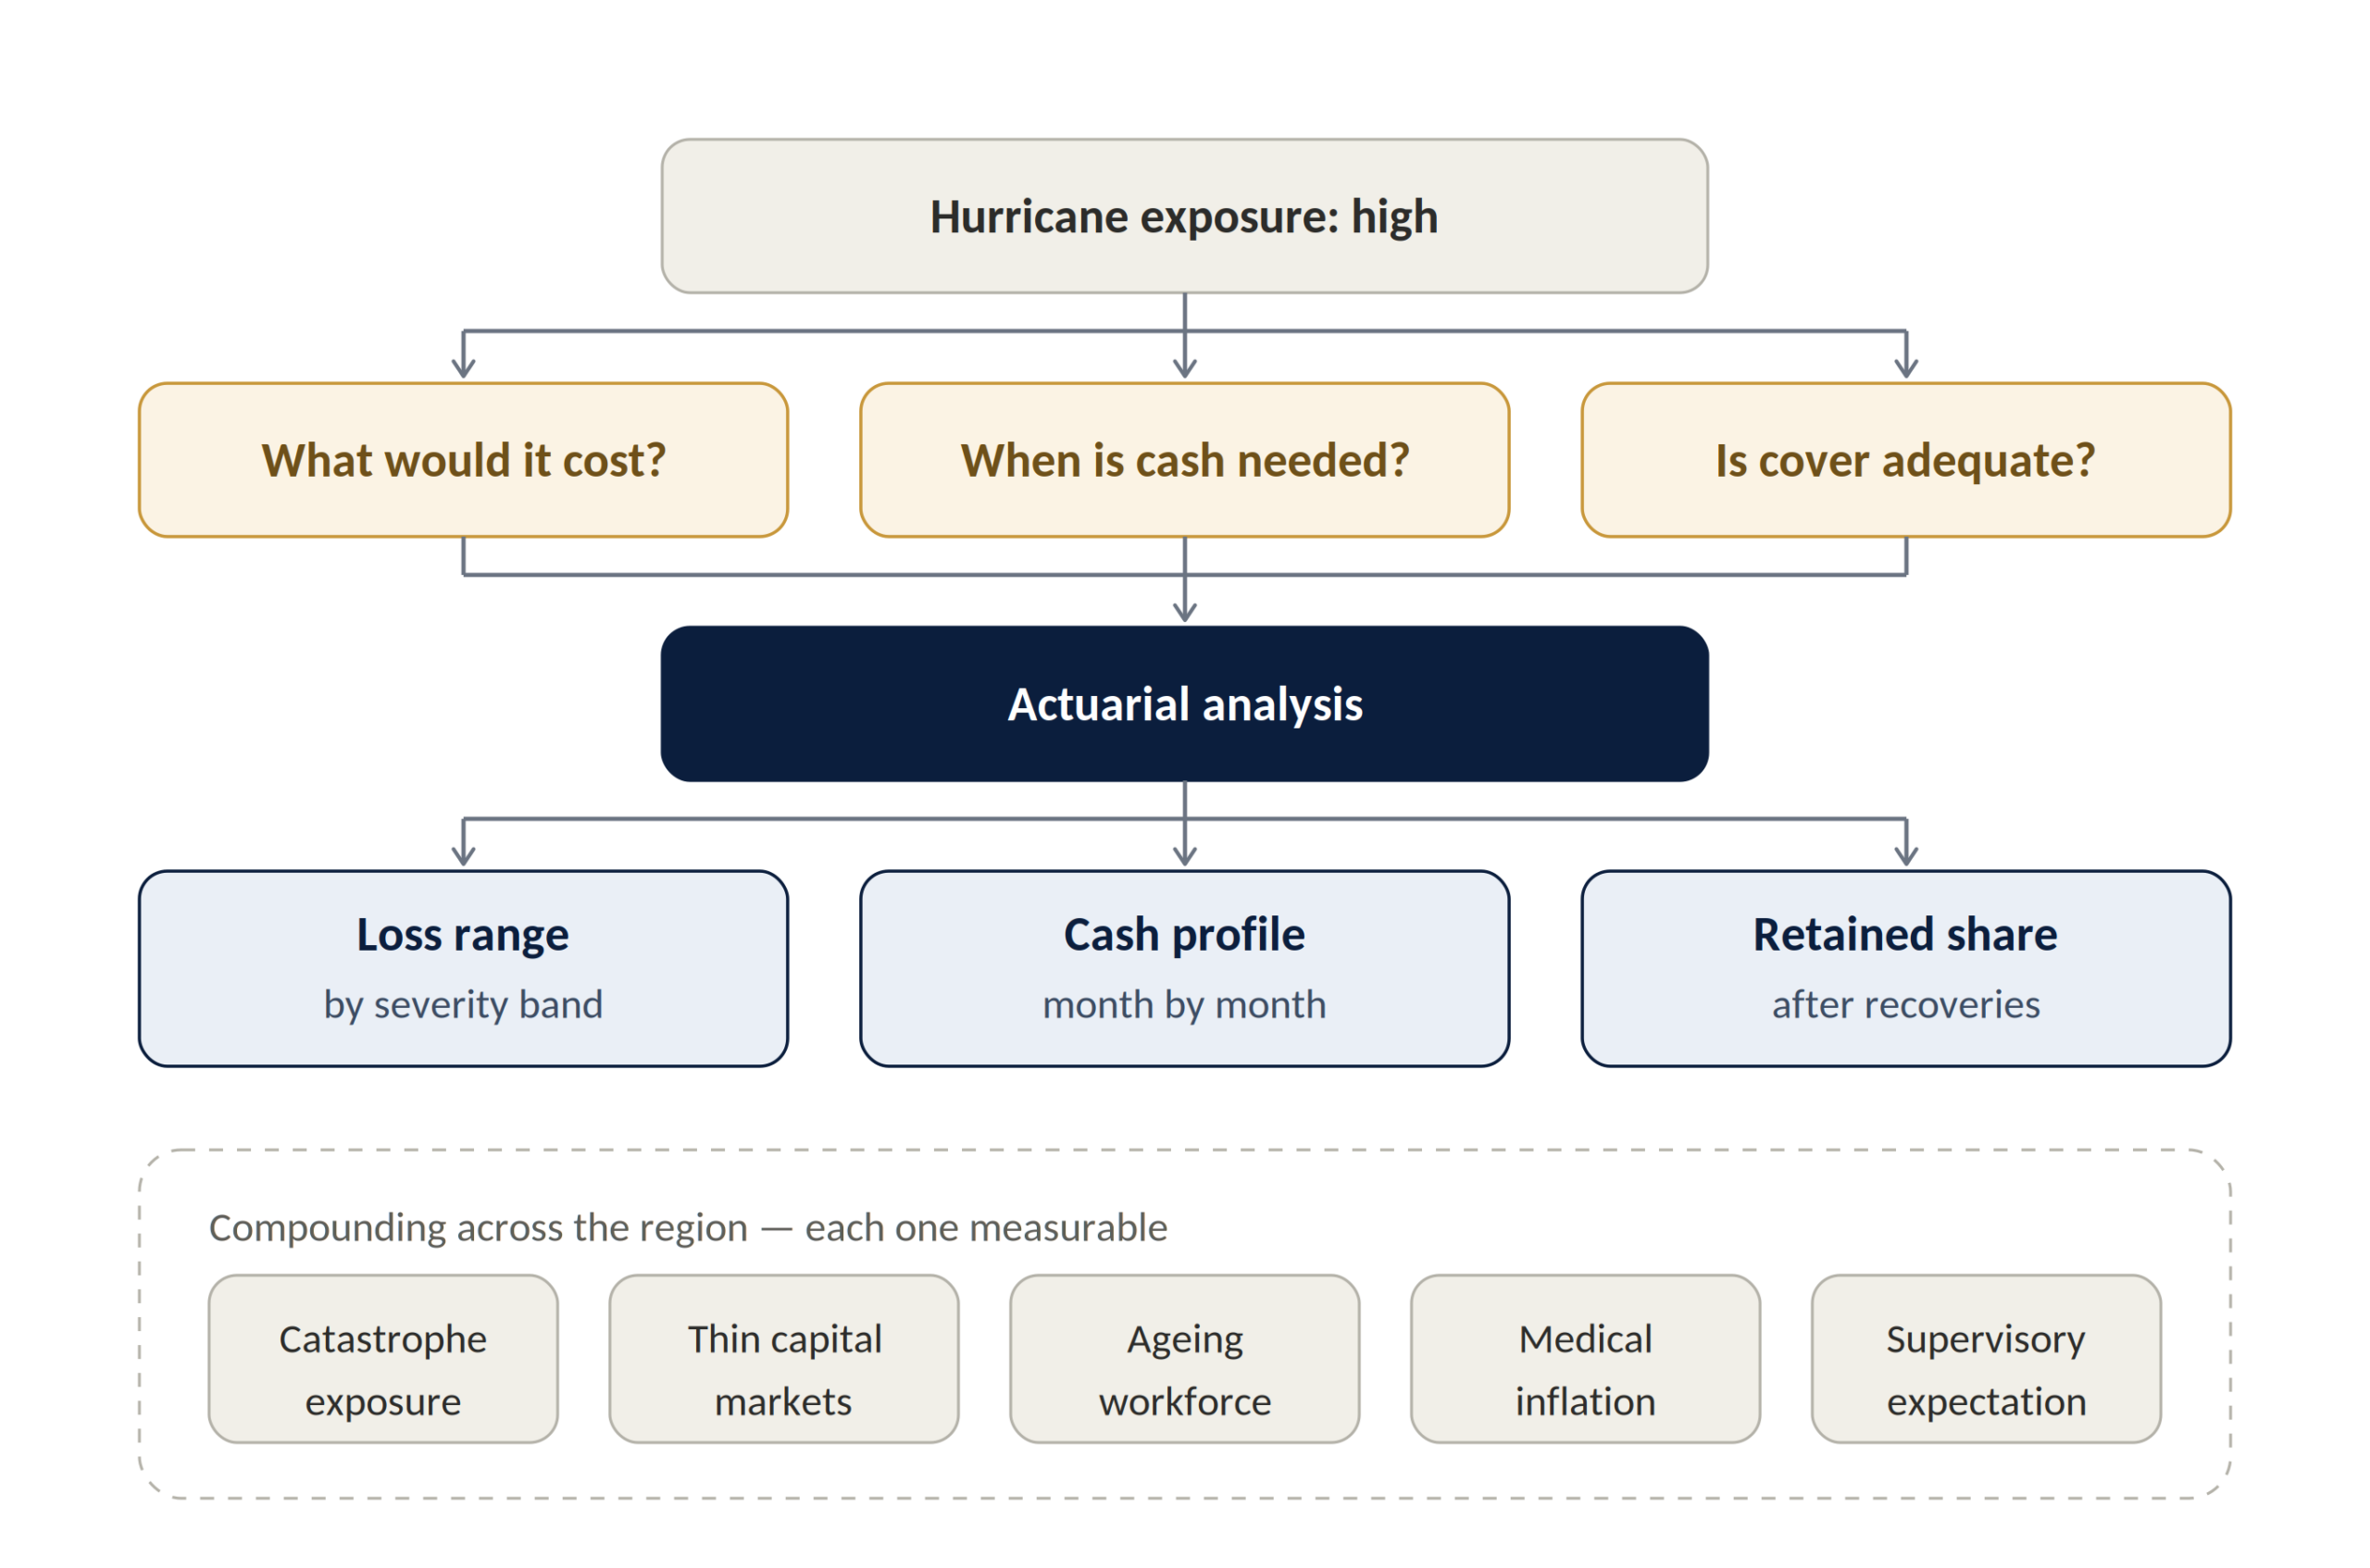
Most established organisations maintain a risk register. Risks are identified, rated low, medium or high, assigned an owner and given a mitigation plan. That is a legitimate governance instrument, and no organisation should be without one. But it is an instrument of awareness, not of decision.
A rating of “high” does not tell a board how much could be lost, how quickly, whether liquidity would hold, whether two exposures could crystallise in the same quarter, or which of three mitigation options offers the best return per dollar spent. Those are financial questions, and a colour code cannot answer them.
| The same risk, two ways | Risk register entry | Quantified exposure |
| Catastrophe | Hurricane damage to coastal assets — rated High. Owner: COO. Mitigation: insurance in place. | Modelled annual expected loss and the loss at a 1-in-100 and 1-in-250 year severity, split between property damage and business interruption; the share recoverable under current limits, deductibles and sub-limits; the residual the balance sheet absorbs; the months of cash required before recoveries arrive. |
| Employee obligations | Rising benefit costs — rated Medium. Owner: HR Director. Mitigation: monitor annually. | Present value of the obligation under current assumptions; the effect on that value of a one-percentage-point move in the discount rate, in salary growth and in medical inflation; the cash contribution profile over ten years; the effect of a change in plan design. |
| Insurance portfolio | Adverse claims development — rated High. Owner: Chief Actuary. Mitigation: reserving review. | A range around the central reserve estimate rather than a point; the probability that reserves prove deficient by more than a stated threshold; the capital consequence if they do; which accident periods and product lines drive the volatility. |
The left-hand column supports oversight. The right-hand column supports decisions — about capital, coverage, pricing and capital expenditure.
The right-hand column is not more sophisticated for its own sake. It is what allows a board to compare a proposal to spend money on mitigation against the exposure it removes. Without it, every risk conversation ends in judgement unsupported by arithmetic.
What Does Actuarial Analysis Actually Produce?
Five outputs, in ascending order of usefulness to a board.
A range instead of a point
A conventional forecast projects one number. A probabilistic model produces a distribution, which lets management distinguish between the expected outcome, a manageable downside, a severe but plausible downside, and an outcome that threatens survival. Those four are different management problems and they call for different responses. A single forecast collapses them into one and obscures the only one that matters.
The sensitivity of the answer to each assumption
The output of an actuarial model is less interesting than its gradient. Knowing that an obligation is measured at a certain figure is of limited use; knowing that it moves by fifteen per cent if the discount rate moves by one percentage point tells management exactly which variable to monitor and how much headroom to hold.
The timing of cash, not just the size of loss
Some exposures affect reported profit without creating an immediate cash demand. Others produce a severe and sudden liquidity requirement. In smaller markets with limited and slow financing options, the timing question is frequently the binding one — an organisation can be solvent and still fail because the cash arrived in month nine and was needed in month two.
A comparison between mitigation options
Mitigation costs money. Insurance, hardening, supplier diversification, benefit redesign, reserves and continuity capability all consume capital, and each buys a different combination of protection and residual exposure. Quantification allows those options to be ranked on the same basis instead of argued about.
An honest statement of what is not known
A well-constructed actuarial report is explicit about the limitations of its own model, the data it relied upon and the assumptions that drive its result. That transparency is not a weakness of the analysis. It is the part boards should read first.
How Much Should Resilience Cost?
The question a utility, hotel group or manufacturer faces before a storm season is not whether to strengthen infrastructure. It is how much strengthening is worth paying for. That is an investment appraisal, and without modelled loss it cannot be performed at all.
| ILLUSTRATION — RESILIENCE INVESTMENT APPRAISAL
A regional utility is considering US$12 million of network hardening. Catastrophe and business-interruption modelling estimates that the programme would reduce the expected annual loss from storm events — physical damage, restoration cost and revenue interruption combined — from approximately US$4.2 million to US$2.6 million. The expected annual saving is therefore about US$1.6 million, against an asset life of twenty years. On that basis alone the case is arguable. But the modelled reduction in severity at the extreme tail also changes the insurance economics: with a lower modelled loss at the higher return periods, the utility can support a materially higher retention at a reduced premium, or hold the same retention and release capital. The investment decision, the insurance decision and the capital decision are therefore the same decision. Evaluated separately — as they usually are — each looks marginal. Evaluated together, the programme may be clearly justified, or clearly not. Figures are illustrative. |
Evaluated separately, each decision looks marginal. Evaluated together, the case is clear. Figures illustrative.
The general point extends well beyond utilities. Any capital expenditure justified partly on risk reduction — flood defences, backup generation, redundant systems, geographic diversification of stock — is being approved or declined today on judgement where arithmetic is available.
Why Do Small Assumption Changes Move Large Numbers?
Long-dated obligations are unusually sensitive to their inputs, and the sensitivity is arithmetic rather than opinion. The present value of a stream of future payments moves approximately in proportion to its duration multiplied by the change in the discount rate.
| ILLUSTRATION — DISCOUNT RATE SENSITIVITY
An obligation with a duration of roughly fifteen years measured at US$40 million will move by approximately fifteen per cent — about US$6 million — for each one-percentage-point change in the discount rate. That single input, chosen once a year and frequently with limited debate, can therefore move the measured obligation by more than the organisation’s annual profit. Salary growth, medical inflation and mortality assumptions each carry their own gradient, and they interact. Which is why the useful question for a board is never “what is the obligation?” It is “which three assumptions is this number most sensitive to, who selected them, and what would have to be true for them to be wrong?” Figures are illustrative. |
The useful question is not what the obligation is, but which assumptions carry it. Figures illustrative.
The same logic applies to insurance reserves, warranty provisions, self-insured retentions, long-service awards, post-employment medical commitments and any accumulated leave obligation carried at present value. In each case a small number of assumptions carries most of the answer, and in most organisations those assumptions are neither documented nor independently challenged.
How Much Risk Should an Insurer Keep?
For Caribbean insurers, one of the most consequential and least independently examined decisions is retention: how much risk to keep and how much to cede. It is consequential because it drives both earnings volatility and capital requirement. It is rarely examined independently because the parties best placed to advise on it — brokers and reinsurers — are also parties to the transaction.
The actuarial question is straightforward to state and demanding to answer. Raising a retention reduces ceded premium, which improves the expected result. It also widens the distribution of outcomes, which consumes capital and increases the probability of a poor year. The correct retention is the point at which the premium saved exceeds the risk-adjusted cost of the additional volatility, given the insurer’s own capital position and risk appetite — not the market convention, and not last year’s structure carried forward.
Answering it requires the insurer’s own claims experience, a credible severity distribution, an explicit view of correlation across the portfolio, and a stated capital constraint. That is an actuarial exercise, and an independent one is not the same as one performed by a counterparty to the placement.
Is IFRS 17 Producing Management Information or Only Compliance?
IFRS 17 required insurers to rebuild measurement, systems, data and reporting simultaneously. That work is now largely behind the region. The strategic question has moved.
The useful test is whether the standard has changed any decision. If pricing, product design, reinsurance structure or capital allocation look the same as they did before adoption, then a substantial investment has produced a compliance output and nothing else. Boards are entitled to ask why.
- Data and models. Is the actuarial and financial data reliable, reconciled and controlled to the standard an auditor or supervisor would expect?
- Assumption governance. Are assumptions set through a documented process, approved at the right level, and consistent across products and periods?
- Can management explain the movement in insurance service result to a board or an investor without recourse to the model itself?
- Operating model. Are finance, actuarial, risk and technology operating as one process, or as four handoffs with reconciliation at each boundary?
- Decision use. Has any pricing or product decision actually been changed by information the standard produced?
Who Validates the Model?
Every actuarial model is a simplification. Its usefulness depends on data quality, assumption reasonableness, methodological fit, the objectivity of those who built it, the controls around changes to it, and the willingness of the organisation to act on what it says.
| A model can produce a precise number without producing a reliable answer. Precision and accuracy are different properties, and only one of them is visible in the output. |
This matters more each year, for two reasons. Models are increasingly embedded in pricing, reserving, capital and regulatory reporting, so an error propagates further and faster than it once did. And the growing use of machine learning in pricing and underwriting introduces models whose behaviour is harder to inspect, harder to explain to a supervisor and harder to challenge at board level.
The governance questions are simple and are asked far too rarely. Does the organisation maintain an inventory of the models on which material numbers depend? Is each of them owned by a named individual? Are material models independently validated by someone who did not build them? Are assumption changes documented, approved and version-controlled? Is model performance compared against actual experience, and does anyone act when it diverges?
An organisation that cannot answer those questions is relying on outputs it has not tested. In-house actuarial teams cannot validate their own work, and the consulting actuary who built a model is not the right party to review it. Independence here is structural, not a matter of good intentions.
Neither party that built the model can review it. That is a structural fact, not a comment on competence.
From Annual Valuation to Continuous Monitoring
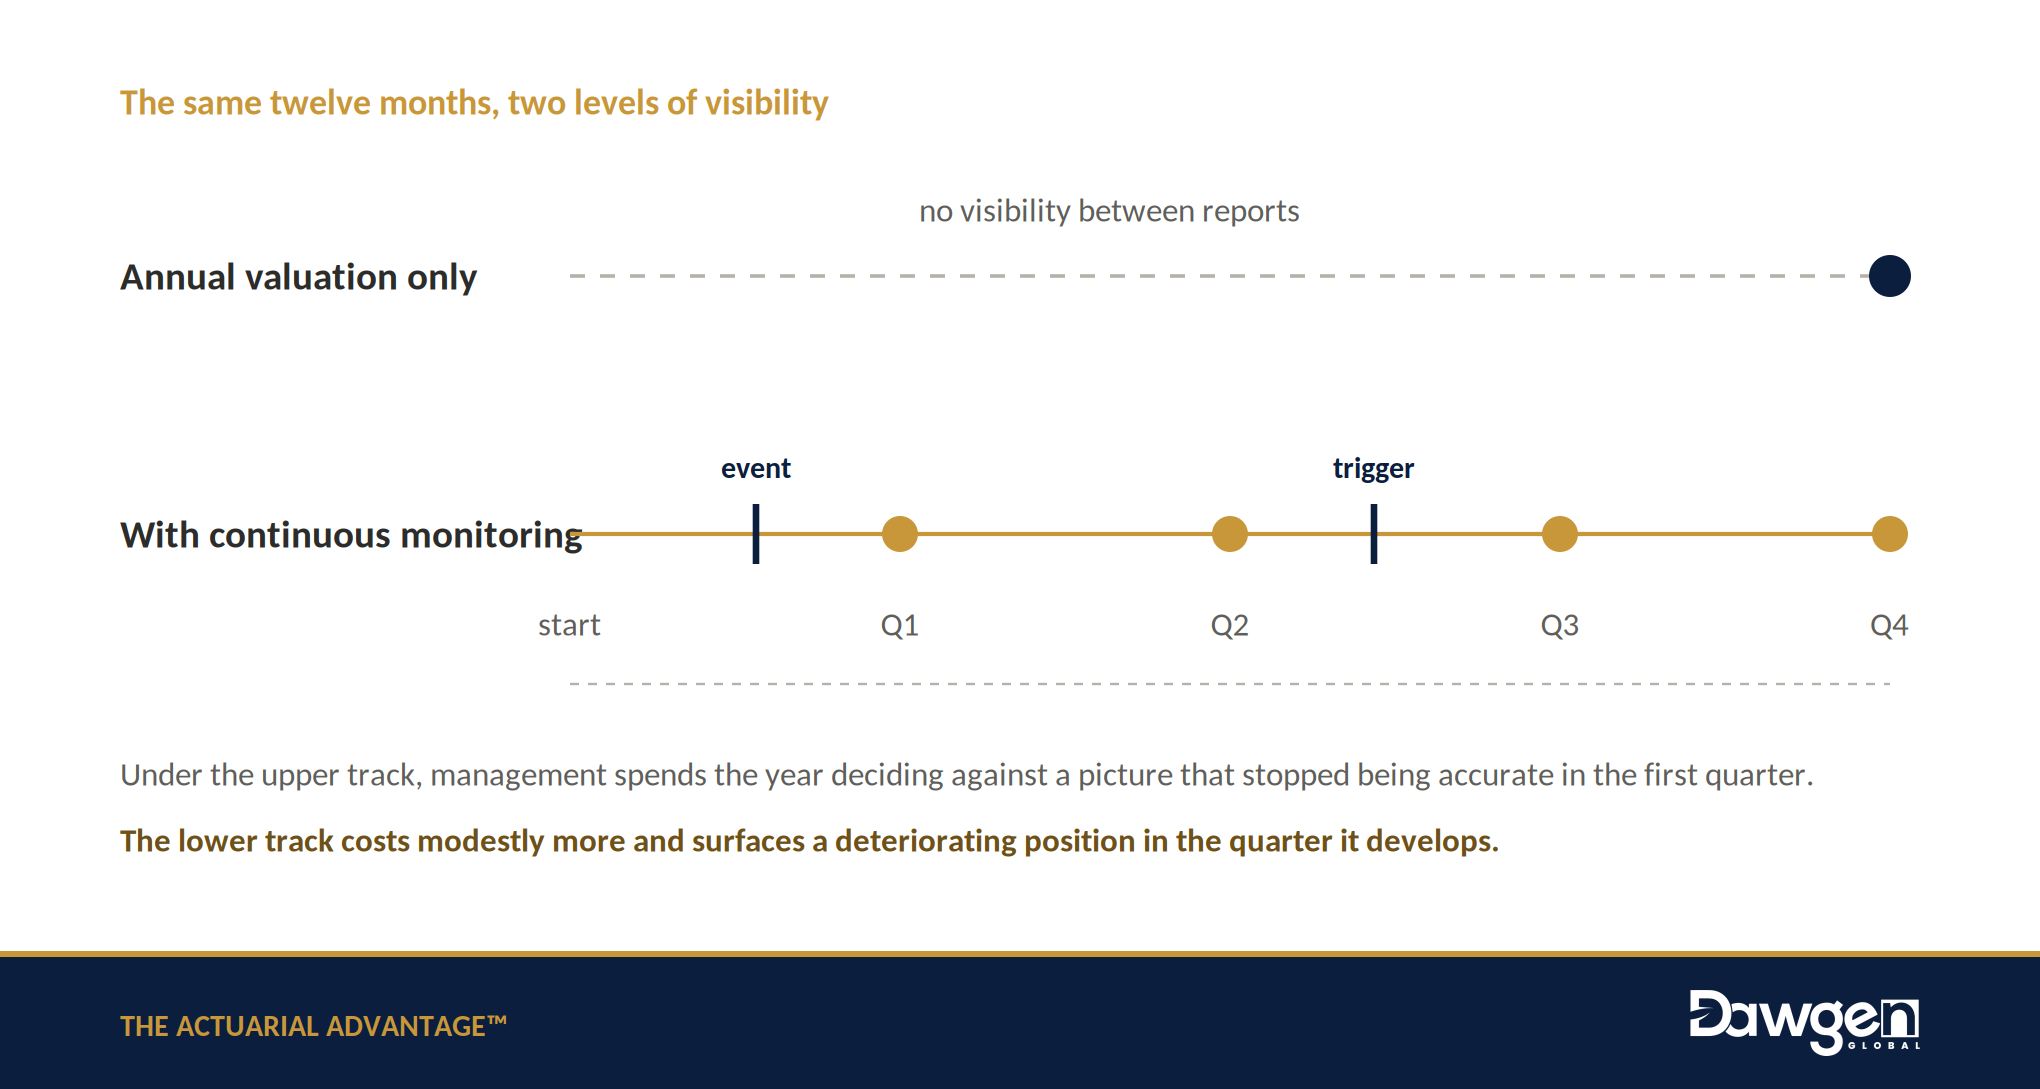
Many organisations commission actuarial work only when a report is required — for financial statements, for a regulator, for trustees. The valuation arrives, is filed, and is not revisited for twelve months.
Meanwhile the assumptions underlying it move. Interest rates change. Investment returns diverge from expectation. Claims experience emerges. Medical costs escalate. Workforce composition shifts. A catastrophe occurs. By the time the next valuation is prepared, management has spent a year making decisions against a picture that stopped being accurate in the first quarter.
The lower track costs modestly more and surfaces a deteriorating position in the quarter it develops.
| Component | What it does | Frequency |
| Comprehensive valuation | Full measurement and reporting on the statutory or accounting basis | Annual |
| Assumption monitoring | Tracks the small number of assumptions that drive most of the answer against actual experience | Quarterly |
| Trigger thresholds | Pre-agreed movements that automatically escalate to management without waiting for the cycle | Continuous |
| Event-driven scenario update | Re-runs key scenarios after a catastrophe, a rate move or a significant regulatory change | As required |
| Board dashboard | A short standing report showing exposure movement and emerging pressure | Quarterly |
| Back-testing | Compares modelled outcomes against what actually happened, and adjusts method accordingly | Annual |
A practical structure for converting periodic actuarial compliance into continuing management intelligence.
The additional cost of this structure is modest relative to the annual valuation it surrounds. The value is that management learns of a deteriorating position in the quarter it develops rather than in the year it is reported.
Where Else the Analysis Applies
The techniques discussed above are not confined to insurers. The table below indicates where the same methods produce decision-useful information in other settings common across the region.
| Setting | The question | What quantification adds |
| Employers with long-term benefits | What do our pension, post-employment medical, long-service and severance commitments actually cost, and how sensitive are they? | Converts a year-end accounting exercise into an input to workforce strategy, remuneration policy and cash planning |
| Healthcare and social protection | How will medical inflation, utilisation and population ageing affect expenditure over ten and twenty years? | Allows contribution rates, benefit design and financing structures to be tested before they fail rather than after |
| Transactions and investment | What long-tail or uncertain liabilities does traditional financial due diligence not capture? | Surfaces reserve adequacy, benefit deficits, claims development, warranty and self-insured exposures that affect price, structure and indemnities |
| Lenders and financial institutions | How do credit, liquidity and concentration exposures behave under stress, and are the models governing them controlled? | Supports stress testing, capital planning and model-risk governance on the same methodological basis |
| Public bodies and governments | How do disaster financing, social security and health financing interact with fiscal capacity over the long term? | Provides a defensible basis for reform proposals and for negotiating risk-transfer arrangements |
The International Monetary Fund has documented the link between natural-disaster exposure and fiscal sustainability in the Eastern Caribbean, including the effect on financing needs and public debt — a public-sector version of precisely the protection-gap arithmetic described at the start of this article.
Twelve Questions a Board Should Be Able to Answer
Not to become actuaries — boards do not need to be. But a board that cannot answer these is governing an exposure it has not measured.
- Which of our strategic objectives is most exposed to uncertainty, and by how much?
- Have we expressed our principal risks in financial terms, or only in ratings?
- Which three assumptions have the greatest influence on our reported numbers?
- What severe but plausible scenario would threaten our liquidity, and in what month?
- Are our insurance limits, deductibles and exclusions aligned to our modelled exposure, or to last year’s renewal?
- How much risk are we retaining, deliberately or by default, and what is it costing us in volatility?
- Are our long-term employee obligations measured on assumptions we can defend?
- Which models produce material numbers in our financial statements, and who validated them?
- Can management explain the difference between our expected, adverse and extreme outcomes?
- What would a major catastrophe do to revenue, covenant compliance and financing capacity?
- Do we use actuarial output for decisions, or only for filing?
- How quickly would we know if a key assumption had stopped holding?
| IF SEVERAL OF THESE CANNOT BE ANSWERED
That is not a governance failure. It is the normal position for most organisations, because nobody has been asked to produce the answers. It becomes a governance failure only once the questions have been raised and left unanswered. |
Why the Delivery Model Matters as Much as the Analysis
Actuarial findings rarely stay within actuarial boundaries. A benefit valuation touches accounting, tax, cash flow, employee relations and workforce strategy. An insurance reserve touches financial reporting, capital adequacy, audit evidence and regulatory compliance. A catastrophe model touches insurance, continuity, capital expenditure, financing and impairment.
An organisation that receives a technically excellent actuarial report and then has to procure separately for the accounting treatment, the systems change, the control redesign and the tax consequence has bought an analysis, not a solution. The finding is handed back and the work of acting on it begins again from the beginning.
Dawgen Global’s Caribbean Integrated Borderless Delivery model exists to close that gap. Actuarial professionals work alongside colleagues in accounting and financial reporting, audit and assurance, enterprise risk, internal audit, technology and data, cybersecurity and AI governance, tax, human resources, corporate finance, transactions and regulatory compliance — under one engagement, one methodology and one accountable relationship, across multiple Caribbean jurisdictions.
| What it provides | Why it matters |
| Institutional capability | Capability is held by the firm and delivered by a team. Methodology, quality standards and review protocols belong to the practice, not to an individual — so continuity does not depend on any one person’s availability. |
| Regional consistency | Groups operating in several territories receive common methodology, assumption governance and reporting formats, with country-specific requirements addressed within that framework. |
| Multidisciplinary follow-through | The team expands as the engagement moves from measurement into reporting, controls, technology, assurance or strategy — without re-procurement. |
| Independence where it is required | Independent review and validation delivered by a party structurally separate from both the in-house function and the incumbent adviser. |
| Decision-focused reporting | Findings are connected explicitly to capital, financial reporting, workforce, controls and strategic plans — not delivered as a calculation and left there. |
The Strategic Conclusion
Caribbean organisations cannot eliminate uncertainty. They can measure it, and measurement changes what is possible. It converts a debate into a comparison, a colour code into a capital requirement, and a fear into a budget line with a defensible number attached to it.
| Risk should not be discussed only in words when its consequences will eventually be measured in money, time, capital and organisational capacity. |
The organisations best prepared for what comes next will not be those that believe they can forecast it. They will be those that understand the range of outcomes they are exposed to, know which assumptions carry most of the answer, and have decided in advance what they will do when those assumptions stop holding.
That preparation is available now, and it starts with a smaller question than most boards expect: which of our exposures could be quantified, and what would it take to quantify them?
How Dawgen Global Can Help
Dawgen Global helps organisations across the Caribbean quantify uncertainty, strengthen financial resilience and convert actuarial insight into decisions. Our Actuarial & Insurance Regulatory Advisory practice works across:
- Life and health insurance reserving, pricing, product profitability and experience analysis
- Reinsurance structuring, retention strategy, and capital and solvency modelling
- Actuarial model design, migration, independent validation and assumption governance
- IFRS 17 effectiveness, data and control review, and finance–actuarial operating model design
- Enterprise risk quantification, stress testing and strategic scenario modelling
- Actuarial due diligence and transaction support
- Independent actuarial review and specialist expert support to other professional firms
Where an engagement calls for specialist capability outside that core — including pension and employee-benefit valuation, and catastrophe and climate modelling — we resource it through our associate network and coordinate delivery within the same engagement, so the client retains a single relationship and a single point of accountability.
Dawgen Global — Smarter and More Effective Decisions.
Sources and Further Reading
- CCRIF SPC — payout announcements and facility publications, including the 2025 payouts to the Government of Jamaica following Hurricane Melissa and the facility’s statement of purpose regarding rapid liquidity. ccrif.org
- Caribbean Actuarial Association — Research Hub: regional regulatory environment, risk-based capital and solvency, actuarial valuation, IFRS 17, climate change and digital transformation. caribbeanactuaries.com/research-hub
- International Monetary Fund — Fiscal Sustainability and Natural Disaster Risks in the ECCU, Selected Issues Paper. imf.org
- IFRS Foundation — IFRS 17 Insurance Contracts. ifrs.org
- Financial Services Commission, Jamaica — insurance industry guidance, including guidance on the responsibilities of the Appointed Actuary and on the valuation of actuarial reserves and other policy liabilities. fscjamaica.org
| This article is published as part of The Actuarial Advantage™, a Dawgen Global editorial series on risk quantification, insurance and long-term financial decision-making in the Caribbean. It is general commentary and does not constitute actuarial, accounting, legal or investment advice. Illustrative figures are used to demonstrate method and are not estimates of any organisation’s exposure. Regulatory requirements vary by territory and should be confirmed against the applicable instruments. |
About Dawgen Global
Dawgen Global is an independent, integrated multidisciplinary professional services firm headquartered at 47 Trinidad Terrace, New Kingston, Jamaica, serving more than 15 territories across the Caribbean. Founded and led by Dr. Dawkins Brown, Executive Chairman, the firm is independent and not affiliated with any international network. It delivers a full suite of professional services under one roof: audit and assurance; tax advisory; IT and digital transformation; risk management; cybersecurity; actuarial and insurance regulatory advisory; HR advisory; mergers and acquisitions; corporate recovery; business advisory and strategy; accounting BPO and virtual CFO services; and legal process outsourcing.
The proposition is simple: big-firm capability without the big-firm price. Dawgen Global’s integrated approach is built for the specific complexities and opportunities of the Caribbean market, helping organizations make sharper, better-informed decisions that drive measurable progress.
To explore a partnership, reach out:
- Website: dawgen.global
- Email: [email protected]
- WhatsApp (Global): +1 555-795-9071
- Caribbean offices: +1 876-665-5926 | +1 876-929-3670 | +1 876-926-5210