
Why Caribbean CEOs Must Read Ratios, Not Just Results
| IN BRIEF
Net profit is the number most Caribbean chief executives manage to, and it is the number lenders, investors and buyers trust least. They judge a business on a handful of ratios built on two measures of operating earnings: EBITDA (earnings before interest, tax, depreciation and amortisation) and EBITA (earnings before interest, tax and amortisation). This article explains both, why the difference between them matters, and a five-question test any CEO can run this week to find out whether they are reading the same numbers as the people who fund them. |
SECTION 1
The year profit rose and the bank said no

The board pack arrived on a Thursday, and the chief executive had every reason to be pleased. Reported profit before tax was up forty per cent on the prior year. Revenue had grown. A new warehouse had been completed on time. The chairman opened the meeting by congratulating management on the best result in the company’s history.
The following Tuesday, the company’s bank declined a request to increase its term facility. The letter was polite and brief. It noted that net debt stood at three times EBITDA, that debt service coverage had fallen below the level the bank required for additional lending, and that the bank would be pleased to revisit the request once leverage had reduced.
The chief executive read the letter twice. Profit was up forty per cent. How could the business be a worse credit than it had been a year ago?

The answer, when the finance manager walked through it, was uncomfortable. The whole of the increase in profit, and more, came from a revaluation of the company’s land and a foreign exchange gain on a US dollar deposit. Neither produced a dollar of cash. Neither had anything to do with how well the business had traded. Underneath them, EBITDA had grown by about seven per cent, EBITA had not grown at all, and profit from trading had actually fallen, while borrowing to fund the warehouse had risen sharply. The bank had not looked at profit at all. It had looked at EBITDA, at net debt, at interest cover and at cash. On those numbers, the business had become more stretched, not less.
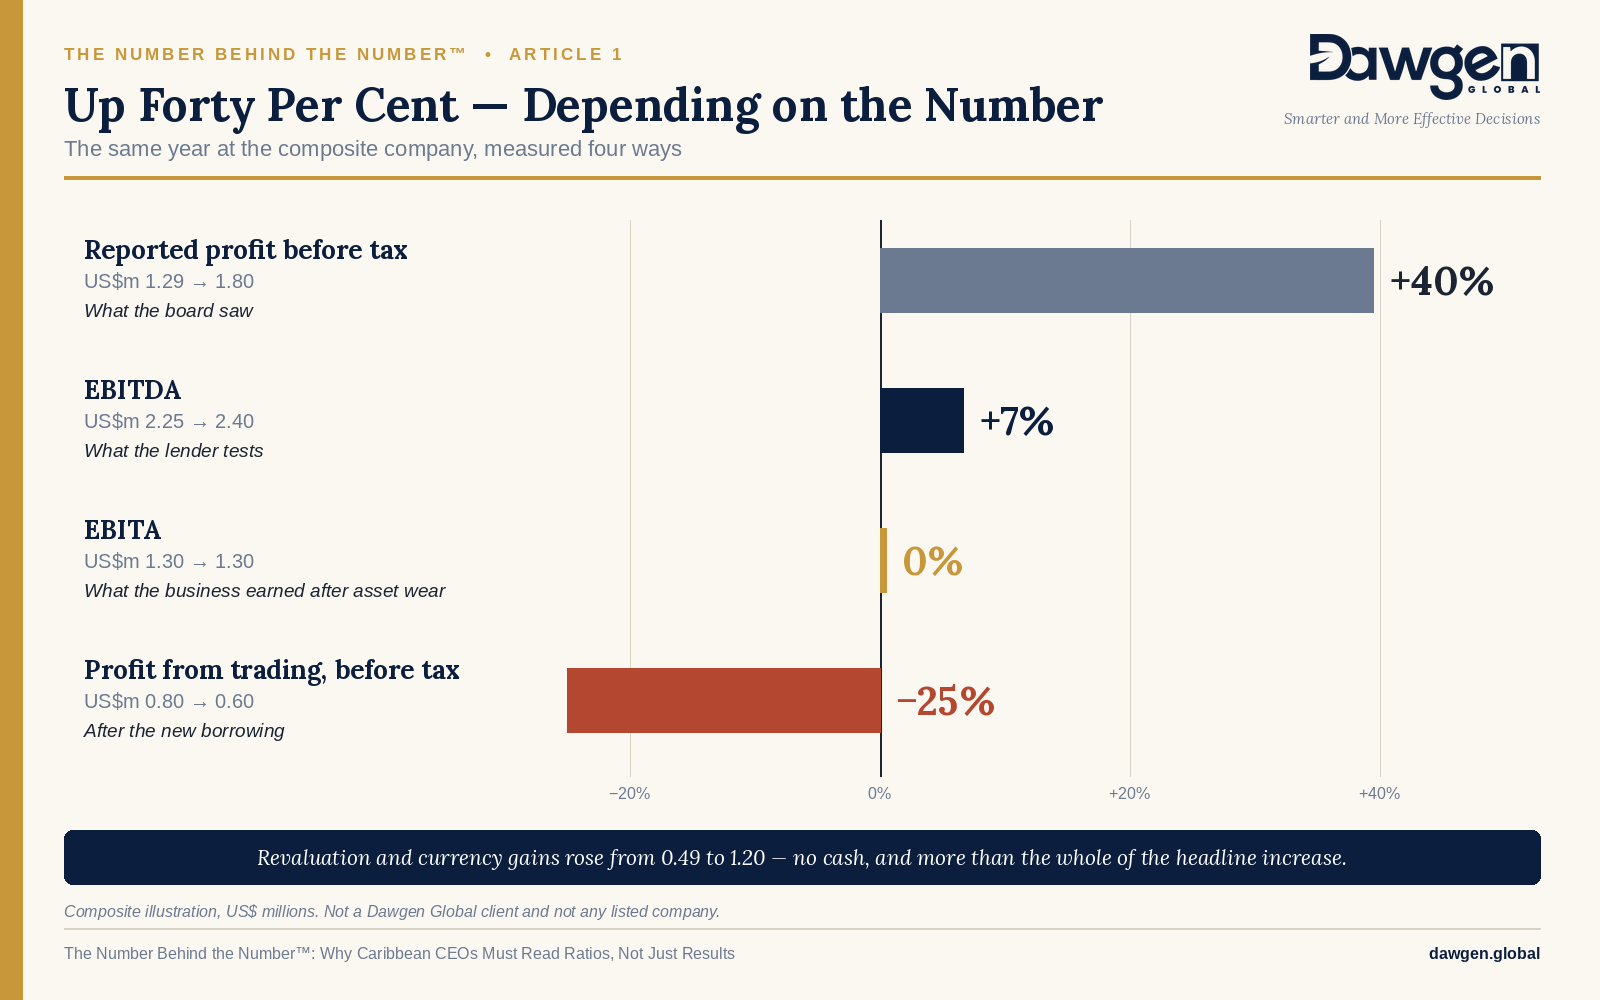
This is a composite, drawn from patterns seen repeatedly across the region rather than from any single company. But the gap it describes is real, and it is common.
The chief executive was managing one number. The people who fund the business were managing five others. Nobody had told the chief executive which five.
That gap is the subject of this series.
SECTION 2
The Number Behind the Number™ and the E·B·I·T·A Lens™
The Number Behind the Number™ is a twelve-part series on the ratios that decide how a business is financed, valued and judged. Each article stands on its own, so the framework is set out in full here and in every article that follows.
Two measures, one difference
Both measures start from the same place: what the business earns from its operations, before the cost of financing it and before tax. They differ in one line.
EBITDA — earnings before interest, tax, depreciation and amortisation — shows operating earnings before any charge for the assets the business uses. It is the number bankers, bond arrangers and buyers quote most often, because it strips out financing choices, tax positions and accounting estimates, and so allows one business to be compared with another.
EBITA — earnings before interest, tax and amortisation — deducts depreciation. Depreciation is the accounting recognition that trucks, machinery, buildings, refrigeration and computers wear out and must eventually be replaced. EBITA still excludes amortisation, which mostly relates to intangible assets such as acquired goodwill, customer lists and some software.
The difference between the two is simply depreciation:
| EBITDA − EBITA = Depreciation |
Neither measure is right and the other wrong. EBITDA is the better lens for comparing operating efficiency and for conversations about how much debt the business can service. EBITA is the better lens wherever replacing physical assets is a real, recurring cost of staying in business, which in this region is most businesses that own a building, a fleet or a production line.
The Wear Ratio
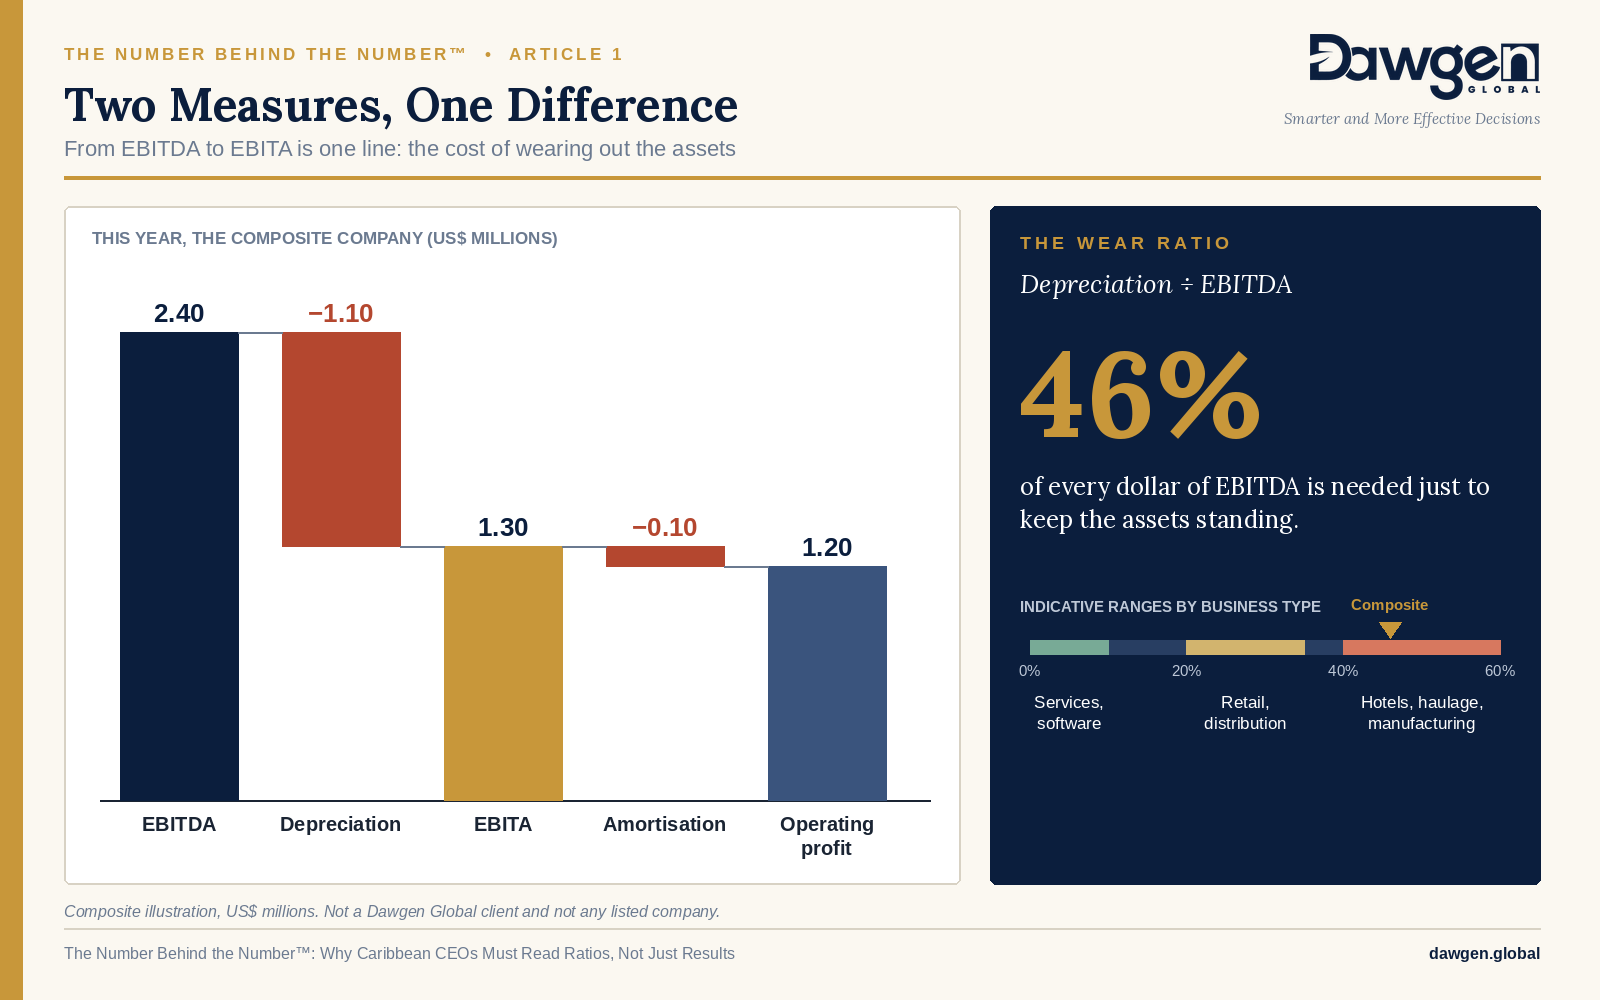
The series uses one additional measure to connect the two. The Wear Ratio expresses depreciation as a share of EBITDA:
| Wear Ratio = Depreciation ÷ EBITDA |
It answers a plain question: of every dollar the business earns before charging for its assets, how much is needed just to keep those assets standing? A consulting practice may have a Wear Ratio below ten per cent. A hotel, a haulage company or a manufacturer may be above forty. The higher it is, the further EBITDA overstates what the owners can safely take out or borrow against.
The five lenses
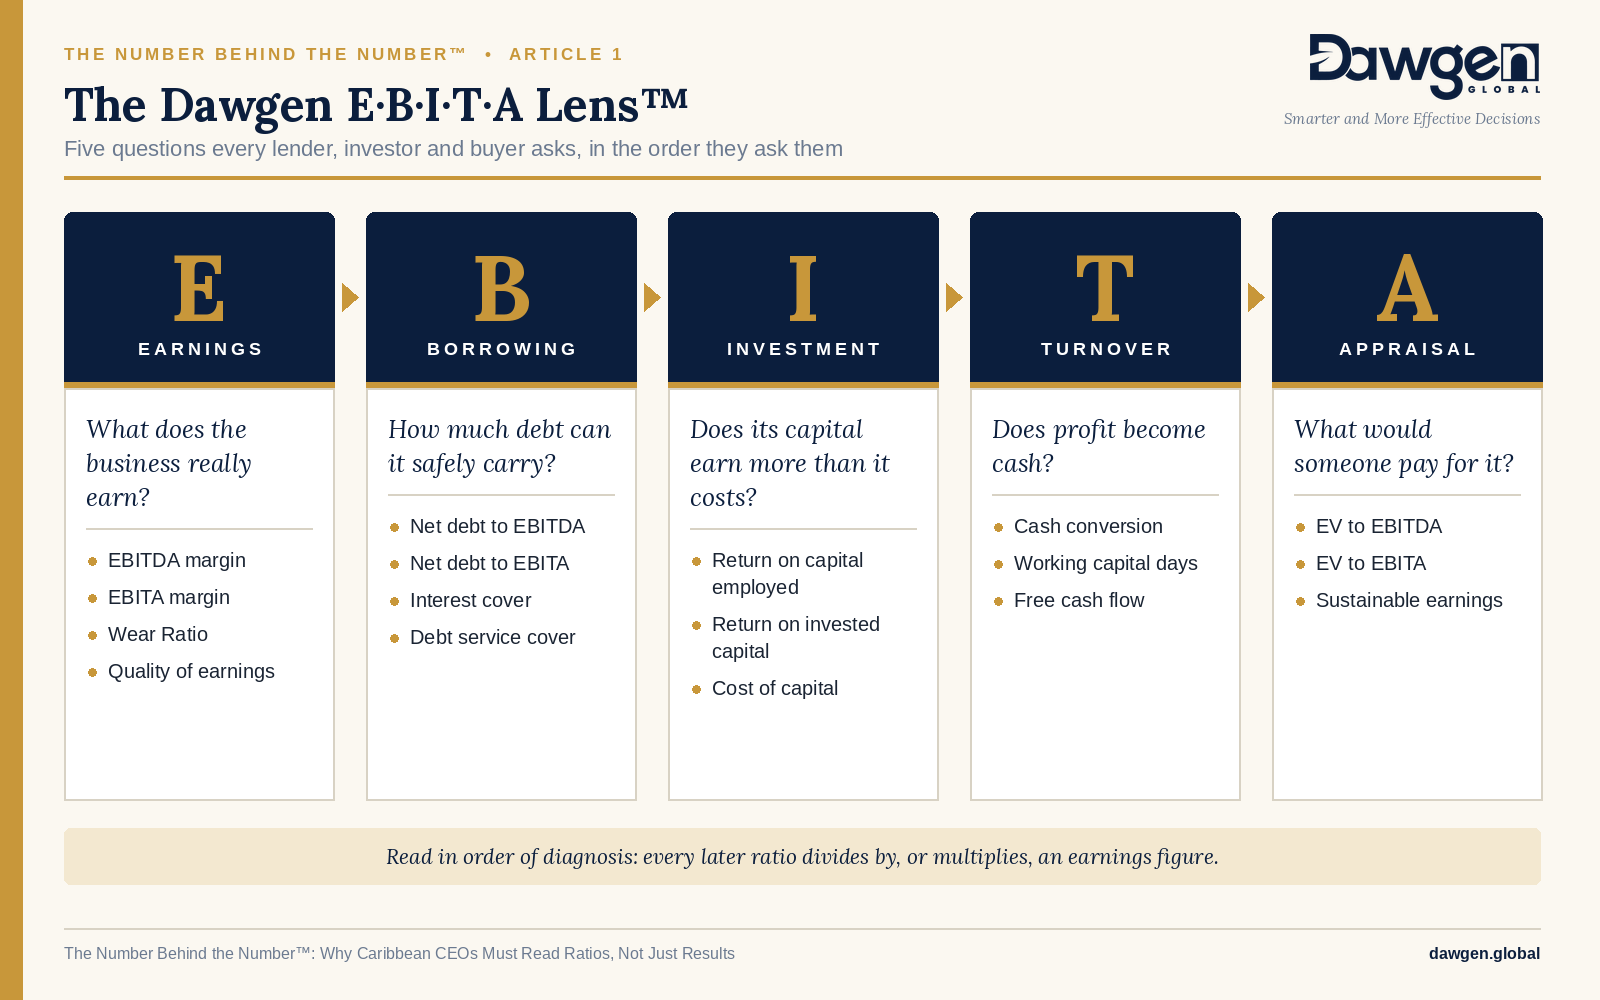
The Dawgen E·B·I·T·A Lens™ turns the acronym into five questions. Every serious reader of a company’s accounts asks them, in roughly this order.
| Lens | The question | The ratios that answer it |
| E — Earnings | What does the business really earn? | EBITDA margin, EBITA margin, Wear Ratio, quality of earnings |
| B — Borrowing | How much debt can it safely carry? | Net debt to EBITDA and to EBITA, interest cover, debt service coverage ratio (DSCR) |
| I — Investment | Does its capital earn more than it costs? | Return on capital employed (ROCE), return on invested capital (ROIC) |
| T — Turnover | Does profit become cash? | Cash conversion, working capital days, free cash flow |
| A — Appraisal | What would someone pay for it? | Enterprise value (EV) to EBITDA and to EBITA |
Earnings come first because every later ratio divides by, or multiplies, an earnings figure. If the earnings number is wrong, every ratio built on it is wrong in the same direction.
SECTION 3
The pattern: why profit misleads

Net profit is not a false number. It is an audited, standards-compliant measure of what happened to the owners’ equity over a period. The difficulty is that it answers a different question from the one a CEO most needs answered, which is: how well is the business trading, and can it sustain it?
Profit is, in a precise sense, an opinion. It is the result of hundreds of judgements about valuation, timing, estimates and presentation, all of them legitimate, many of them made far from the shop floor. Four kinds of item sit inside net profit and have little to do with how the business traded.
- Interest reflects how the business chose to fund itself, not how well it operates. Two identical businesses, one funded by the owner and one by the bank, report very different profits.
- The tax charge reflects incentives, losses carried forward, the territory the income falls in and planning decisions. It says little about operating performance.
- Asset consumption. Depreciation and amortisation follow accounting policies and estimated useful lives. They are real costs, but their size in any one year depends on choices about method and timing.
- Items outside trading. Revaluation gains on property, fair value movements on investments, currency gains and losses, and profits on asset disposals can all move reported profit sharply without any change in the underlying business.
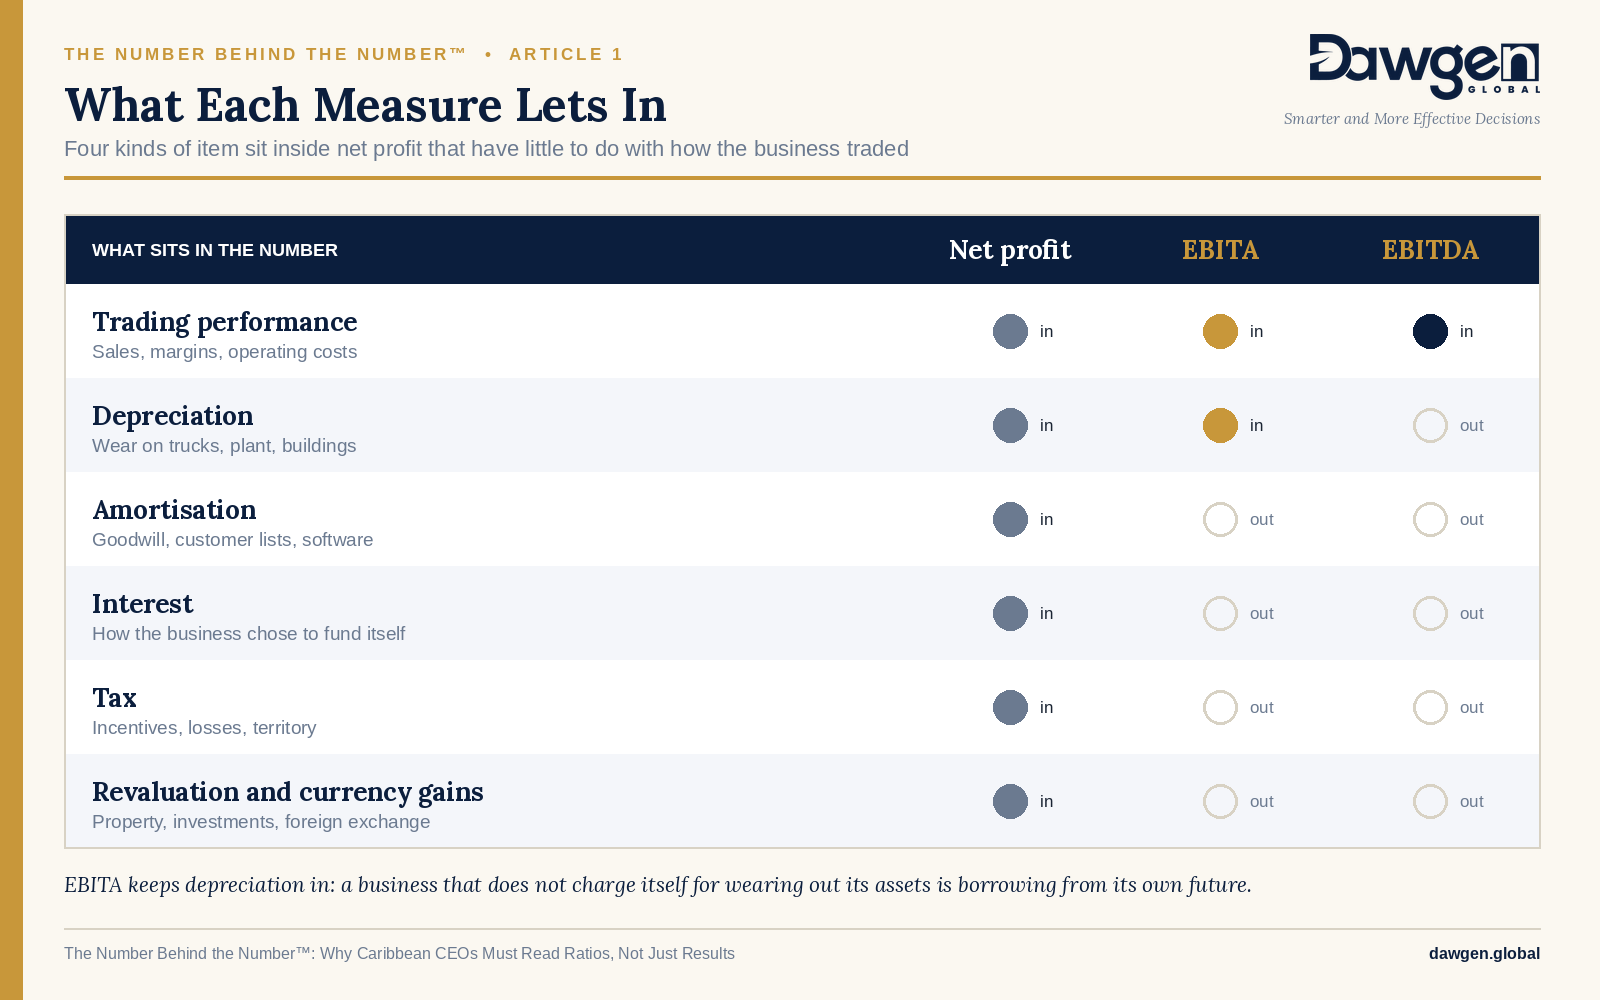
EBITDA removes the first three and, when prepared properly, is presented without the fourth. EBITA removes financing, tax and amortisation, but keeps depreciation in, because a business that does not charge itself for wearing out its assets is borrowing from its own future.
That is why EBITA is a discipline. It will not let a business forget that the delivery trucks need replacing.
Why CEOs keep managing to profit
If the operating measures are more useful, why do so many chief executives still run their businesses on net profit? Four reasons recur.
- It is the number on the page. Statutory accounts lead with profit. Management accounts, where they exist, usually follow the same layout.
- It is the number the owners were taught to watch. Many Caribbean businesses were built by founders who measured success by profit and by the bank balance. Both are sensible instincts that stop short of what a lender or a buyer measures.
- Nobody has asked for anything else. Until a bank tightens a covenant, a bond is issued or a buyer arrives, the business can go years without anyone asking for EBITDA, let alone EBITA.
- The finance function is busy producing the statutory numbers. In a small team, month-end, tax filings and the audit consume all available time. Ratio analysis is the first thing to drop.
None of these is a failing of intelligence. Each is a failing of translation. The information to calculate every ratio in this series already sits in the company’s ledger. What is missing is the discipline of calculating it, the habit of reading it, and a shared understanding between the CEO and the finance team of what each number means.
SECTION 4
The Caribbean variant

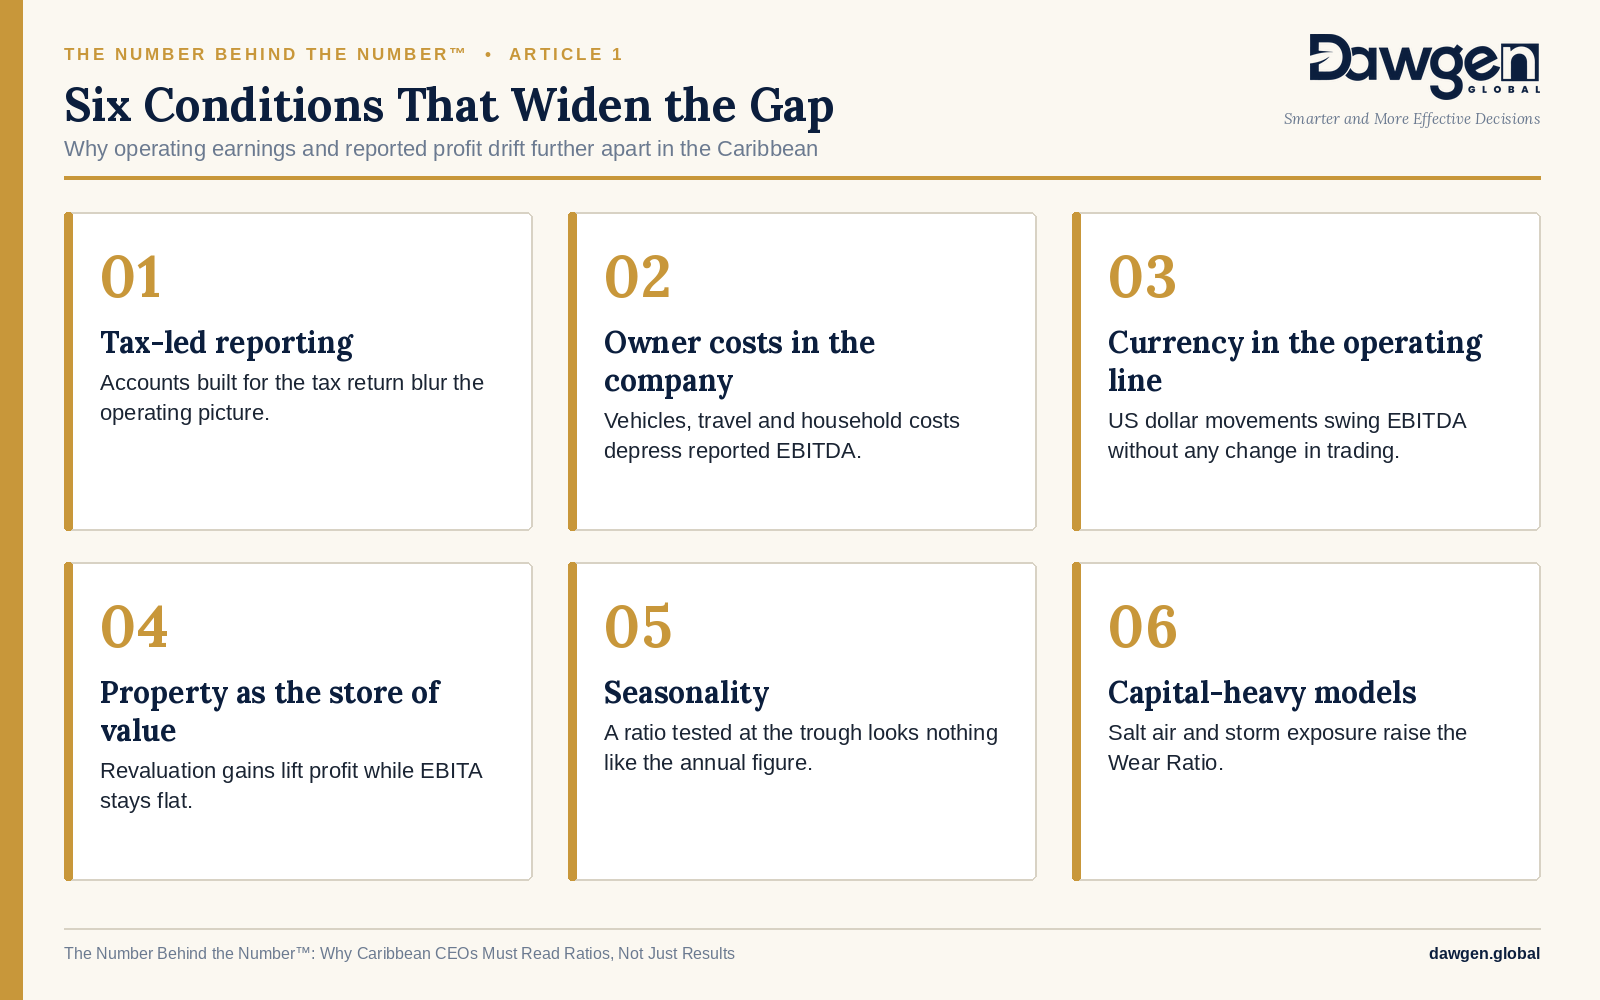
The gap between profit and operating earnings exists everywhere. Six conditions make it wider in this region.
Tax-led reporting. Many private companies prepare their accounts primarily for the tax return. Presentation choices that make sense for a tax computation often blur the operating picture, and the management accounts, if any, are built on the same base.
Owner and family costs inside the company. Vehicles, travel, school fees and household staff frequently run through the business. They depress reported EBITDA, so the true operating margin is higher than it appears. A lender or buyer will adjust for them, but only if they are identified and documented.
Currency in the operating line. Businesses that import in US dollars and sell in local currency carry exchange movements through their results every month. When those movements are mixed into operating costs, EBITDA swings for reasons that have nothing to do with trading.
Property as the store of value. Regional businesses tend to own their land and buildings, and to revalue them. Revaluation gains can lift reported profit substantially in a year when operating earnings are flat. They produce no cash, and in the case of the opening story, they masked a deteriorating credit position.
Seasonality. Tourism, agriculture and retail follow strong annual cycles. A leverage ratio measured at the peak of the season looks very different from one measured at its trough. Lenders increasingly test ratios on a rolling twelve-month basis, and CEOs who look only at annual accounts are surprised by mid-year covenant tests.
Capital-heavy business models. Hotels, haulage, distribution, manufacturing, agro-processing and energy all run large fixed-asset bases in a salt-air, storm-exposed environment where equipment wears out quickly. Their Wear Ratios are high, which is exactly where the difference between EBITDA and EBITA matters most.
There is also a structural change under way. Regional lenders are writing ratio covenants into facilities more often, and the growth of corporate bonds and junior market listings means more businesses are being measured against EBITDA-based tests by investors who have never met the owner. The measures in this series are no longer a concern only for large, listed companies. They are becoming the terms on which mid-sized private businesses borrow.
SECTION 5
What it costs

Managing to the wrong number is expensive, and the cost usually arrives at the worst moment: when the business needs money or wants to sell. The figures below are indicative ranges drawn from general practice. They are not survey results, and any individual business will differ.
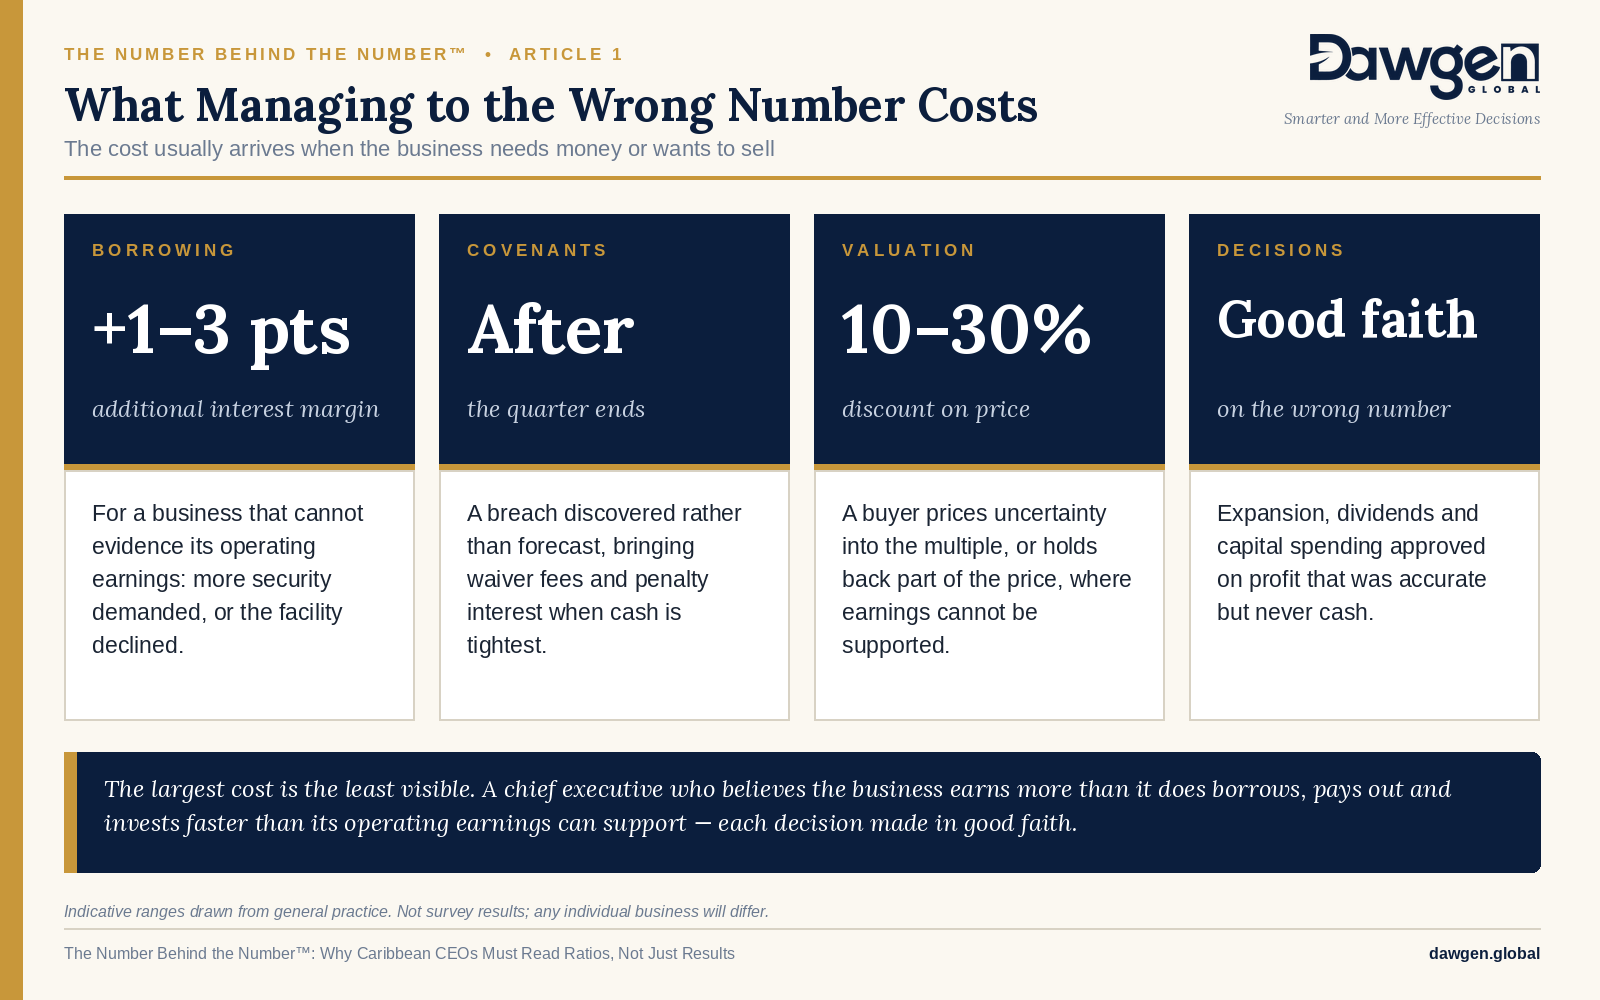
The largest cost is often the least visible. A chief executive who believes the business earns more than it does will take on more debt, pay out more, and invest faster than the operating earnings can support. None of those decisions looks wrong at the time. Each is made in good faith, on a number that was accurate but not relevant.
The reverse also happens. Owner costs and tax-led presentation can make a sound business look weaker than it is. That business pays more for credit than it should and is offered less than it is worth, simply because nobody has done the work of showing its true operating earnings.
SECTION 6
Reading it properly: the Five-Number Test

The quickest way to find out whether a business is managed to the right numbers is to ask its chief executive five questions, from memory, and then ask the finance team the same five.
- What is our EBITA margin, and what is our EBITDA margin beside it?
- What share of our EBITDA turned into operating cash last year?
- What is our net debt as a multiple of EBITDA?
- What return do we earn on the capital employed in the business?
- How many days of working capital do we finance?
Most chief executives cannot answer the first question. Nearly all find that their answers and the finance team’s answers differ. That difference, not any single ratio, is the finding. It means the business is being steered on one set of numbers and judged on another.
The composite company, read properly
Return to the company in the opening story. It is a composite distributor and light manufacturer, with figures rounded and expressed in US dollars for comparability across the region.
| US$ millions | Prior year | This year |
| Revenue | 22.50 | 24.00 |
| EBITDA | 2.25 | 2.40 |
| Depreciation | (0.95) | (1.10) |
| EBITA | 1.30 | 1.30 |
| Amortisation | (0.10) | (0.10) |
| Interest | (0.40) | (0.60) |
| Profit from trading, before tax | 0.80 | 0.60 |
| Revaluation and currency gains | 0.49 | 1.20 |
| Reported profit before tax | 1.29 | 1.80 |
Composite illustration. Not a Dawgen Global client and not any listed company.
The board saw the bottom line: up forty per cent. Now read the same year through the five numbers.
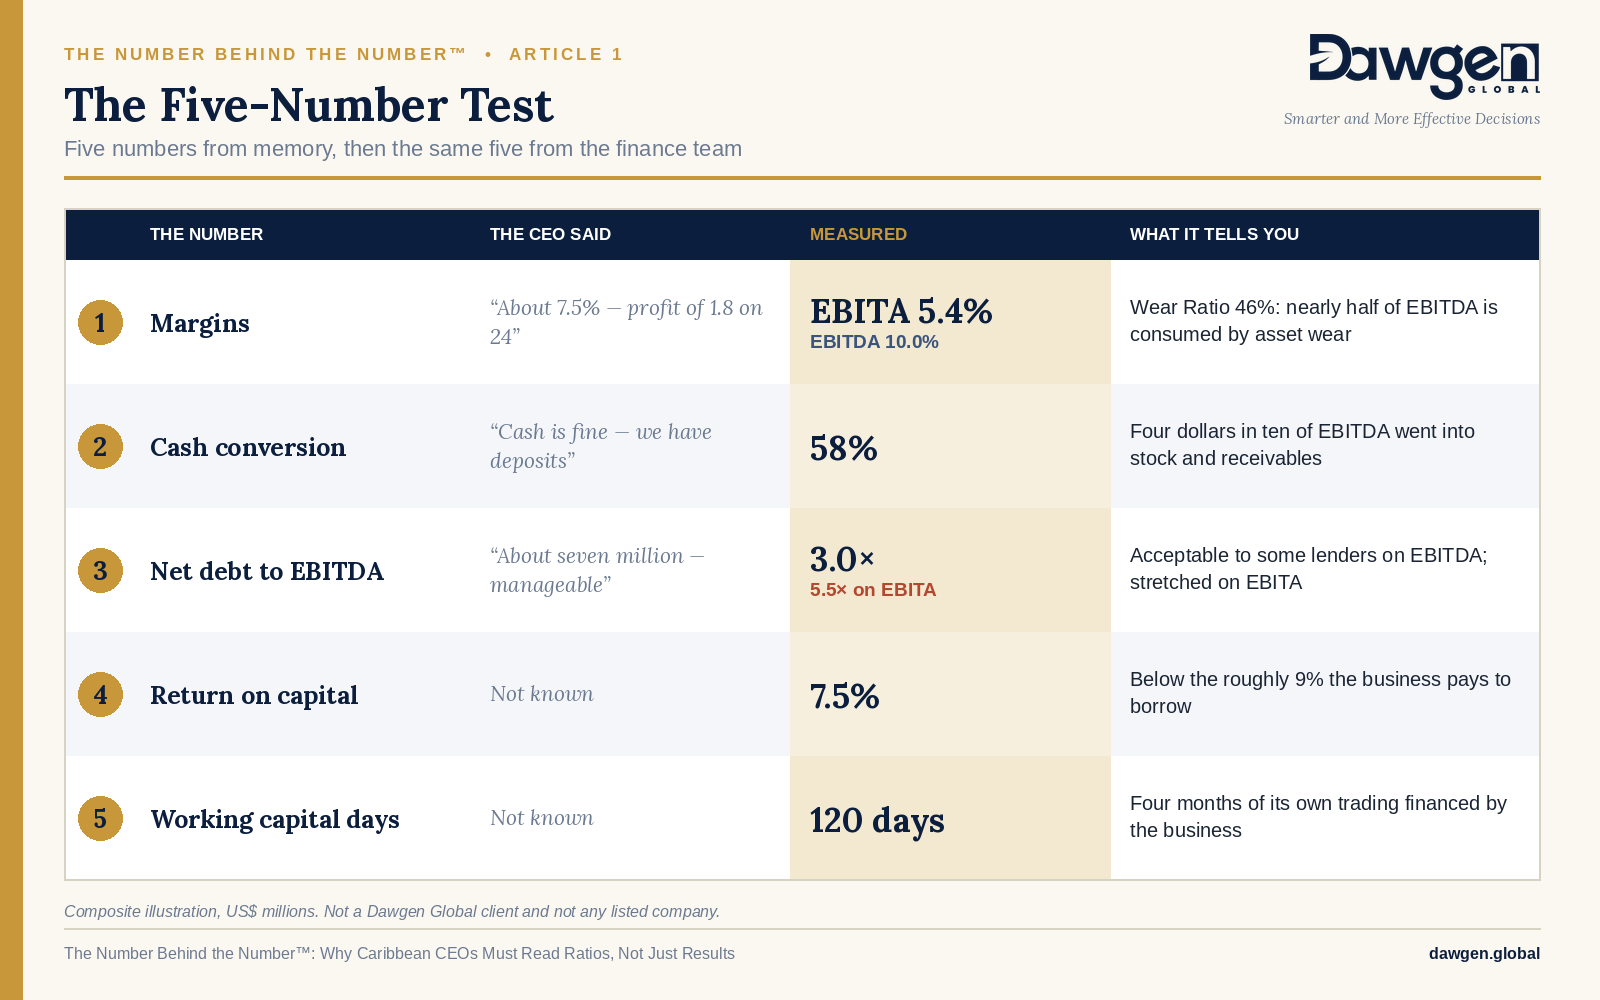
None of these numbers required new data. Every one came from the same ledger that produced the forty per cent headline. The difference is which question was asked of it.
When the two measures tell different stories
The composite shows why the series teaches EBITDA and EBITA together rather than choosing one.
On EBITDA, the business grew: up seven per cent, with leverage at three times, a level many lenders will discuss. On EBITA, the business stood still: the whole of the EBITDA growth was absorbed by the depreciation on the new warehouse, and leverage against post-depreciation earnings is closer to five and a half times.
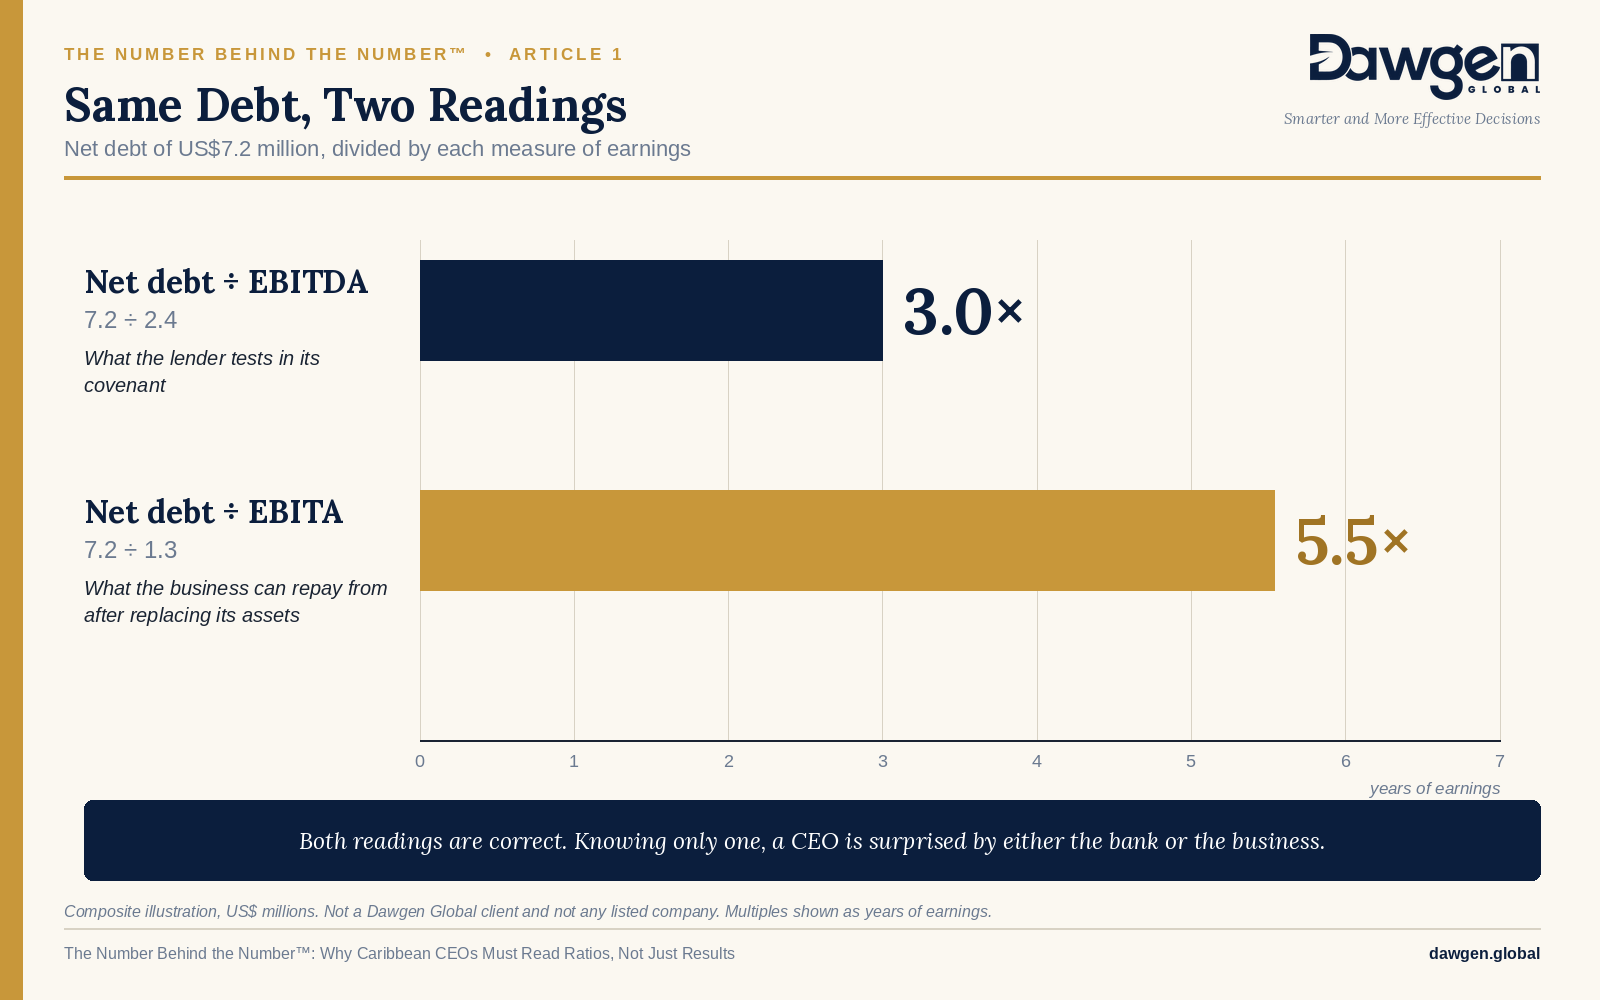
Both readings are correct. The EBITDA reading tells the chief executive what the lender sees in its covenant test. The EBITA reading tells the chief executive whether the warehouse is paying for itself. A CEO who knows only one of them will either be surprised by the bank or surprised by the business.
The Wear Ratio connects them. At forty-six per cent, it warns that this is a business in which EBITDA flatters, and in which the replacement of assets must be planned and funded, not left to the year the trucks fail.
Where the two measures agree, and where adjustments begin
For a business with a low Wear Ratio, a law practice or a software firm, EBITDA and EBITA sit close together and the choice between them matters less. For those businesses the more important question is the quality of the earnings figure itself: whether owner costs, one-off items and related-party charges have been identified and treated consistently. That question is the subject of Article 3 in this series, Adjusted Until It Flatters, and Article 2 examines the EBITDA and EBITA difference in full, including how the lease accounting standard, International Financial Reporting Standard 16 (IFRS 16), has changed it.
SECTION 7
Where to start
None of what follows requires a new system, a new hire or an external adviser. Each step can be taken this month.
- Run the Five-Number Test. Write down your own answers to the five questions before asking anyone. Then ask your finance lead for theirs. Compare them in a single meeting.
- Add two lines to the management accounts. Show EBITDA and EBITA, with their margins, every month. Place them above net profit, not below it.
- Separate trading from everything else. Report revaluation gains, currency movements and asset disposals in their own section, so the board sees profit from trading before it sees the headline.
- Calculate your Wear Ratio. If it is above a third, build an asset replacement schedule and ask how it will be funded before the assets fail.
- Read your facility agreement. Find every ratio your lender tests, how it is defined and when it is measured. Many businesses discover their covenants for the first time when they breach one.

The aim is not to replace net profit. It remains the measure the owners are ultimately rewarded on. The aim is to put the numbers the business is judged on in front of the person who runs it, every month, in the same language the bank and the buyer use.

What comes next in the series
Article 2, EBITDA or EBITA? The Difference Is the Cost of Standing Still, examines the two measures in depth: which industries depend most on the distinction, how IFRS 16 has lifted EBITDA for lease-heavy businesses, and why lenders, buyers and management may each reach for a different number. Later articles take each lens in turn, from borrowing capacity and covenants to cash conversion, return on capital, tax and valuation, and the series closes with the CEO’s One-Page Ratio Dashboard.
| HOW DAWGEN GLOBAL HELPS
Dawgen Global works with chief executives and boards across more than fifteen Caribbean territories to put these numbers to work. ■ The Dawgen E·B·I·T·A Lens™ Ratio Health Check — a fixed-fee review that scores the business on all five lenses and runs the Five-Number Test against the finance team. ■ The monthly Ratio Dashboard — delivered through our Virtual CFO and Accounting BPO division. ■ Specialist reviews — quality of earnings, covenant monitoring, valuation, tax and transaction readiness through our Business Advisory, M&A and Tax Advisory practices. To see how your business reads through the E·B·I·T·A Lens™, or to request a Ratio Health Check, contact Dawgen Global. [email protected] | dawgen.global | (876) 926-5210 |
The examples in this series are composites drawn from patterns observed across the region. They do not describe any client or any listed company. Figures described as indicative are illustrative ranges, not survey results.
Download a copy of the article here: Profit Is an Opinion. EBITA Is a Discipline: Why Caribbean CEOs Must Read Ratios, Not Just Results
About Dawgen Global
Dawgen Global is an independent, integrated multidisciplinary professional services firm headquartered at 47 Trinidad Terrace, New Kingston, Jamaica, serving more than 15 territories across the Caribbean. Founded and led by Dr. Dawkins Brown, Executive Chairman, the firm is independent and not affiliated with any international network. It delivers a full suite of professional services under one roof: audit and assurance; tax advisory; IT and digital transformation; risk management; cybersecurity; actuarial and insurance regulatory advisory; HR advisory; mergers and acquisitions; corporate recovery; business advisory and strategy; accounting BPO and virtual CFO services; and legal process outsourcing.
The proposition is simple: big-firm capability without the big-firm price. Dawgen Global’s integrated approach is built for the specific complexities and opportunities of the Caribbean market, helping organizations make sharper, better-informed decisions that drive measurable progress.
To explore a partnership, reach out:
- Website: dawgen.global
- Email: [email protected]
- WhatsApp (Global): +1 555-795-9071
- Caribbean offices: +1 876-665-5926 | +1 876-929-3670 | +1 876-926-5210