There is a Caribbean hospitality group I will call Cascade Resorts — a composite drawn from advisory engagements with regional hotel operators, with all identifying details changed but every operational and balance sheet fact preserved. Cascade operates four properties across two Caribbean territories, employs approximately 920 staff, generates annual revenue of US$78 million, and earns adjusted EBITDA of approximately US$14 million. By the standard Caribbean hospitality benchmarks, Cascade is a credible mid-tier operator — well-managed, properly capitalised in nominal terms, and conservatively run by a second-generation family management team that took control from the founders in 2018.
In November 2025, Cascade was given a single piece of information by its primary banker that turned a quietly successful operating year into the worst boardroom conversation the family had ever had. The information was not that the bank was withdrawing support. The information was not that a covenant had been breached. The information was a calendar.
On that calendar, three of Cascade’s four largest credit facilities were scheduled to mature within a fourteen-month window — a US$22 million property-secured term loan in March 2026, a US$8 million working capital line in July 2026, and a US$15 million renovation facility from a regional development bank in January 2027. The total scheduled refinancing requirement across that window was US$45 million, against a total committed debt stack of US$58 million. Seventy-eight percent of the entire capital structure was scheduled to come due, simultaneously, in the same operational year.
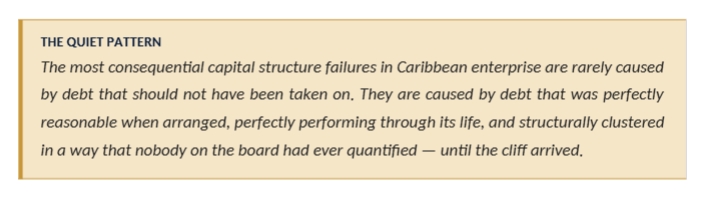
None of this had been a secret. Every facility had been documented years earlier. Every maturity date had been visible in every quarterly board pack since the facilities were first signed. The information was not hidden. The information was just never aggregated. Each facility had been reviewed in isolation by the relevant lender, in isolation by the Cascade treasury function, in isolation by the audit committee. Nobody had ever placed all three maturities on a single timeline and asked the only question that mattered: can the enterprise refinance forty-five million dollars of debt in fourteen months under any plausibly adverse condition?
By the time the question was asked seriously, the answer was no. The hospitality sector was navigating soft demand, regional banking liquidity had tightened, and the development bank that held the largest single facility was undergoing a strategic review that had stalled all new and refinancing approvals for an indefinite period. None of these conditions were catastrophic individually. Cumulatively, against a balance sheet structurally exposed to a fourteen-month refinancing cliff, they were terminal. Cascade did not fail. But the company spent the next nine months restructuring under conditions far less favourable than a properly laddered balance sheet would have required, and the cost — in pricing, in covenant burden, in dilution of the family’s flexibility — became the central capital structure event of the next five years.
What Maturity Mismatch Actually Is
The phrase “maturity mismatch” is used loosely in Caribbean treasury practice, often as a synonym for any timing-related capital structure problem. For the discipline of the DRCS-F™, it has a precise meaning, and the precision matters because the diagnostic and the remediation strategy are different for each variant of the problem.
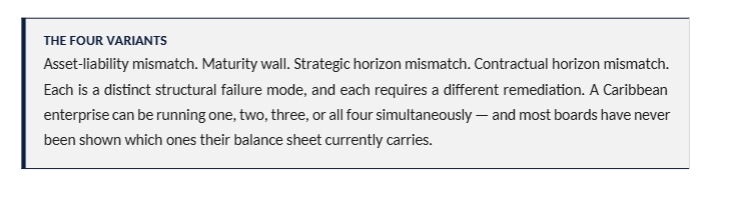
Maturity mismatch, properly defined, is the structural condition in which the duration profile of an enterprise’s debt is misaligned with the duration profile of the assets, cash flows, or strategic horizon that the debt is funding. There are four distinct variants, each with its own signature, and each with its own response.
The first variant is the classic asset-liability mismatch — short-term debt funding long-term assets. A two-year working capital line that has been quietly rolled over annually for fifteen years to fund the purchase of property, plant and equipment is the textbook case. The economics work as long as the rollover continues; the risk crystallises only when the rollover does not.
The second variant is the maturity wall — multiple facilities clustered into a narrow refinancing window that exceeds the enterprise’s plausible refinancing capacity in that window under adverse conditions. Cascade Resorts, with seventy-eight percent of its committed debt maturing in fourteen months, was running a maturity wall regardless of whether any individual facility was technically mismatched.
The third variant is the strategic horizon mismatch — debt that will mature inside the operating window of the strategic project the debt was raised to fund. A five-year facility funding a renovation programme that will only fully stabilise its earnings contribution in year seven is structurally incompatible with the project, even if the maturity schedule looks elegantly laddered on its own merits.
The fourth variant — and the one most often missed in Caribbean enterprise practice — is the contractual horizon mismatch. Debt that matures inside the contractual horizon of the customer or supplier relationships that secure the underlying revenue stream. A hotel facility that matures in three years against a portfolio of group sales contracts most of which extend into year five is technically not a financing risk, but it is a contractual risk made financial — because the refinancing event creates an opportunity for revenue counterparties to renegotiate terms in ways that destabilise the underlying earnings.
 |
Why Caribbean Balance Sheets Cluster Maturities
Maturity mismatch is not a Caribbean problem in any narrow regional sense. The pattern appears across emerging-market enterprise globally. But there are three forces specific to the Caribbean operating environment that cause maturity clustering to be more common, more severe, and more often invisible to the board than the equivalent pattern in deeper capital markets.
The first is the limited duration of the available debt instrument set. A Caribbean mid-market enterprise typically has access to commercial bank facilities of three to seven years, regional development bank facilities of seven to ten years for qualifying projects, and — for the largest and most established issuers — domestic bond issuances that occasionally extend to ten or fifteen years. Outside of those windows, longer-duration debt is structurally unavailable for most operators. This means that an enterprise raising debt to fund a twenty-year asset has no structurally matched financing option; the asset is funded by a stack of shorter-duration debt that must be refinanced multiple times across the asset’s life, and each refinancing is a potential point of cliff formation.
The second is the relationship-cycle pattern of Caribbean lending. Enterprises tend to raise multiple facilities from the same primary lender during periods of strong relationship — typically the middle decade of a senior banker’s tenure — and these facilities tend to be sized to similar duration windows because they are arranged under the same credit framework, with the same underwriting committee, against the same security pool. The result is that maturities cluster not because the enterprise wanted them to cluster, but because the lending relationship that produced them was itself clustered in time. When that primary lender’s framework shifts, all the related maturities surface together.
The third is the absence, in most Caribbean enterprises, of a formal treasury duration discipline. Larger global corporates run a duration gap measure — the weighted average maturity of liabilities against the weighted average duration of assets — as a standard treasury KPI, reviewed by a Treasury Committee, escalated to the board when the gap moves outside agreed parameters. Most Caribbean mid-market enterprises do not run this measure at all. Maturities are tracked individually as facility-level events; they are not aggregated into a single duration profile for the enterprise. The blind spot is structural, not negligent.
The Maturity Wall Heat-Map™
To make the four variants of maturity mismatch operationally visible — and to give boards a single artifact that aggregates what currently lives across multiple facility files — the DRCS-F™ introduces the Maturity Wall Heat-Map™. The Heat-Map is the third proprietary tool in the framework, and it is designed to be produced quarterly, archived in the audit committee reporting pack, and updated whenever a material refinancing event changes the duration profile.
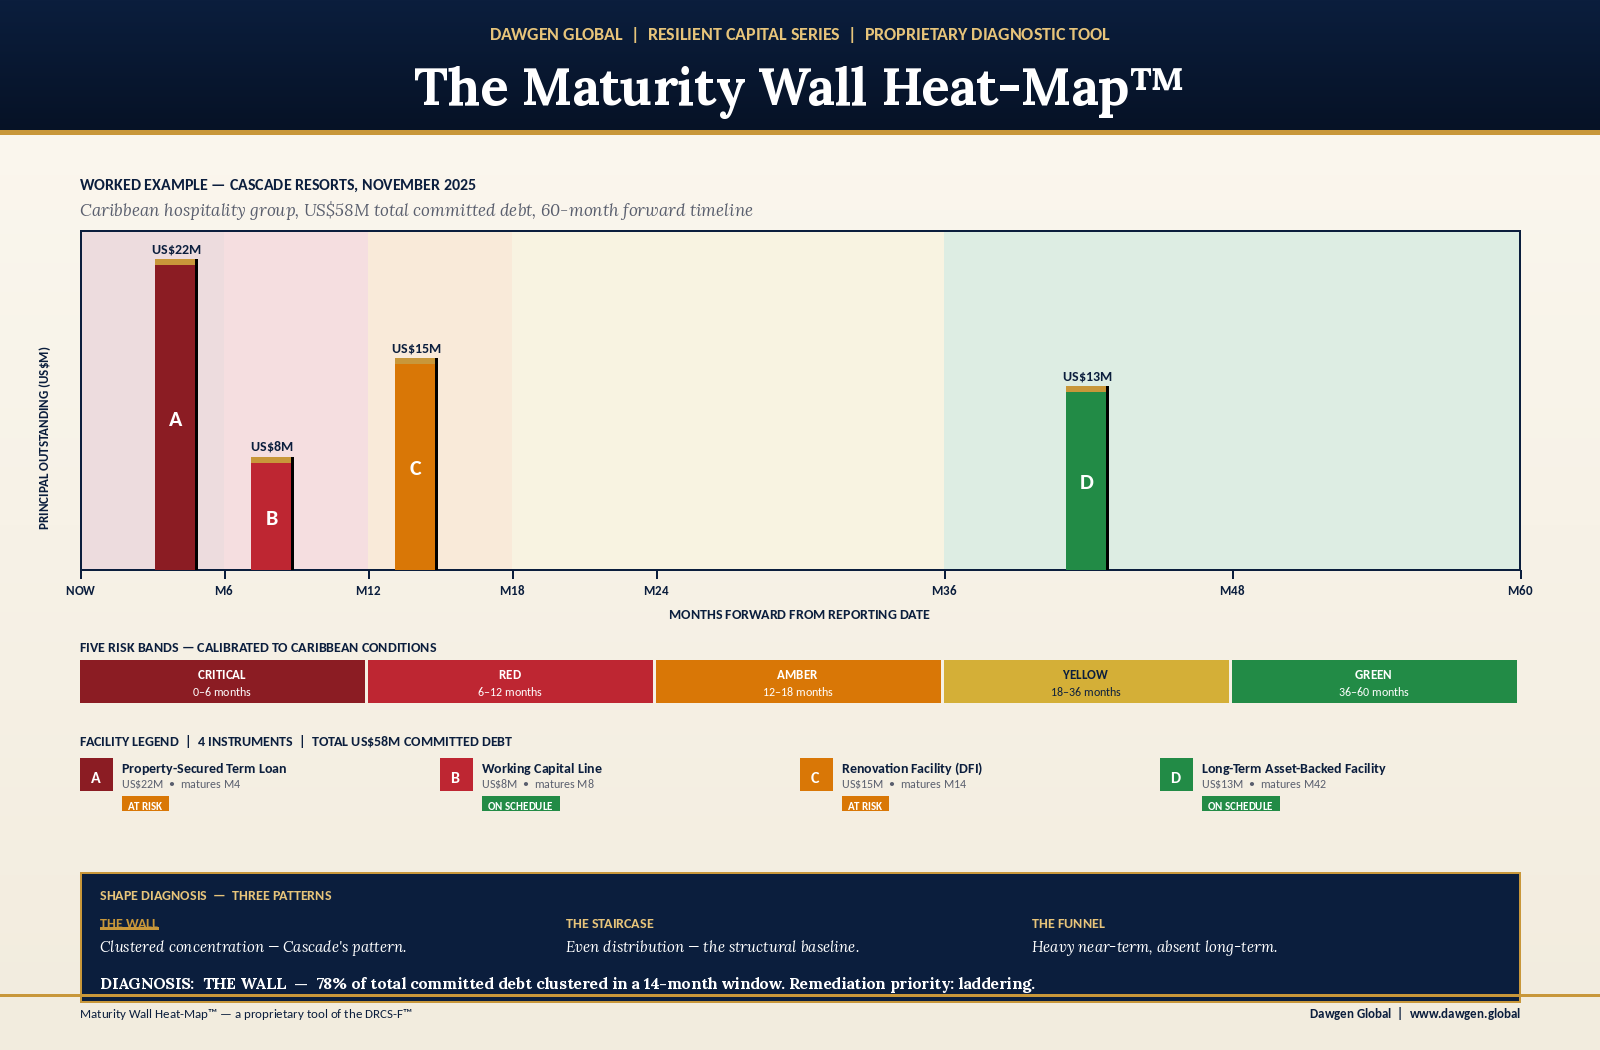
The Heat-Map plots every committed and uncommitted facility — and every other material contractual obligation that creates a refinancing or renewal event — across a single timeline that extends sixty months forward from the reporting date. Each facility is rendered as a coloured block whose horizontal position represents its maturity and whose vertical thickness represents its principal outstanding. Colour density represents refinancing risk, scored against the criteria described below. The result is a one-page visual that a board can absorb in seconds, but that surfaces structural exposures that no facility-level review has ever caught.
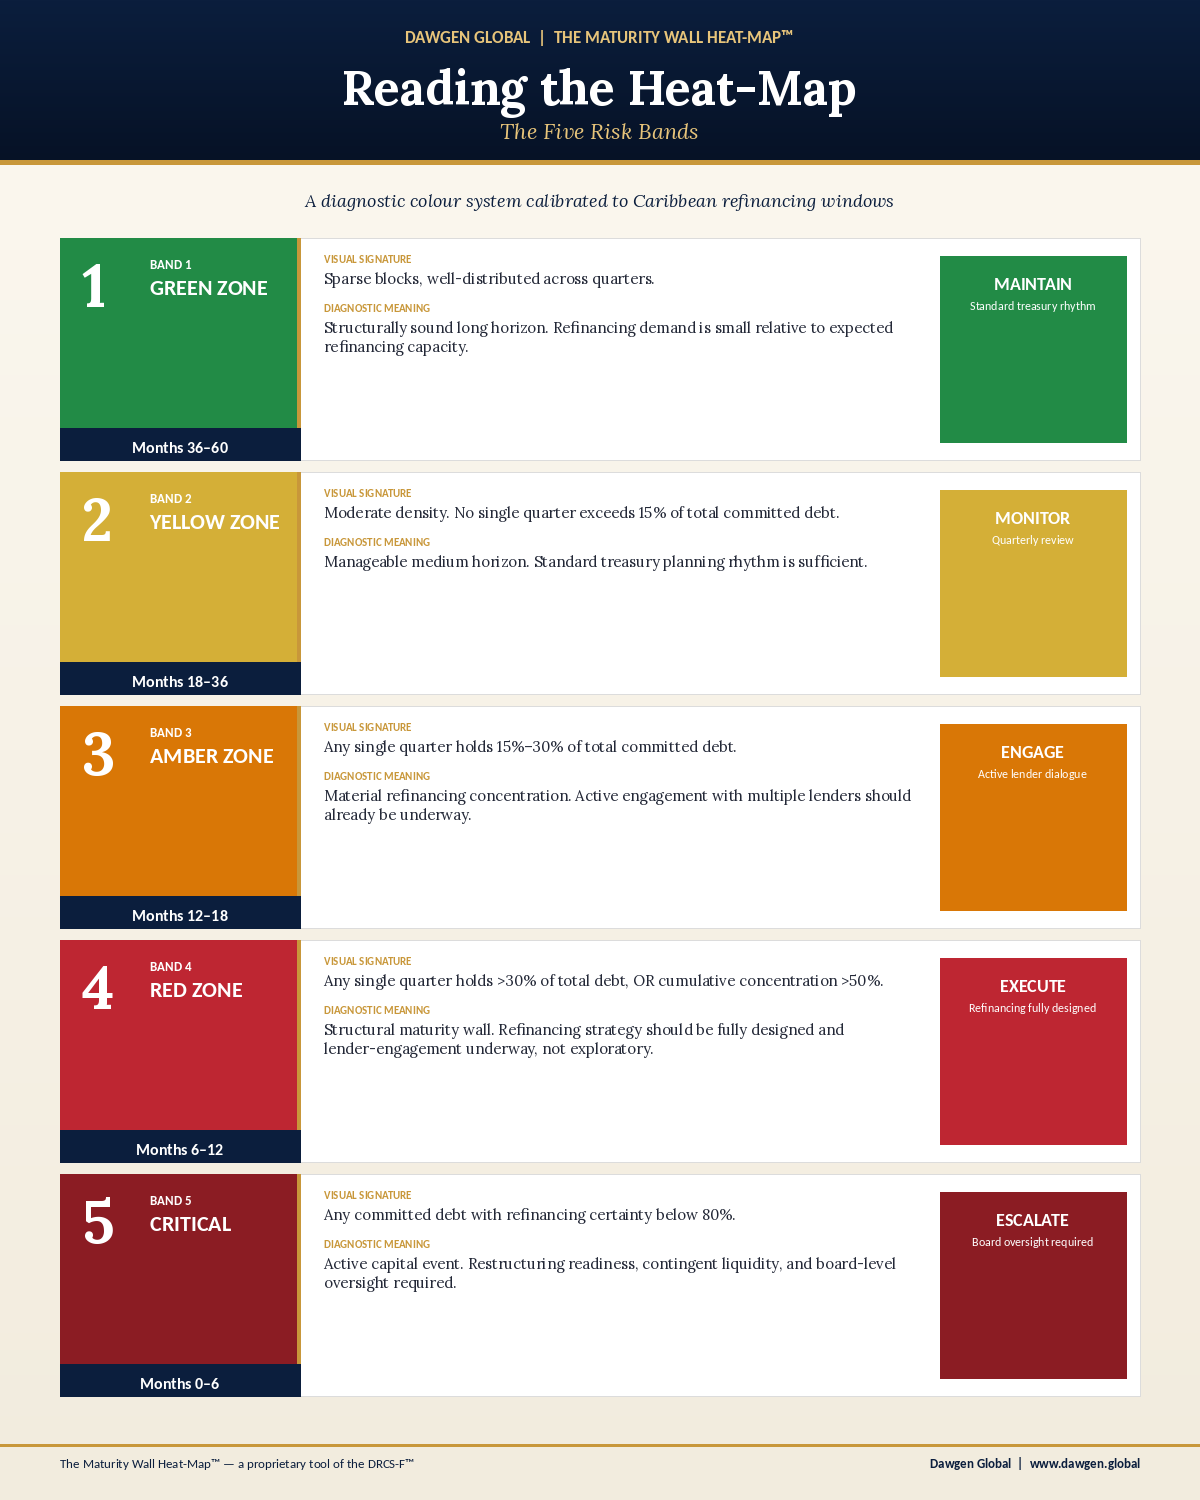
Reading the Heat-Map — The Five Risk Bands
| Band | Visual Signature | Diagnostic Meaning |
| BAND 1 — GREEN ZONE | Months 36–60. Sparse blocks, well-distributed across quarters. | Structurally sound long horizon. Refinancing demand is small relative to expected refinancing capacity. |
| BAND 2 — YELLOW ZONE | Months 18–36. Moderate density, no single quarter exceeding 15% of total committed debt. | Manageable medium horizon. Standard treasury planning rhythm is sufficient. |
| BAND 3 — AMBER ZONE | Months 12–18. Any single quarter holds 15%–30% of total committed debt. | Material refinancing concentration. Active engagement with multiple lenders should already be underway. |
| BAND 4 — RED ZONE | Months 6–12. Any single quarter holds >30% of total committed debt, OR cumulative concentration in this zone exceeds 50% of total. | Structural maturity wall. Refinancing strategy should be fully designed and lender-engagement underway, not exploratory. |
| BAND 5 — CRITICAL | Months 0–6. Any committed debt with refinancing certainty below 80%. | Active capital event. Restructuring readiness, contingent liquidity, and board-level oversight required. |
The Heat-Map is designed to be honest, not flattering. The colour bands are calibrated to Caribbean enterprise conditions — specifically to the realistic refinancing windows produced by regional banking cycles, the behaviour of regional development banks during strategic reviews, and the practical lead times that institutional debt placements require in the Caribbean market. A balance sheet that lights up amber or red in the medium horizon is not necessarily failing. It is signalling that refinancing work needs to begin, and the Heat-Map is the artifact that surfaces that signal in time for it to be acted upon.
Three Heat-Map Patterns Worth Naming
Across advisory engagements, three Heat-Map shapes appear repeatedly. Each is diagnostic of a different underlying treasury practice, and each calls for a different first-move response.
THE WALL — a dense vertical block of maturities concentrated in a single twelve-to-eighteen-month window, with relatively sparse blocks before and after. Cascade Resorts ran a textbook Wall pattern. The remediation priority is laddering — deliberate redistribution of the wall across at least three forward years before the cliff arrives.
THE STAIRCASE — relatively even distribution across forward quarters, with occasional small clusters but no single dominant cliff. The Staircase is what the discipline aspires to. The remediation priority is maintenance, not restructuring; the Heat-Map should remain a quarterly governance discipline to detect drift toward Wall formation as new facilities are added.
THE FUNNEL — heavy concentration in the near-term horizon (months 0–18) and structural absence in the longer horizon (months 36–60). The Funnel signals that the enterprise has been raising debt at progressively shorter durations — typically as a consequence of relationship erosion, sectoral risk re-rating, or covenant pressure on longer-duration facilities. The Funnel is more diagnostically serious than the Wall, because it indicates that refinancing capacity is itself deteriorating. The remediation priority is structural diversification of the lender stack alongside laddering — and this is where the Concentration Diagnostic Matrix™ from Article 2 and the Maturity Wall Heat-Map™ from Article 3 must be used together.
The Refinancing Lead-Time Calculator™
Identifying a maturity wall is necessary but not sufficient. The harder question — and the one that determines whether the wall becomes a crisis or a manageable refinancing event — is the question of timing. How early does refinancing work need to begin, in absolute calendar terms, before any given maturity arrives? Caribbean enterprises consistently underestimate this timing, and the underestimation is the proximate cause of most of the avoidable refinancing distress observed in the region.
The DRCS-F™ introduces the Refinancing Lead-Time Calculator™ as the operational counterpart to the Heat-Map. Where the Heat-Map shows the shape of the problem, the Lead-Time Calculator shows the shape of the response — specifically, when each refinancing conversation must begin in order to land cleanly. The Calculator is built around four input variables, each of which lengthens the required lead time.
The Four Input Variables
| Variable | Description | Lead-Time Effect |
| FACILITY SIZE | Principal outstanding as a share of total committed debt. | Larger facilities require longer lead times. A facility above 25% of total debt requires significantly more runway than a smaller one. |
| INSTRUMENT TYPE | Bilateral commercial loan, syndicated facility, regional development bank facility, public bond, private placement. | Bilateral loans refinance fastest. Public bonds and DFI facilities require the longest lead time, often 12+ months. |
| LENDER OVERLAP | Whether the refinancing will be with the existing lender, a new lender, or a syndicate. | Same-lender extensions are fastest. New-lender refinancings require relationship-building lead time. Syndicate placements require the longest. |
| MARKET CONDITION | Current state of regional banking liquidity and sectoral risk appetite. | Tight market conditions can double the typical lead time. The Calculator should be re-run quarterly to reflect current conditions. |
Calibrated Lead-Time Bands for Caribbean Conditions
The Calculator translates the four input variables into a recommended lead time — the number of months before maturity at which active refinancing work should formally begin. The bands below are calibrated to current Caribbean conditions and should be adjusted upward in tighter market environments.
| Refinancing Type | Recommended Lead Time | What Must Be Underway By That Date |
| Bilateral loan, same lender, normal market | 6 months | Renewal request submitted, indicative terms received, internal approvals begun. |
| Bilateral loan, new lender, normal market | 9 months | New lender relationship established, term sheet negotiated, due diligence kicked off. |
| Syndicated facility, normal market | 12 months | Mandate awarded to lead arranger, information memorandum drafted, syndicate sounding underway. |
| Regional development bank facility | 12–18 months | Application submitted, technical due diligence active, board-level approvals scheduled. |
| Public bond issuance | 15–18 months | Lead arranger mandated, prospectus drafting underway, regulatory engagement scheduled. |
| Any of the above, tight market | Add 6 months | Earlier mobilisation across all of the above. Contingent backstops should also be active. |
The single most consequential implication of the Lead-Time Calculator is that the start date for refinancing work is rarely six months before maturity, as Caribbean enterprises commonly assume. For any facility above twenty-five percent of total committed debt, or any facility involving a new lender, a syndicate, a development bank, or a public placement — which together cover most of the institutional debt actually held by Caribbean enterprises — the start date is twelve to eighteen months before maturity. Under tight market conditions, twenty-four months.
| THE OPERATIONAL TRUTH
By the time a facility is six months from maturity, the major decisions about how it will be refinanced have already been made — implicitly or explicitly. Boards that wait until that window to engage are not negotiating refinancing strategy; they are accepting whatever refinancing strategy circumstance has produced for them. |
Using the Two Tools Together
The Heat-Map and the Lead-Time Calculator are most powerful in combination. Used separately, each provides partial visibility. Used together, they answer the central diagnostic question of Pillar 2: not just where the maturity walls are, but whether the enterprise is currently on a viable timeline to navigate them.
The combined diagnostic proceeds in three steps. First, the Heat-Map is produced and any amber or red zones are identified. Second, for each facility falling within an amber or red zone, the Lead-Time Calculator is run to determine the date by which refinancing work must have formally begun. Third, the two outputs are reconciled against the actual current state of refinancing activity for each affected facility. The reconciliation produces a simple three-state output for each facility: ON SCHEDULE (refinancing work has begun by the calculated lead-time date), AT RISK (the calculated lead-time date has passed but refinancing work has not formally begun), or CRITICAL (the lead-time date passed more than three months ago and refinancing work remains exploratory).
The Reconciliation Output — A Worked Example
Returning to Cascade Resorts, the combined diagnostic produced the following reconciliation in November 2025, against a then-current reporting date of 30 September 2025:
| Facility | Maturity | Months to Maturity | Lead-Time Required | Status |
| US$22M property-secured term loan | March 2026 | 6 months | 9 months | AT RISK |
| US$8M working capital line | July 2026 | 10 months | 6 months | ON SCHEDULE |
| US$15M renovation facility (DFI) | January 2027 | 16 months | 18 months | AT RISK |
The reconciliation surfaced what no individual facility review had surfaced. Both the largest facility and the development bank facility were already past their required lead-time start dates as of the September 2025 reporting date. The working capital line was on schedule, but its on-schedule status was meaningless in the broader context — a successful working capital refinancing without successful refinancing of the larger two would not save the balance sheet. The reconciliation also surfaced what the family management team had not been willing to articulate: the strategic question was not how to refinance each facility individually, but whether the enterprise had time to refinance all three at acceptable terms within the available window. The honest answer was that it did not, and that an active restructuring engagement was the appropriate next step rather than a continuation of the existing refinancing posture.
Board Oversight and the Discipline of Walking the Wall
There is a specific quarterly governance ritual that the DRCS-F™ recommends for Pillar 2, and that we have observed makes the most difference in advisory practice. We call it walking the wall. The ritual is simple in concept and demanding in execution. At every audit committee or risk committee meeting, the Heat-Map is produced and walked through publicly — not summarised, not referenced, but walked. Each facility in the amber and red zones is named. Its current refinancing status is stated. The Lead-Time Calculator output is referenced. The status (on schedule, at risk, critical) is recorded in the minutes. Where any facility is at risk or critical, the meeting does not proceed past that item until a clear, dated, named owner of the next refinancing action has been identified.
This ritual sounds bureaucratic. It is not. It is the only governance discipline we have observed that reliably prevents the Cascade pattern, because it does not allow refinancing slippage to remain ambient — to live across multiple files, multiple conversations, multiple half-decisions. Walking the wall forces the discipline that the standard Caribbean board agenda actively dilutes: the discipline of placing the maturities on the table together, in order, with names attached to actions, in front of the audit committee.
There are three specific questions that any Caribbean board director should be willing to ask, and to keep asking, in the context of Pillar 2 oversight. The first is whether the most recent Heat-Map shows any amber or red zones, and if so, what the named refinancing strategy is for each facility in those zones. The second is whether the Lead-Time Calculator has been run against current market conditions, not against the conditions assumed when each facility was originally signed. The third is whether the enterprise has a documented, board-endorsed contingency plan for the scenario in which one of the facilities in an amber or red zone cannot be refinanced on schedule — what bridge facility, what asset disposition, what equity option, what restructuring posture would be activated. None of these three questions is technically complex. All three should produce uncomfortable conversation in the typical Caribbean boardroom in 2026, and the discomfort is the early warning that the diagnostic work is needed.
The Laddering Discipline — From Wall to Staircase
Once the Heat-Map and Lead-Time Calculator have been deployed and the enterprise has an honest view of its current duration profile, the harder work begins: the deliberate redistribution of maturities across forward years to convert a Wall pattern into a Staircase pattern. This work cannot be done in a single transaction. It is multi-year work that requires sustained discipline, deliberate sequencing, and — critically — the willingness to accept modest cost-of-capital concessions in exchange for structural resilience.
The laddering discipline is governed by four operating principles that have emerged from advisory practice across multiple Caribbean territories. None of these principles is theoretically novel; what is distinctive is that they are systematically applied as a coherent operating posture rather than negotiated facility-by-facility.
PRINCIPLE 1 — NO SINGLE QUARTER ABOVE 15% OF TOTAL COMMITTED DEBT. This is the architectural ceiling. Any quarter in which scheduled maturities exceed fifteen percent of the total committed debt stack is a structural risk concentration regardless of the size of the underlying facilities. The fifteen percent threshold is calibrated to ensure that even the failure of a single quarter’s refinancing window — for any reason — does not destabilise the broader balance sheet.
PRINCIPLE 2 — NO TWELVE-MONTH WINDOW ABOVE 35% OF TOTAL COMMITTED DEBT. The complement to Principle 1. A balance sheet can satisfy the quarterly ceiling while still concentrating excessive maturity load into a single year. The thirty-five percent annual threshold prevents the formation of multi-quarter clusters that would individually pass the quarterly test.
PRINCIPLE 3 — AT LEAST ONE FACILITY EXTENDING BEYOND 60 MONTHS. This is the Heat-Map’s silent requirement. The five-year horizon visible in the standard Heat-Map should never be empty. An enterprise whose entire debt stack matures inside the visible Heat-Map window is structurally exposed to any single market disruption, because there is no long-duration anchor in the structure. At least one facility — typically a regional development bank facility or a long-tenor bond — should extend beyond the visible horizon as a structural anchor.
PRINCIPLE 4 — REFINANCING WORK BEGINS AT THE LEAD-TIME DATE, NOT AT MATURITY MINUS 6. This is the operational principle that translates the Lead-Time Calculator into governance discipline. For every facility, the start of refinancing work is a calendared event, scheduled in advance, owned by a named individual, reviewed by the audit committee. It is not a function of when the next quarterly meeting happens to surface the issue.
Returning to Cascade
The Cascade engagement that opened this article eventually resolved — but as with the Meridian engagement in Article 2, the resolution illustrates both how maturity mismatch can be unwound and how long the unwinding actually takes. The work began with the production of the Heat-Map, which the audit committee chair later described as the single most clarifying document the family had received in more than a decade of professional advisory engagement. The visualisation made the structural exposure undeniable in a way that ten years of facility-level reporting had failed to do.
The remediation programme that followed took eleven months and involved three coordinated interventions. The first was the negotiated extension of the US$22 million property-secured term loan from a March 2026 maturity to a December 2027 maturity, executed with the existing lender against modestly enhanced security and a thirty basis-point pricing increase. The second was the early refinancing of the US$15 million development bank facility into a new fifteen-year facility from a different regional development bank, executed under explicit acknowledgement that the new lender’s longer tenure was the strategic point of the refinancing rather than the headline cost. The third was the introduction of a new US$10 million revolving facility with a third commercial lender, sized deliberately to provide contingent liquidity that would never become a structural risk concentration in any future Heat-Map.
By the end of the eleven-month remediation, Cascade’s Heat-Map had moved from a Wall pattern with seventy-eight percent of debt clustering in fourteen months to a Staircase pattern with no single quarter above twelve percent and no twelve-month window above twenty-eight percent. The new structure carried a blended cost of capital approximately forty basis points above the pre-remediation structure. The board accepted the increased cost as the price of structural resilience, and — perhaps more consequentially — endorsed a new governance discipline in which the Heat-Map and Lead-Time Calculator outputs would appear in every audit committee pack on a standing basis. The discipline of walking the wall, having been adopted under pressure, was carried forward as a permanent operating practice.
From Visibility to Architecture
Pillar 2 — Capital Duration & Maturity Architecture — is the structural complement to Pillar 7’s concentration question that Article 2 examined. Where Pillar 7 asks how the threads of the capital structure are distributed, Pillar 2 asks when those threads come due. A balance sheet that scores well on Pillar 7 but poorly on Pillar 2 is a balance sheet that has solved the question of who is lending without solving the question of when the lending matures, and the latter unsolved question can destroy an enterprise as completely as the former.
The Maturity Wall Heat-Map™ exists to make Pillar 2 visible. The Refinancing Lead-Time Calculator™ exists to translate visibility into action. The four laddering principles exist to govern the deliberate, multi-year work of moving from Wall to Staircase. None of these tools is technically complex. None of them requires elaborate machinery, external data, or specialised systems. What they require is the governance discipline to use them quarterly, to walk the wall in the audit committee, and to refuse to allow refinancing slippage to live ambient in the management process when its proper home is the standing board agenda.
The window in which a Caribbean balance sheet can survive structural maturity mismatch on luck rather than design is narrowing. The window in which a balance sheet can be deliberately laddered — at modest incremental cost, with the support of a maturing regional capital architecture — is widening. The discipline is not theoretically difficult. The discipline is governance-difficult. And it begins, as it always does, at the next board meeting.
| THE STANDARD
A serious Caribbean board, in 2026, knows where its maturity walls are, knows when each refinancing conversation must begin, and knows what the laddering plan is for the next thirty-six months. That is the standard. The Maturity Wall Heat-Map™ and the Refinancing Lead-Time Calculator™ are the operational tools. The work is governance work, and it begins at the next board meeting. |
| YOUR THIRD ADVISORY ACTION
Before the next audit committee meeting, ask the CFO to produce a single-page schedule listing every committed debt facility, its principal outstanding, its maturity month, and its expected refinancing pathway. If any twelve-month forward window holds more than 35% of the total debt stack — or if any facility within 18 months has not yet started formal refinancing engagement — the next agenda item is the Maturity Wall Heat-Map™. |
ENGAGE DAWGEN GLOBAL CORPORATE ADVISORY
Three Ways to Begin
If this article has prompted a serious question about your enterprise’s capital structure resilience, the next move is rarely a financing transaction. It is a conversation. Dawgen Global Corporate Advisory works with Caribbean boards, CFOs, founders and family business principals to translate the DRCS-F™ into a structured programme — sized to the enterprise, calibrated to the sector, and grounded in the disciplines that distinguished Jamaica’s sovereign architecture under Hurricane Melissa. There are three ways to begin, depending on where the enterprise stands today.
| PATHWAY 1 RECOMMENDED FOR MOST ENTERPRISES
The Capital Resilience Diagnostic™ A scoped, structured engagement that produces an investor-grade view of your capital structure resilience — and a board-ready roadmap to strengthen it. What you receive: → Capital Structure Resilience Report with your current Capital Resilience Rating™ (Levels 1–5) → 50-point Capital Resilience Index™ score across all ten pillars → Designed Liquidity Layering Stack™ with named providers and tested activation conditions → Covenant Stress Heat-Map™ under base, downside and severe scenarios → Recovery Velocity Score™ benchmarked against your sector → Capital Source Mix Wheel™ with current vs. target diversification roadmap → Boardroom Reporting Pack ready for the next board or audit committee meeting Engagement profile: Typically 4–6 weeks. Led by senior Dawgen Global advisory partners. Scoped to enterprise size. Outputs delivered to the board, not buried in management. To begin: Email [email protected] with the subject line “DRCS-F Diagnostic — [Company Name]”. A senior advisor will respond within one business day. |
| PATHWAY 2 FOR BOARDS NOT YET CONVINCED
The DRCS-F™ Boardroom Briefing A 60-minute structured briefing delivered to your board or audit committee, in person or virtually, by a senior Dawgen Global advisory partner. The briefing walks the board through: → The post-Melissa landscape and what it implies for the enterprise’s specific sector → A live walk-through of the ten DRCS-F™ pillars against the enterprise’s known risk profile → Three to five board-level questions that should be on the next audit committee agenda → An indicative Capital Resilience Rating™ band based on what is publicly observable about the enterprise Engagement profile: 60 minutes. Complimentary for qualifying boards (mid-market and listed enterprises in the Caribbean). Outputs include a 4-page board memorandum. To request: Email [email protected] with the subject line “Boardroom Briefing Request — [Company Name]”. |
| PATHWAY 3 FOR PRACTITIONERS AND SELF-DIRECTED READERS
Request the Framework Receive the full DRCS-F™ Framework Edition 1.0 — 60+ pages, ten pillars, five proprietary tools, six sector playbooks, and the implementation roadmap. Most useful for: → CFOs and treasurers conducting their own self-diagnostic ahead of a board conversation → Lenders, investors and DFIs benchmarking Caribbean borrower resilience → Sector associations, business chambers and policy institutions seeking a diagnostic tool → Family business principals preparing for a generational transition To request: Email [email protected] with the subject line “DRCS-F Edition 1.0 Request — [Your Role / Organisation]”. |
© 2026 Dawgen Global Group. All rights reserved.
DRCS-F™, Maturity Wall Heat-Map™, Refinancing Lead-Time Calculator™, Concentration Diagnostic Matrix™, Capital Resilience Rating™ and related framework elements are trademarks of Dawgen Global Group.
About Dawgen Global
“Embrace BIG FIRM capabilities without the big firm price at Dawgen Global, your committed partner in carving a pathway to continual progress in the vibrant Caribbean region. Our integrated, multidisciplinary approach is finely tuned to address the unique intricacies and lucrative prospects that the region has to offer. Offering a rich array of services, including audit, accounting, tax, IT, HR, risk management, and more, we facilitate smarter and more effective decisions that set the stage for unprecedented triumphs. Let’s collaborate and craft a future where every decision is a steppingstone to greater success. Reach out to explore a partnership that promises not just growth but a future beaming with opportunities and achievements.
 Email: [email protected]
  Visit: Dawgen Global Website

 WhatsApp Global Number : +1 555-795-9071
Caribbean Office: +1876-6655926 / 876-9293670/876-9265210  WhatsApp Global: +1 5557959071
USA Office: 855-354-2447
Join hands with Dawgen Global. Together, let’s venture into a future brimming with opportunities and achievements

