
How to tell AI revenue that will show up in EBIT from AI revenue that only shows up in the presentation
Every board has now heard some version of this sentence: since we launched the AI tool, sales are up 15%. The slide shows two bars, one before and one after, and the after bar is taller. The room is pleased. The investment is approved for another year.
Then someone asks the awkward questions. Sales were up 15%, but were they up because of the tool, or because it was the Christmas quarter, or because a competitor ran out of stock, or because prices rose? And if revenue rose by 15%, why did operating profit rise by so much less?
Those questions usually go unanswered, not because the people presenting are careless, but because revenue is the hardest thing in a business to attribute. Cost falls where you cut it. Revenue rises for a dozen reasons at once, and AI is only one of them.
This fifth article of Hours Into Earnings™ covers the first value lever of The Dawgen Earnings Crossing™, Revenue Lift. It does not argue that AI revenue claims are false. Many are true. It argues that a board should count AI revenue only when it has been proved in a particular way, and it sets out a four-part test that separates revenue you can bank from revenue you can only forecast.
AI revenue is real. Proof is rare.
The evidence that AI can grow revenue is strong. Boston Consulting Group’s Applied AI Index 2026 found that the companies furthest ahead in AI delivered 2.4 times the revenue growth of the laggards. McKinsey’s research on personalization, the use of data and analytics to tailor offers to each customer, found that leading practitioners reported revenue increases of 5% to 15% and marketing spend that worked 10% to 30% harder.
The evidence that most companies can prove it is weak. MIT’s Project NANDA found that more than half of generative AI budgets go to sales and marketing tools, chosen partly because their benefits are visible, yet it found the biggest measurable returns elsewhere, in the back office. McKinsey’s 2026 survey found that the organizations getting the most from AI were twice as likely as everyone else to have defined processes for measuring its impact.
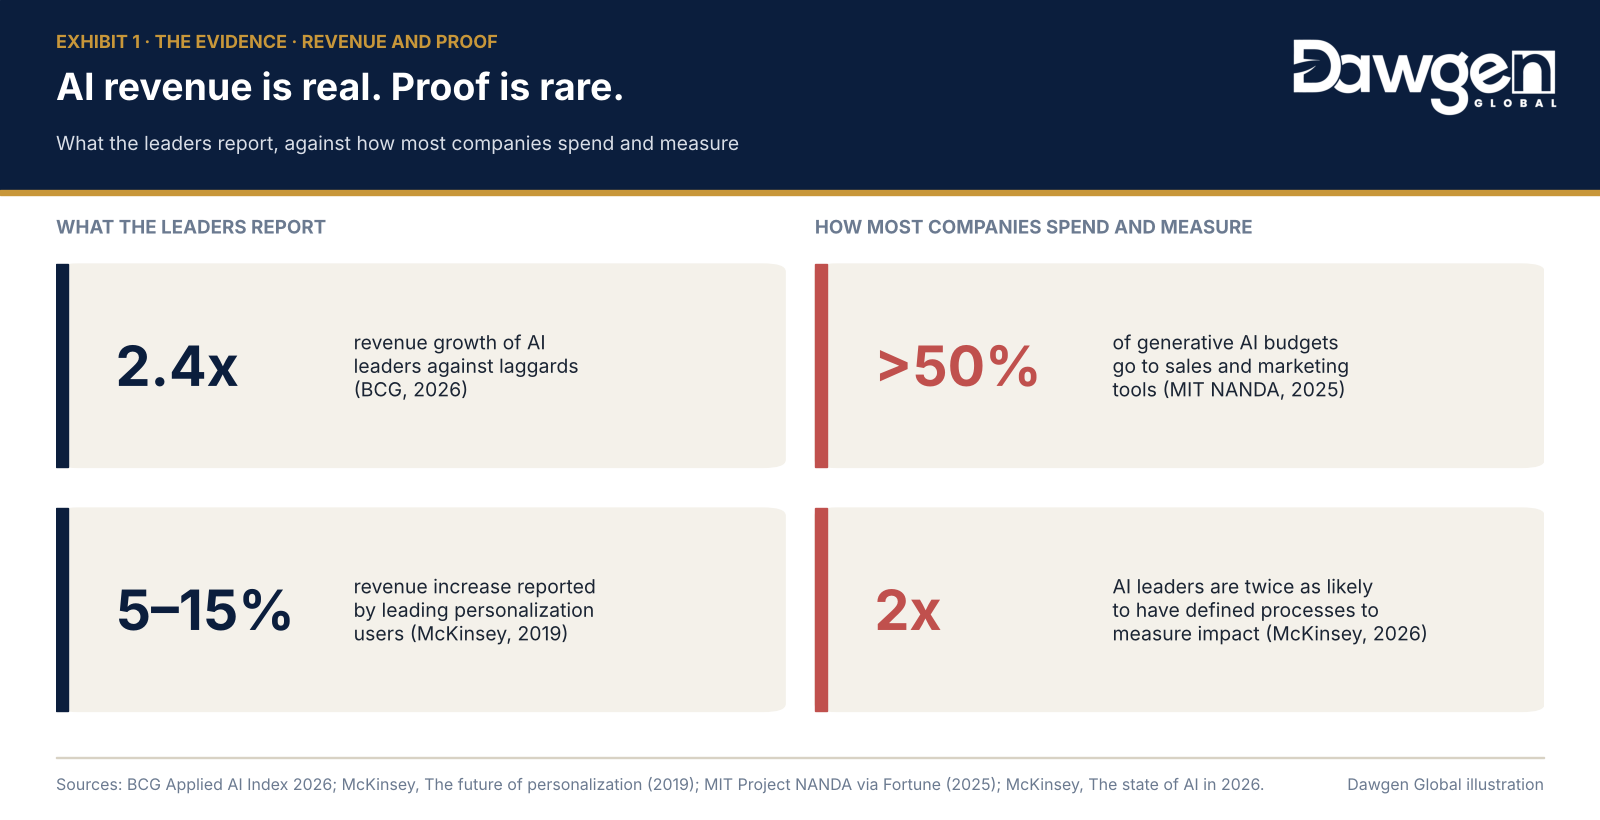
Put those findings together and the picture is clear. Revenue-side AI can pay handsomely. But the spending is running ahead of the measurement, and a board that approves revenue projects on before-and-after charts is approving them on faith.
The solution is not to stop investing in revenue AI. It is to insist that every revenue claim pass the same test, before the revenue is counted in a budget, a bonus or a valuation.
Four ways AI revenue claims overstate
Most inflated AI revenue claims are made in good faith. They overstate for four predictable reasons.
- It would have happened anyway. Sales rise in December, at the start of the tourist season and when a competitor stumbles. A before-and-after comparison credits the AI tool with all of it. Without a fair comparison, the season gets the credit it deserves only by accident.
- It was bought with a discount. An AI recommendation engine that drives more sales by offering deeper promotions can raise revenue and lower profit at the same time. Revenue is the wrong measure; what matters is the contribution margin on the extra sales, after discounts, cost of goods and the cost of serving them.
- It was moved, not made. A customer who buys online because of a well-timed AI message may simply have stopped buying in the branch. A customer who buys this month because of a reminder may not buy next month. Revenue moved between channels or between periods is not new revenue.
- It was claimed twice. The new AI pricing tool, the new loyalty campaign and the new sales incentive all launch in the same quarter, and each team reports the full increase as its own. Added together, the claims exceed the growth the company actually achieved.
None of these makes AI revenue impossible to prove. They simply mean that revenue must be measured more carefully than cost, using a test designed for it.
The Bankable Revenue Test™: four questions before the board counts it
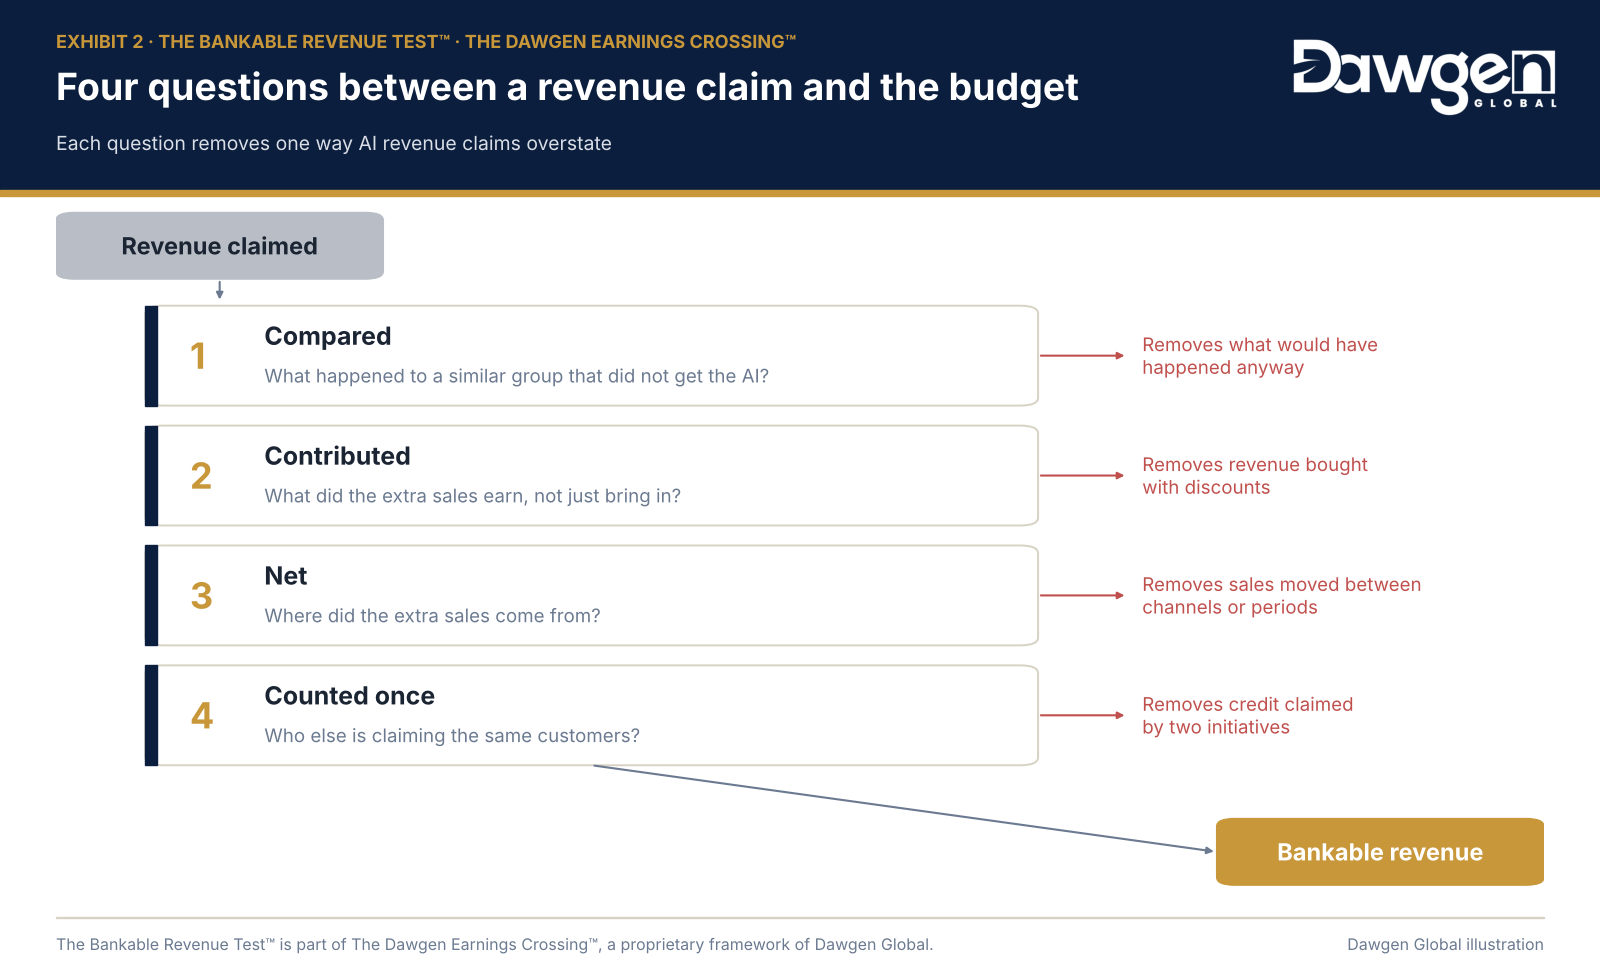
The Bankable Revenue Test™ is how the Revenue Lift lever of The Dawgen Earnings Crossing™ decides which AI revenue counts. Each of its four questions answers one of the four ways claims overstate. Revenue that passes all four is bankable: it can go into the budget, the bonus pool and, eventually, the valuation. Revenue that fails any of them stays in the forecast.
| Question | It answers | What counts as a pass |
| 1. Compared: what happened to a similar group that did not get the AI? | It would have happened anyway | The lift is measured against a comparison group of customers, branches or weeks that did not receive the AI treatment, over the same period |
| 2. Contributed: what did the extra sales earn, not just bring in? | It was bought with a discount | The lift is stated at contribution margin, after discounts, cost of goods and the cost of serving the extra sales |
| 3. Net: where did the extra sales come from? | It was moved, not made | Sales lost in other channels and sales pulled forward from later periods are deducted |
| 4. Counted once: who else is claiming the same customers? | It was claimed twice | The lift is entered in the AI Earnings Register™, where overlapping initiatives share credit rather than each claiming the whole |
Two further rules make the test durable.
Hold it for two quarters. A lift that appears in one quarter and disappears in the next was a novelty, not a capability. Bankable revenue should hold for at least two consecutive quarters before it is built into the next year’s plan.
Keep a small comparison group permanently. Even after the AI tool is rolled out to everyone, a small group of customers or branches should remain without it, so that the lift can be re-measured every quarter rather than assumed for ever.
Where AI revenue is most bankable in the Caribbean
Some revenue uses of AI pass the test far more easily than others, because their effect is direct, their customers are known and a comparison group is easy to keep. In regional businesses, five stand out.
| Use | Where it fits | Why it tends to pass the test |
| Retention and churn prediction | Telecoms, insurance, credit unions, subscription and membership businesses | The customers at risk are identified individually, so a comparison group of equally at-risk customers can be left untreated |
| Next-best offer to existing customers | Banks, insurers, distributors with account customers | Offers go to known accounts; uptake and margin can be measured per customer |
| Sales lead prioritization | Distributors, B2B services, financial advisers | Representatives’ time moves to the leads most likely to buy; conversion can be compared across teams |
| Yield and upsell in hospitality | Hotels, attractions, tour operators | Room rates, packages and add-ons can be tested by date and channel against a fair comparison |
| Cross-sell at the point of service | Pharmacies, hardware, auto parts, quick-service restaurants | Prompts appear at the counter or till; basket size can be compared between prompted and unprompted transactions |
Notice what these have in common: they act on existing customers whose behaviour the business can already see. AI that tries to win brand-new customers through broad marketing can also work, but its effect is harder to separate from everything else in the market, and it should be held to the test with particular care.
The region’s scale is an advantage here. A Caribbean business often knows its customers by name, and a branch network of eight or ten locations makes it straightforward to run AI in half of them and compare.
The arithmetic: a 15% claim, and what survives the test
Consider an illustrative composite: a Caribbean pharmacy and health retail chain with 12 branches and annual revenue of J$6.0 billion. It installs an AI cross-sell tool at the counter in six of its branches. After six months, the project team reports that sales in those branches are up 15%, J$225 million of extra revenue, and proposes rolling the tool out to every branch.
The finance director applies the Bankable Revenue Test™.
| Step | Question | Finding | What remains (J$m, six months) |
| Claimed | Sales in the six AI branches up 15% | 225 revenue | |
| 1. Compared | What did the six branches without the tool do? | They grew 9% over the same period, from the season and a price rise. Only 6 points of the 15 are due to the tool | 90 revenue |
| 2. Contributed | What did the extra sales earn? | Contribution margin on the extra items, after bundle discounts and cost of goods, is 30% | 27 contribution |
| 3. Net | Were any sales moved, not made? | About J$15 million of the extra revenue displaced purchases of other items in the same baskets | 22.5 contribution |
| 4. Counted once | Who else claims these customers? | A loyalty campaign ran in the same branches; the register assigns it a third of the remaining lift | 15 contribution |
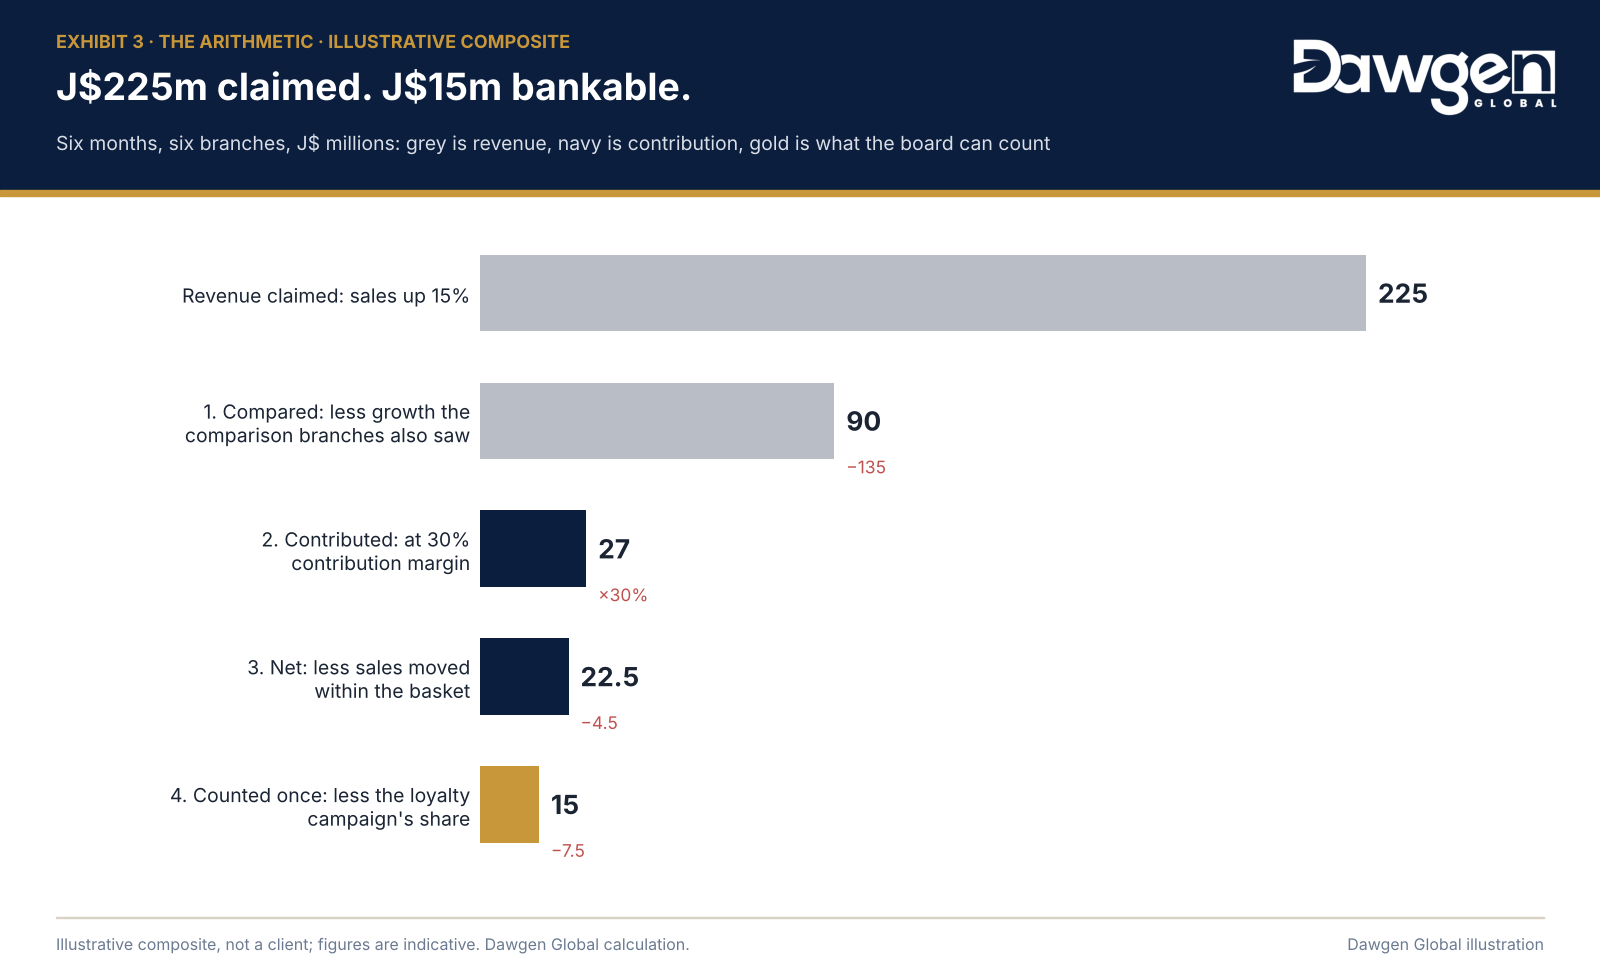
The J$225 million of revenue on the slide becomes J$15 million of bankable contribution for six months, or about J$30 million a year. After the tool’s running cost of about J$8 million a year for the six branches, the net gain is roughly J$22 million a year.
That is a good investment, and the rollout should go ahead. Extended to all twelve branches, the bankable gain approaches J$48 million a year after running costs. But it is a very different investment from the one on the slide. A board that had budgeted J$450 million a year of extra revenue would have been disappointed. A board that budgets J$22 million of contribution, and keeps measuring it, will not be.
The composite is illustrative and does not describe any client. Figures are indicative.
How to run a fair comparison in a small market
The idea of a comparison group can sound like something only large companies with data science teams can manage. It is not. Caribbean businesses can run one with five simple disciplines.
- Decide the comparison before launch, not after. Choose which customers, branches or weeks will not receive the AI tool before it goes live, and write the choice down. Groups chosen afterwards are always chosen kindly.
- Match like with like. Pair branches of similar size and location, or split customers at random within each segment. Never compare the flagship branch with the smallest one.
- Keep the comparison long enough. At least one full business cycle, which for most regional businesses means a full quarter, and longer where tourism or harvest seasons dominate.
- Agree the measure in advance. Contribution margin per customer or per branch, defined by finance before launch, not chosen by the team presenting the results.
- Let finance own the count. The team that built the AI tool should not be the team that measures its revenue. Finance records the result in the AI Earnings Register™, alongside every other initiative claiming the same customers.
Where a comparison group is genuinely impossible, for example a single-site business, the next best approach is to switch the tool on and off in alternating weeks and compare the two. It is less precise, but it is far better than a before-and-after chart.
Three questions to ask this week
Put three questions to the managers presenting your AI revenue results:
- What happened over the same period to the customers, branches or weeks that did not get the AI tool?
- What is the extra contribution margin, after discounts and the cost of serving the extra sales, not just the extra revenue?
- Which other initiatives are claiming the same customers, and how has the credit been shared?
If the answer to the first question is “there was no comparison group”, the result on the slide is a forecast, not a fact.
The next article, Cash Is the AI Dividend Nobody Counts, moves from profit to cash: how AI-driven forecasting and collections release working capital once, and permanently.
Is your AI revenue bankable?
Dawgen Global’s Earnings Crossing Blueprint™ designs your revenue-side AI so that its results can be proved: the comparison groups, the contribution-margin measures, the AI Earnings Register™ entries and the board reporting, agreed before launch. For initiatives already running, we apply the Bankable Revenue Test™ to the results you have and show what can be counted. It draws on our business advisory, data analytics and AI transformation specialists across the Caribbean. Fees are customized to each client’s circumstances and agreed deliverables.
Request a scoping conversation: info@dawgen.global · (876) 926-5210 · US 855-354-2447 · dawgen.global
Dawgen Global — Big Firm Capabilities. Caribbean Understanding.
About Dawgen Global
Dawgen Global is an independent, integrated multidisciplinary professional services firm headquartered at 47 Trinidad Terrace, New Kingston, Jamaica, serving more than 15 territories across the Caribbean. Founded and led by Dr. Dawkins Brown, Executive Chairman, the firm is independent and not affiliated with any international network. It delivers a full suite of professional services under one roof: audit and assurance; tax advisory; IT and digital transformation; risk management; cybersecurity; actuarial and insurance regulatory advisory; HR advisory; mergers and acquisitions; corporate recovery; business advisory and strategy; accounting BPO and virtual CFO services; and legal process outsourcing.
The proposition is simple: big-firm capability without the big-firm price. Dawgen Global’s integrated approach is built for the specific complexities and opportunities of the Caribbean market, helping organizations make sharper, better-informed decisions that drive measurable progress.
To explore a partnership, reach out:
- Website: dawgen.global
- Email: info@dawgen.global
- WhatsApp (Global): +1 555-795-9071
- Caribbean offices: +1 876-665-5926 | +1 876-929-3670 | +1 876-926-5210