
The Difference Is the Cost of Standing Still.
| IN BRIEF
Two businesses can report the same EBITDA (earnings before interest, tax, depreciation and amortisation) and be worth very different amounts, because one must spend a large share of it every year simply to keep its buildings, vehicles and equipment standing. EBITA (earnings before interest, tax and amortisation) charges for that cost; EBITDA does not. This article explains when each measure is the right one, why the depreciation charge often understates the true cost of standing still in the Caribbean, how the lease accounting standard has quietly inflated EBITDA since 2019, and a three-number test that tells a chief executive whether the business is maintaining its assets or consuming them. |
SECTION 1
Four million dollars, twice

Two owners sat in the same bank on the same morning, a week apart. Each brought a set of accounts showing EBITDA of about US$4.0 million. Each carried net debt of about US$12.0 million, three times EBITDA. Each asked for a longer facility to fund the next stage of growth.
The first owner runs a resort hotel on the north coast: 140 rooms, a restaurant, two pools, a laundry, a fleet of shuttle buses and the plant room that keeps it all cool and supplied with water. The second runs a distribution business from a leased warehouse: a sales team, a modest fleet of delivery vans and a well-kept customer list.
On the lender’s first screen, they were the same credit. Same EBITDA, same leverage, same request.

They were not the same business. The hotel’s depreciation charge was about US$2.0 million a year: roofs, chillers, kitchens, furniture, linen, buses and pumps, all wearing out in salt air and sun. The distributor’s was about US$0.4 million. Once the cost of wearing out the assets was charged, the hotel’s earnings fell to US$2.0 million. The distributor’s barely moved, to US$3.6 million.
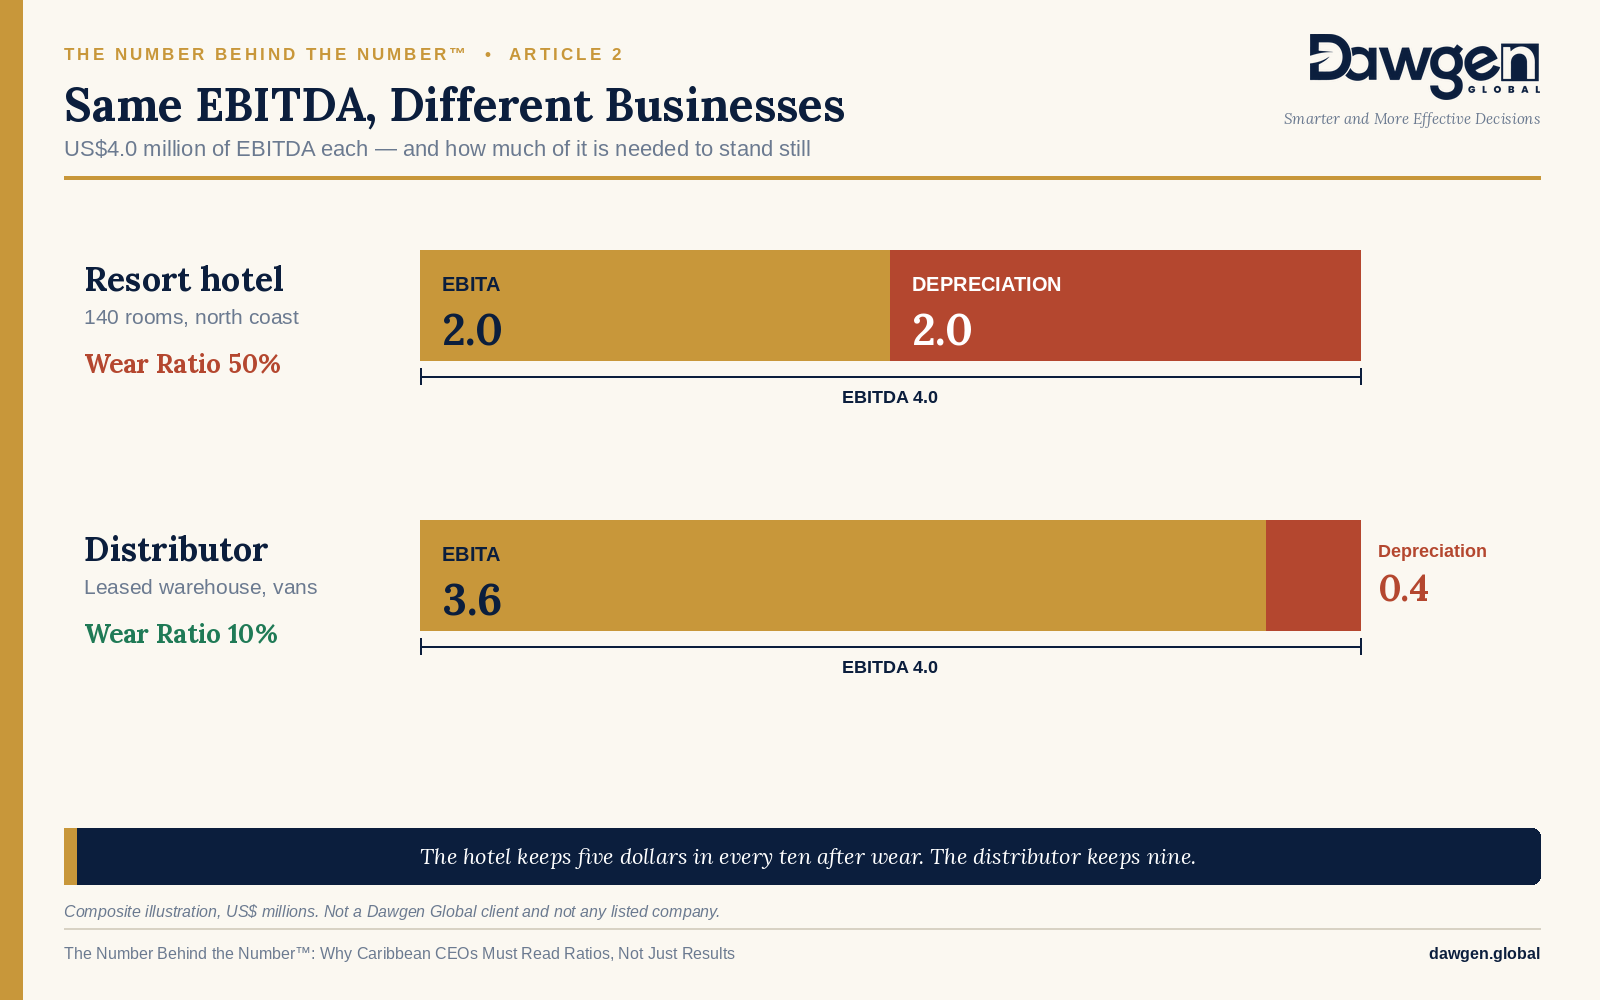
The hotel owner had been told for years that his business was “a four-million-dollar business”. In one sense it was. But half of that four million was already spoken for, every year, by the cost of standing still: replacing what the business had used up just to remain the business it was. The distributor kept nine dollars in every ten.
The difference between those two numbers has a name. It is the difference between EBITDA and EBITA, and it is the subject of this article.
Both businesses are composites, drawn from patterns seen across the region rather than from any single company.
SECTION 2
The Number Behind the Number™ and the E·B·I·T·A Lens™
The Number Behind the Number™ is a twelve-part series on the ratios that decide how a business is financed, valued and judged. Each article stands on its own, so the framework is set out in full here, as it is in every article in the series.
Two measures, one difference
Both measures begin with what the business earns from its operations, before the cost of financing it and before tax.
EBITDA — earnings before interest, tax, depreciation and amortisation — shows operating earnings before any charge for the assets the business uses. It is the figure bankers, bond arrangers and buyers quote most often, because it removes financing choices, tax positions and accounting estimates and so lets one business be compared with another.
EBITA — earnings before interest, tax and amortisation — deducts depreciation, the accounting recognition that buildings, plant, vehicles and equipment wear out and must be replaced. It still excludes amortisation, which relates mostly to intangible assets such as acquired goodwill and customer lists.
| EBITDA − EBITA = Depreciation |
Neither measure is right and the other wrong. They answer different questions, and this article is about knowing which question is being asked.
The Wear Ratio
The series connects the two with one additional measure. The Wear Ratio is depreciation as a share of EBITDA:
| Wear Ratio = Depreciation ÷ EBITDA |
It answers a plain question: of every dollar the business earns before charging for its assets, how much is needed simply to keep those assets standing? In the opening story, the hotel’s Wear Ratio is 50 per cent. The distributor’s is 10 per cent.
The five lenses
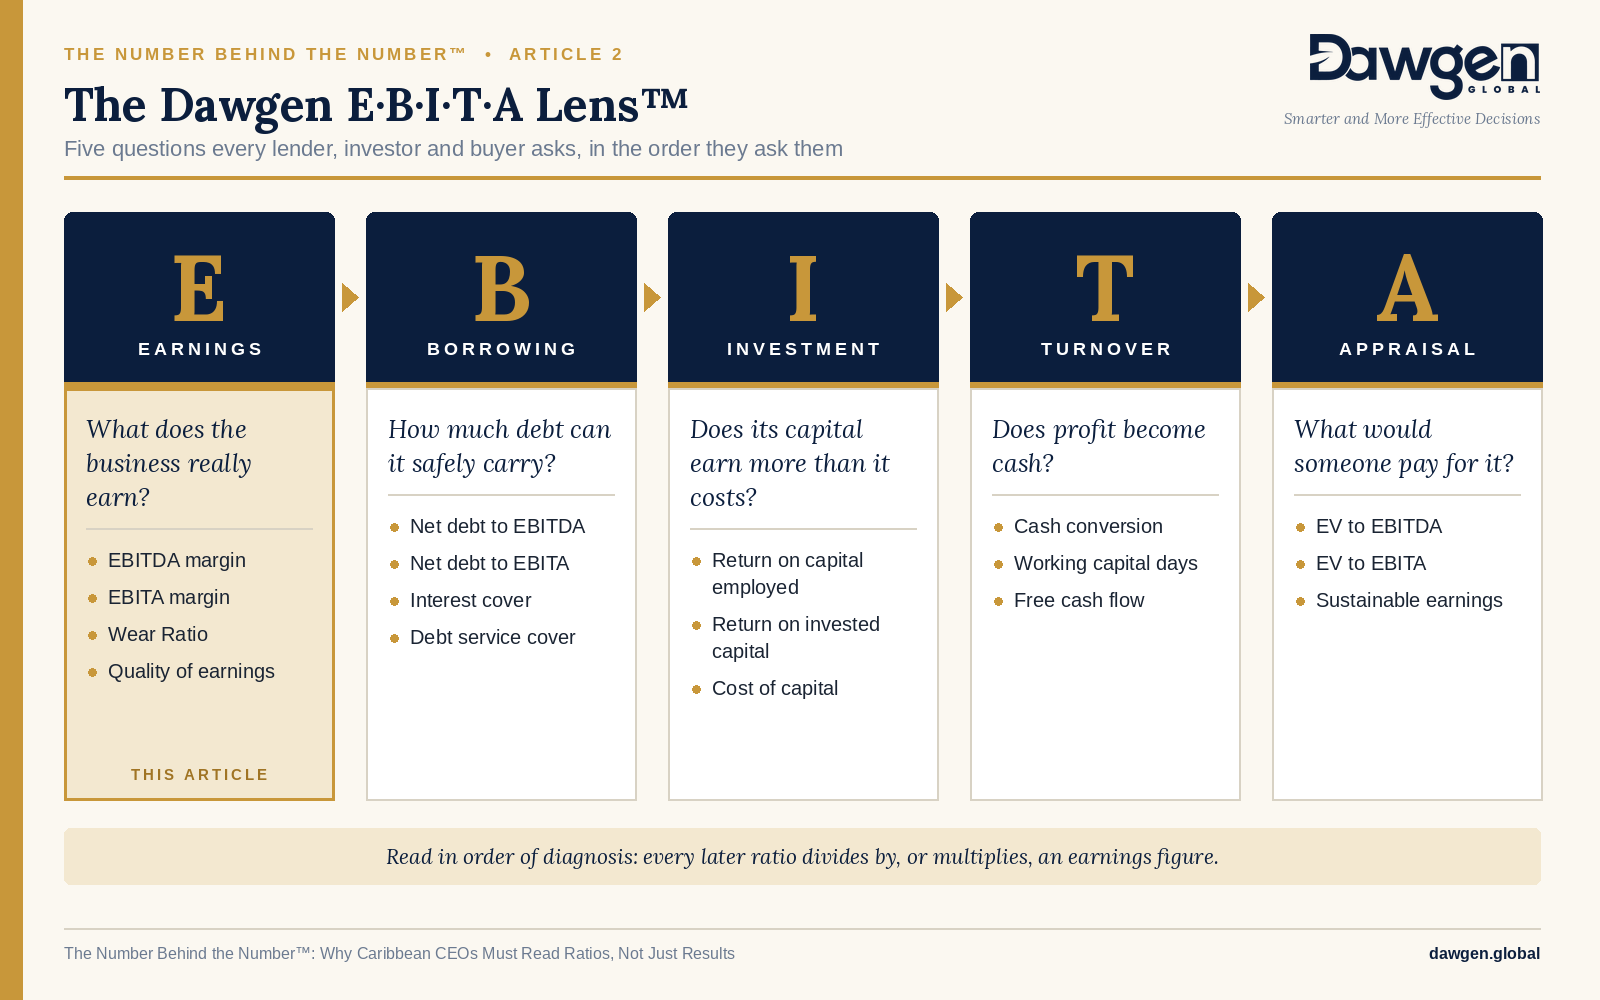
The Dawgen E·B·I·T·A Lens™ turns the acronym into five questions that every serious reader of a company’s accounts asks, in roughly this order.
| Lens | The question | The ratios that answer it |
| E — Earnings | What does the business really earn? | EBITDA margin, EBITA margin, Wear Ratio, quality of earnings |
| B — Borrowing | How much debt can it safely carry? | Net debt to EBITDA and to EBITA, interest cover, debt service coverage ratio (DSCR) |
| I — Investment | Does its capital earn more than it costs? | Return on capital employed (ROCE), return on invested capital (ROIC) |
| T — Turnover | Does profit become cash? | Cash conversion, working capital days, free cash flow |
| A — Appraisal | What would someone pay for it? | Enterprise value (EV) to EBITDA and to EBITA |
This article sits in the first lens, Earnings, and reaches into the second and fifth: the choice between EBITDA and EBITA changes how much a business appears able to borrow and what it appears to be worth.
SECTION 3
The pattern: the cost of standing still
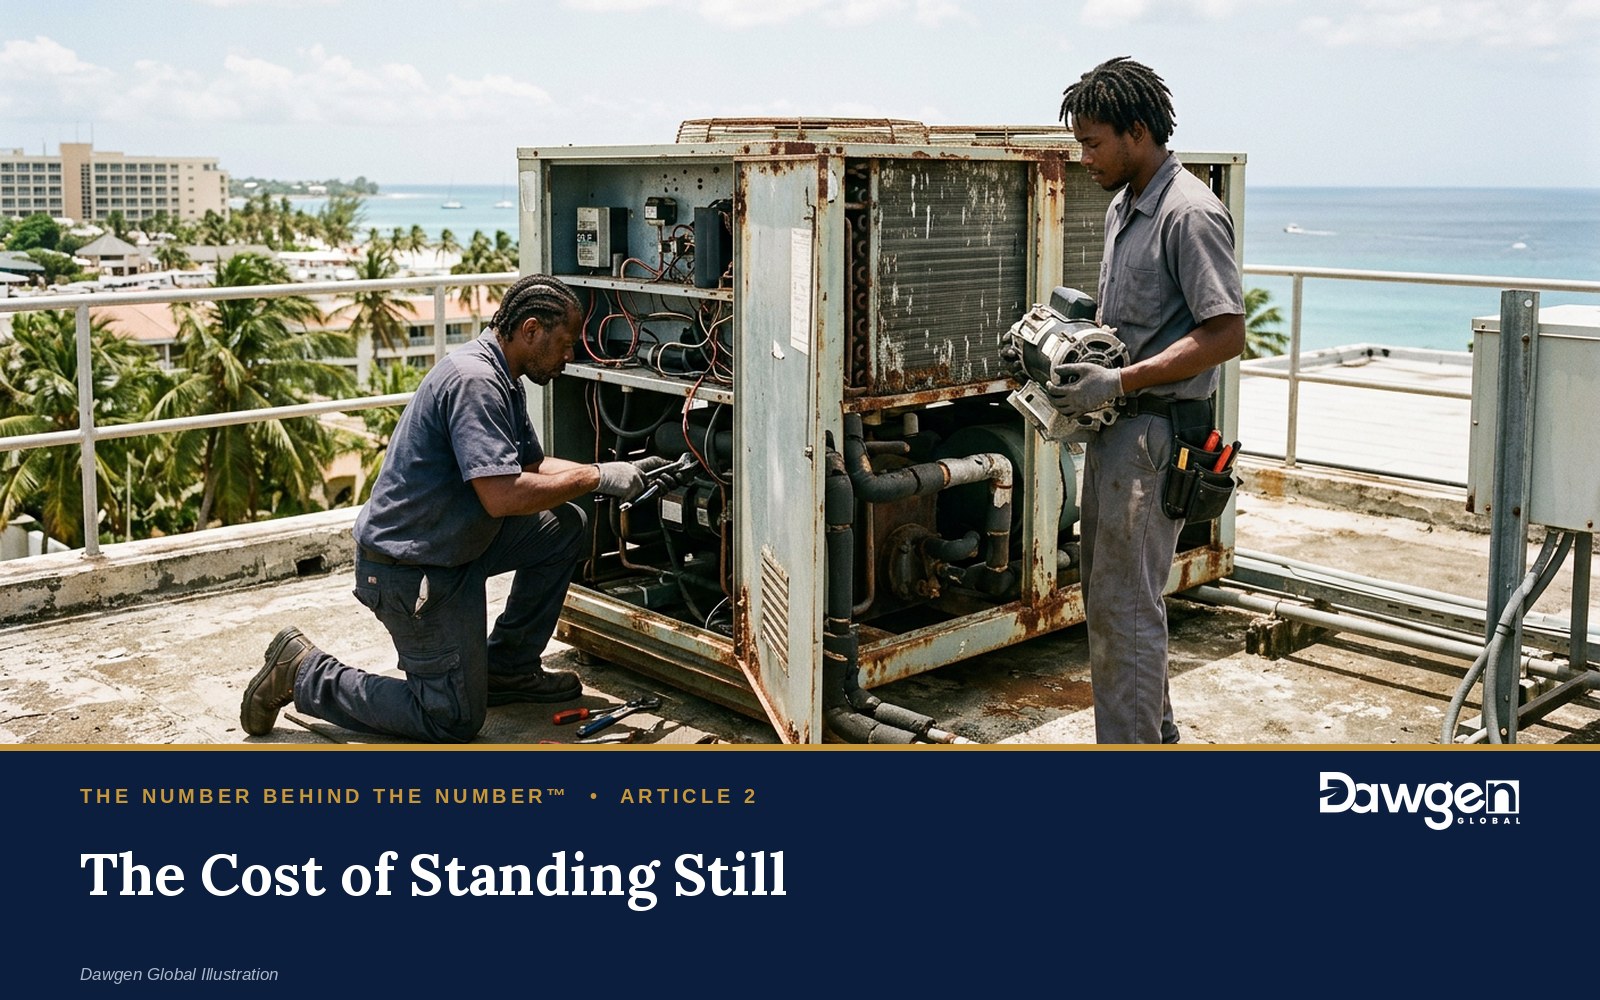
Every business that owns physical assets carries a cost that does not appear on any invoice in the month it is incurred. The roof loses a year of its life. The chiller runs another eight thousand hours. The delivery truck adds forty thousand kilometres. Nothing is paid out, but something is used up, and one day the bill arrives all at once.
Depreciation is how accounting spreads that bill across the years in which the asset is used. It is not a cash payment. That is precisely why EBITDA removes it, and precisely why removing it can mislead. A business that reports strong EBITDA while its assets wear out is not generating that EBITDA for free. It is borrowing from its own future, and the loan falls due when the roof leaks, the chiller fails or the truck will not start.
When each measure is the right one
The answer depends on the question being asked.
The pattern that causes harm is not the use of EBITDA. It is the use of EBITDA to answer the questions in the lower half of the table.
Who reaches for which number
The people around a business each have a reason to prefer one measure.
- Lenders quote EBITDA because covenants must be simple to test and because, over the term of most facilities, depreciation is not what stops a borrower paying. Careful lenders also watch capital spending, because a borrower that stops replacing assets is storing up trouble for the end of the term.
- Buyers quote EBITDA multiples in the headline, because that is how the market speaks. They then adjust the price for the capital spending the business will need, which is where a high Wear Ratio turns into a lower offer.
- Owners and managers tend to prefer EBITDA because it is the larger number. The discipline lies in managing to EBITA, the number that tells them whether the business is paying its own way.
How wear varies by business
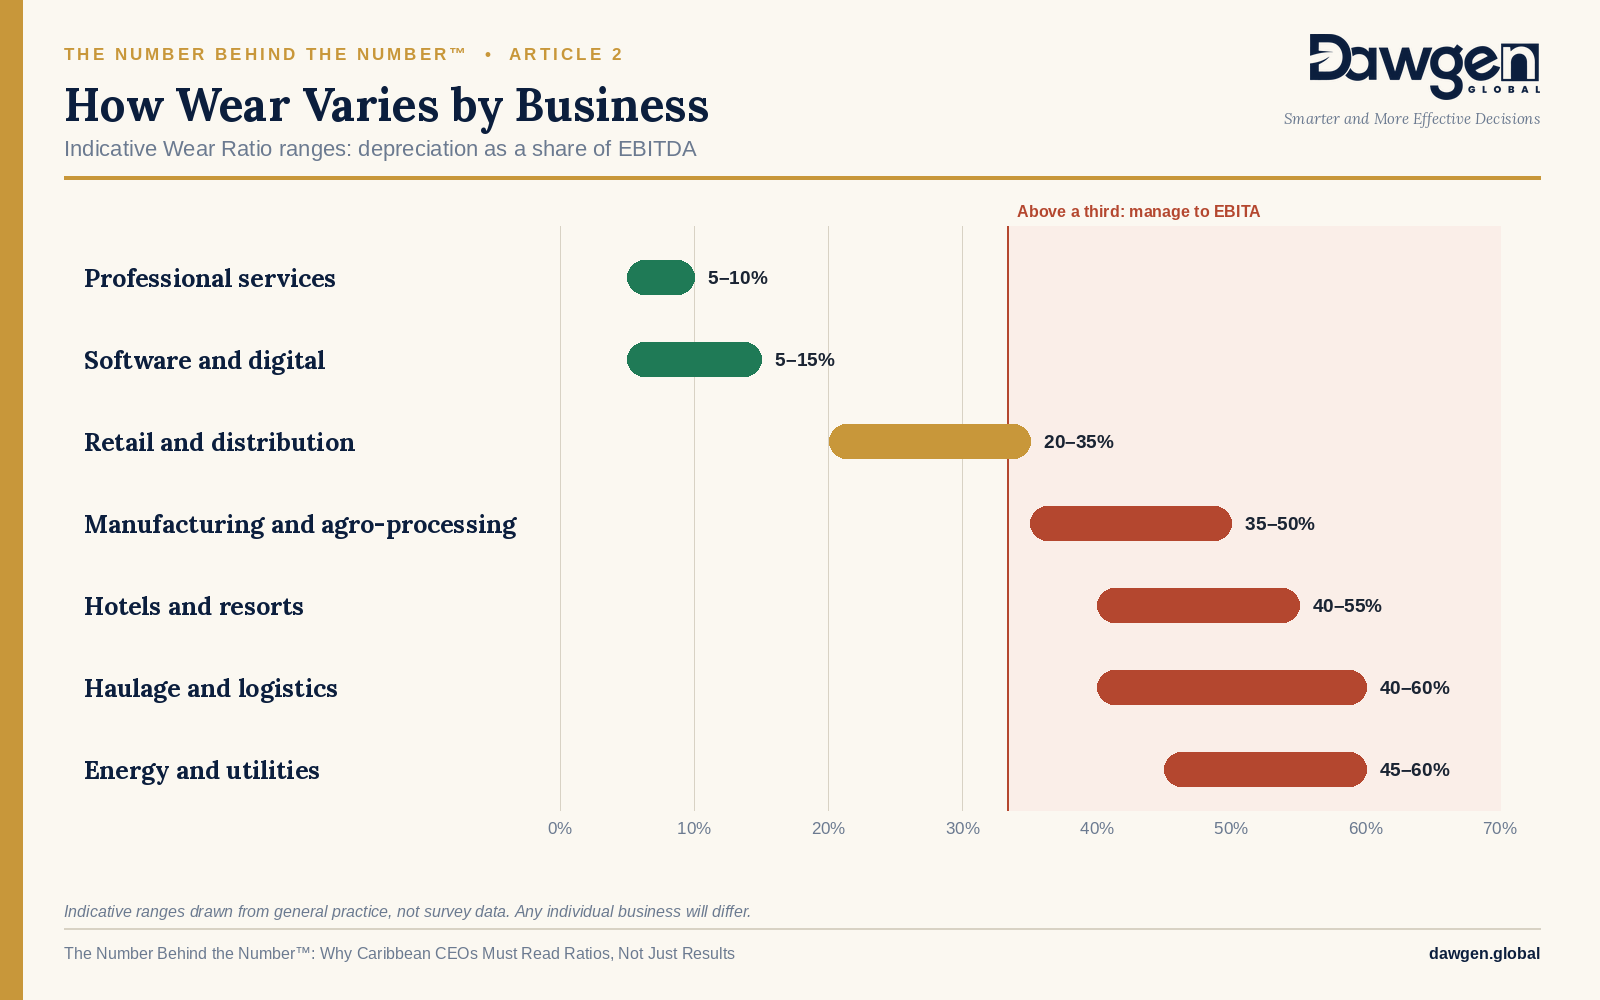
The Wear Ratio varies widely by industry, which is why a single EBITDA multiple applied across sectors misleads. The ranges below are indicative, drawn from general practice rather than survey data, and any individual business will differ. Capitalised software development is amortised rather than depreciated, and deserves the same scrutiny.
Why depreciation itself can understate the cost
EBITA is the more honest measure, but it is not the final word. The depreciation charge is calculated on what an asset cost when it was bought, spread over the life management expects it to have. Three things can make that charge smaller than the true cost of standing still.
- Historical cost. A chiller bought ten years ago is depreciated on its price ten years ago. Its replacement will be bought at today’s price.
- Optimistic lives. If the books assume equipment lasts fifteen years and it actually lasts ten, the annual charge is a third too low, and the shortfall appears later as a loss on disposal or a sudden replacement.
- Maintenance that is not being done. Depreciation assumes the asset will be replaced. If spending on replacement runs well below depreciation for several years, the business is consuming its asset base, and neither EBITDA nor EBITA shows it.
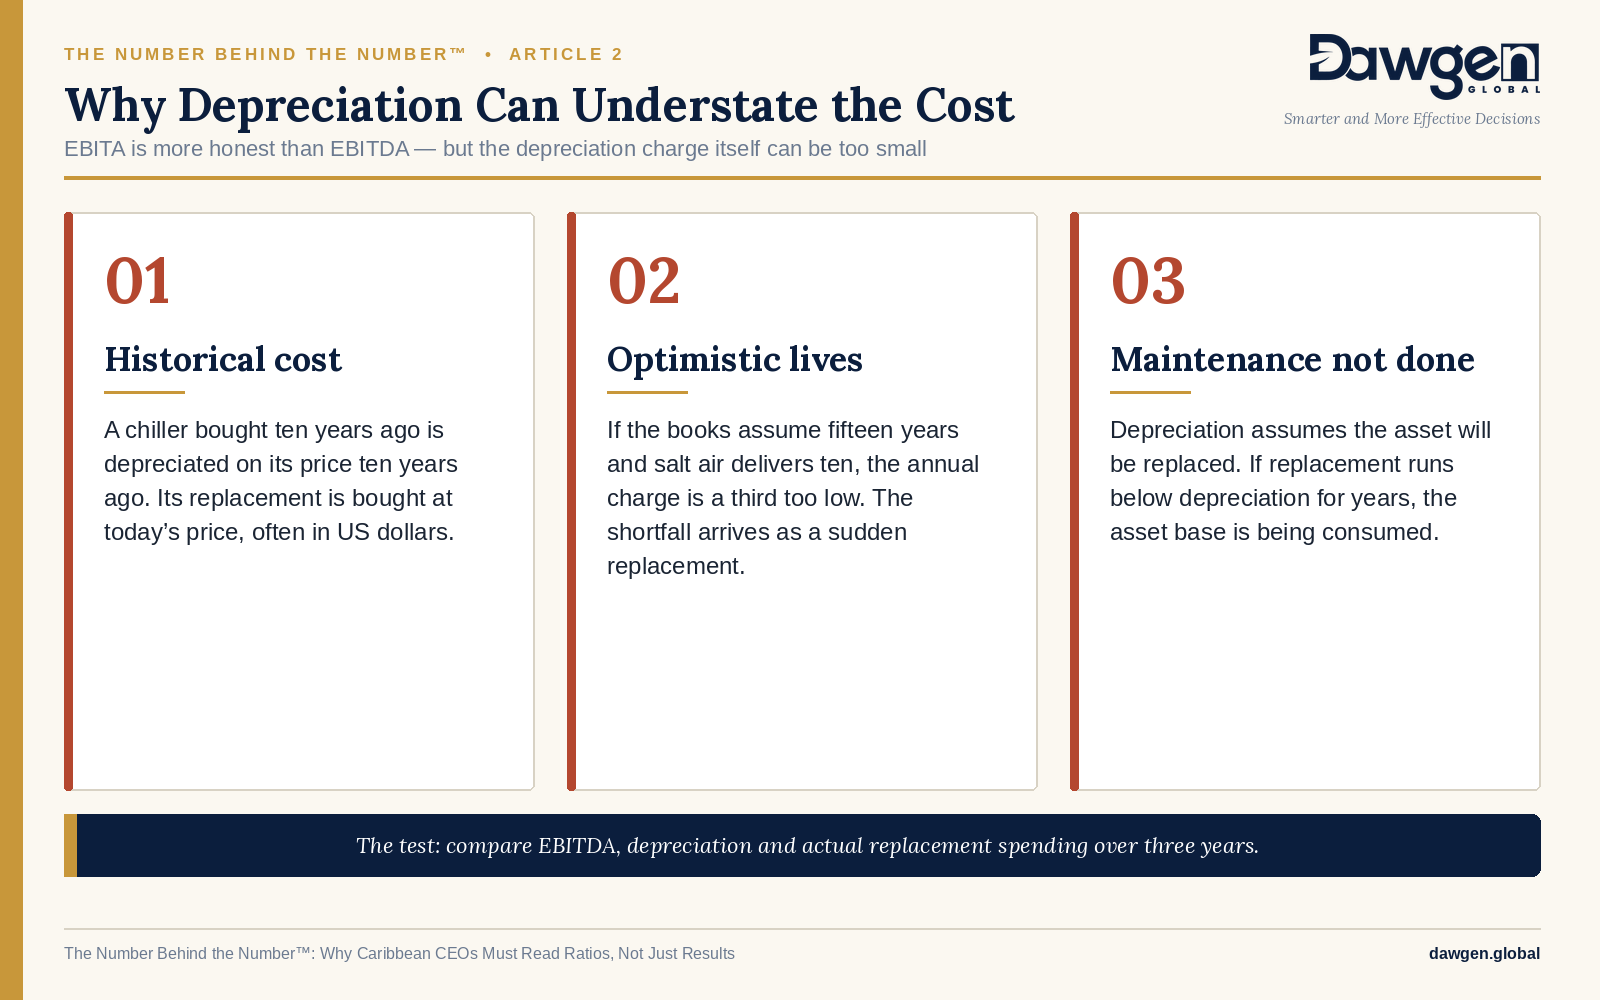
The practical test is to compare three figures over three years: EBITDA, depreciation, and what the business actually spent on maintaining and replacing its assets, as distinct from spending on growth. That comparison is the Standing-Still Test set out later in this article.
A note on amortisation
EBITA excludes amortisation because most of it arises from acquisitions: the goodwill and customer relationships recognised when one business buys another. Those do not need replacing in the way a truck does. The exception is software. Where a business capitalises the cost of developing or implementing systems and then amortises it, that charge often behaves exactly like depreciation, because the systems will need replacing too. A careful reader treats recurring software amortisation as part of the cost of standing still.
SECTION 4
The rent that moved below the line

Since 2019, a change in accounting has lifted EBITDA for thousands of businesses without changing a single dollar of their cash. Every chief executive who compares EBITDA across years, or with a competitor, needs to understand it.
International Financial Reporting Standard 16 (IFRS 16), Leases, applies to periods beginning on or after 1 January 2019. Before it, the rent on a leased shop, warehouse, office or vehicle was an operating expense, deducted before EBITDA. Under IFRS 16, most leases are brought onto the balance sheet: the business recognises a right-of-use asset and a lease liability. The rent disappears from operating expenses. In its place come two charges, depreciation of the right-of-use asset and interest on the lease liability, and both sit below EBITDA.
The result is mechanical. EBITDA rises by the whole of the rent. EBITA rises only by the interest portion, because the depreciation of the right-of-use asset is still charged. Profit, over the life of the lease, is broadly unchanged. Cash is entirely unchanged: the same rent leaves the same bank account on the same day.
A composite retailer, before and after
Consider a composite retailer with revenue of US$30 million, trading from leased premises at a rent of US$1.2 million a year.
| US$ millions | Before IFRS 16 | After IFRS 16 | Change |
| Rent in operating expenses | (1.20) | — | Removed |
| EBITDA | 1.80 | 3.00 | +67% |
| Depreciation of owned assets | (0.50) | (0.50) | — |
| Depreciation of right-of-use asset | — | (0.95) | New |
| EBITA | 1.30 | 1.55 | +19% |
| Bank interest | (0.30) | (0.30) | — |
| Interest on lease liability | — | (0.25) | New |
| Profit before tax | 1.00 | 1.00 | 0% |
| Rent actually paid in cash | 1.20 | 1.20 | 0% |
| Net debt, including lease liability | 3.00 | 7.50 | +150% |
| Net debt to EBITDA | 1.7× | 2.5× | Higher |
Composite illustration. Rent is split evenly between depreciation and interest for simplicity; in practice interest is higher in the early years of a lease.
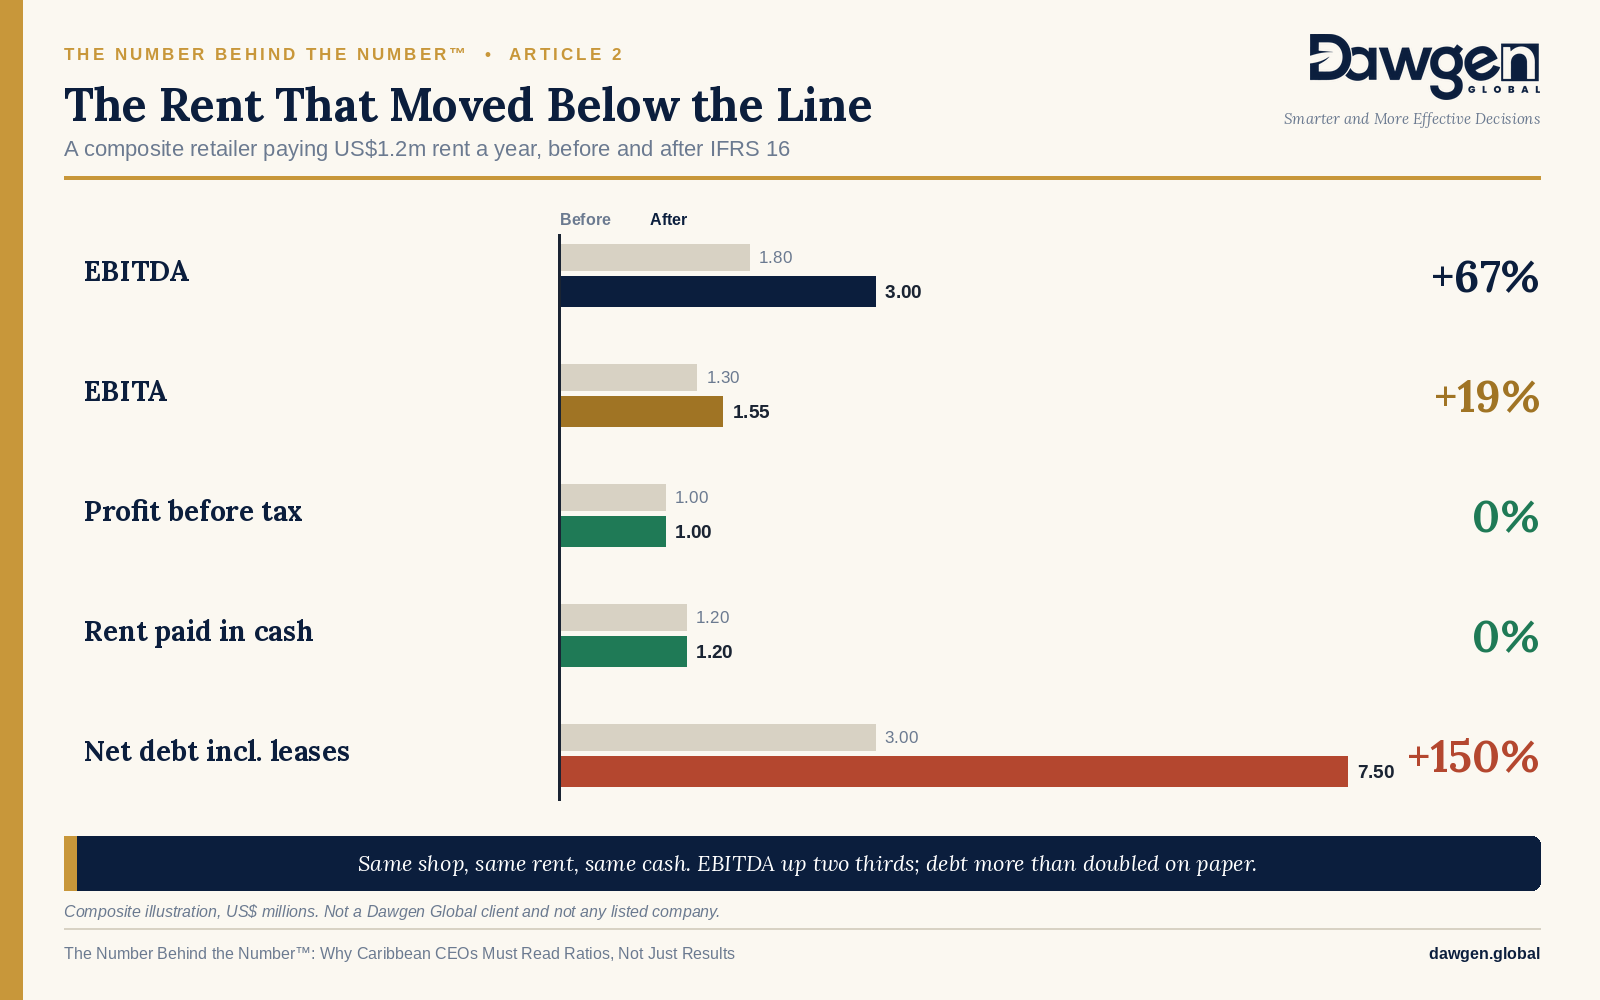
The retailer did nothing differently. Its EBITDA rose by two thirds, its EBITA by a fifth, its profit and cash not at all, and its reported debt more than doubled.
Why this matters to a chief executive
- Comparisons across 2019 are distorted. A trend chart of EBITDA that crosses the change in standard shows growth that did not happen.
- Owning and leasing now look alike on EBITDA. Before 2019, a hotel that leased its building reported lower EBITDA than an identical hotel that owned it. Now both report similar EBITDA, and the difference sits in depreciation and interest. EBITA and net debt show it; EBITDA does not.
- Your lender may use a different definition. Many facility agreements calculate covenants on a “frozen GAAP” or pre-IFRS 16 basis, adding the rent back as a cost. A chief executive who reads the reported EBITDA and assumes the covenant is comfortable may be reading the wrong number. The only way to know is to read the definition in the agreement.
- Not every business reports the same way. Many private companies in the region prepare their accounts under the IFRS for SMEs Accounting Standard, which has not adopted the IFRS 16 model; the International Accounting Standards Board decided to consider alignment only at a future review. Under that standard, operating lease rentals are generally still expensed before EBITDA. Two businesses in the same sector can therefore report EBITDA on different bases, and a buyer or lender comparing them must adjust one to match the other.
The lesson for the series is consistent. EBITDA is the more fragile of the two measures, because more of what drives it is a matter of presentation. EBITA, which keeps the cost of using assets in the calculation whether they are owned or leased, is the steadier guide.
SECTION 5
The Caribbean variant
The gap between EBITDA and EBITA exists everywhere. Six conditions make it wider, and more dangerous to ignore, in this region.
Economies built on capital-heavy sectors. Tourism, bauxite and alumina, energy, agro-processing, distribution and haulage account for a large share of regional private enterprise. These are the high-Wear-Ratio industries. A regional economy that measures its businesses mainly on EBITDA systematically overstates what those businesses can sustain.
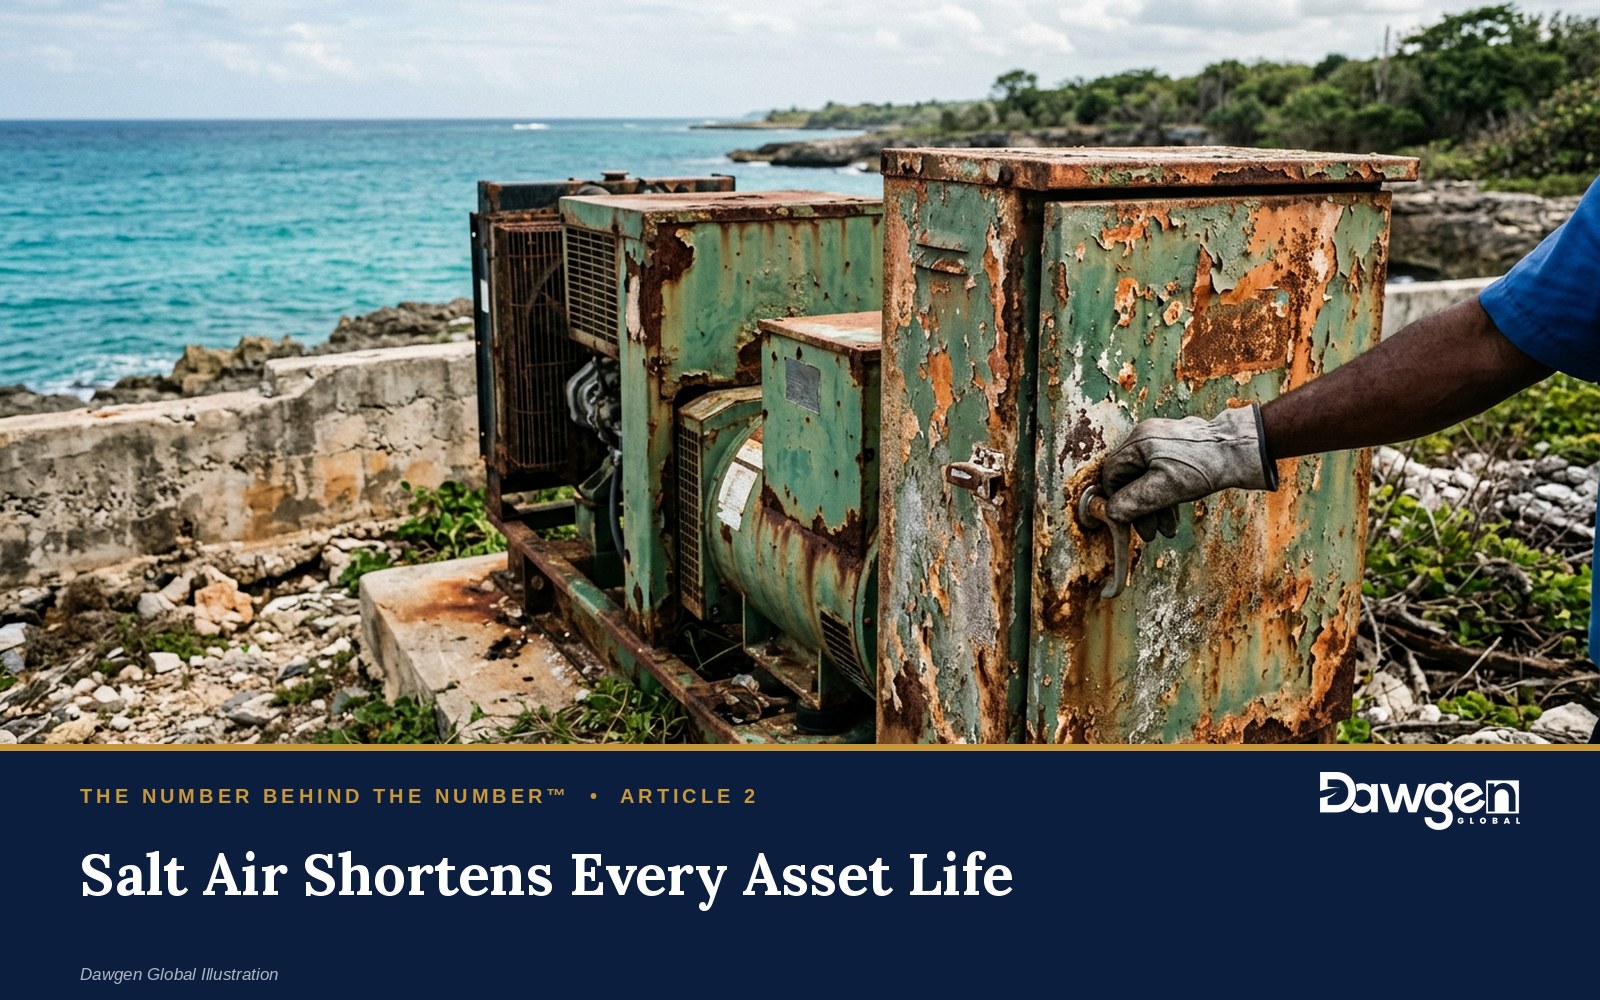
Salt air and sun shorten asset lives. Equipment near the coast corrodes faster, roofs and paintwork weather faster, and air-conditioning runs harder and longer. Useful lives copied from a manufacturer’s specification, or from a standard schedule built for a temperate climate, are often too long. The depreciation charge is then too low, and the shortfall arrives as an unplanned replacement.
Replacement is priced in foreign currency. Most plant, vehicles and equipment are imported and priced in US dollars. A business reporting in a local currency that has weakened since the asset was bought will pay far more, in local terms, to replace it than the depreciation charge suggests. The historical-cost gap described earlier is widest where the currency has moved most.
Storms and insurance. A named storm can bring forward years of replacement in a single night. Insurance covers some of it, often at values that have not kept pace with replacement cost, and deductibles are rising. A business that has not funded normal replacement has no cushion when an abnormal one arrives.
Property held in the family, leased to the company. Many regional businesses operate from land and buildings owned by the founder or a related company and leased to the operating business. Under IFRS 16, that lease is now on the operating company’s balance sheet, and its rent has moved below EBITDA. Whether the rent is set at a market level affects both measures, and a buyer or lender will want to know.
Two accounting frameworks side by side. Listed companies and larger groups report under full IFRS, including IFRS 16. Many private companies report under the IFRS for SMEs Accounting Standard, where lease rentals generally remain an operating expense. A lender comparing two borrowers in the same sector, or a buyer comparing two targets, may be comparing EBITDA figures built on different foundations.
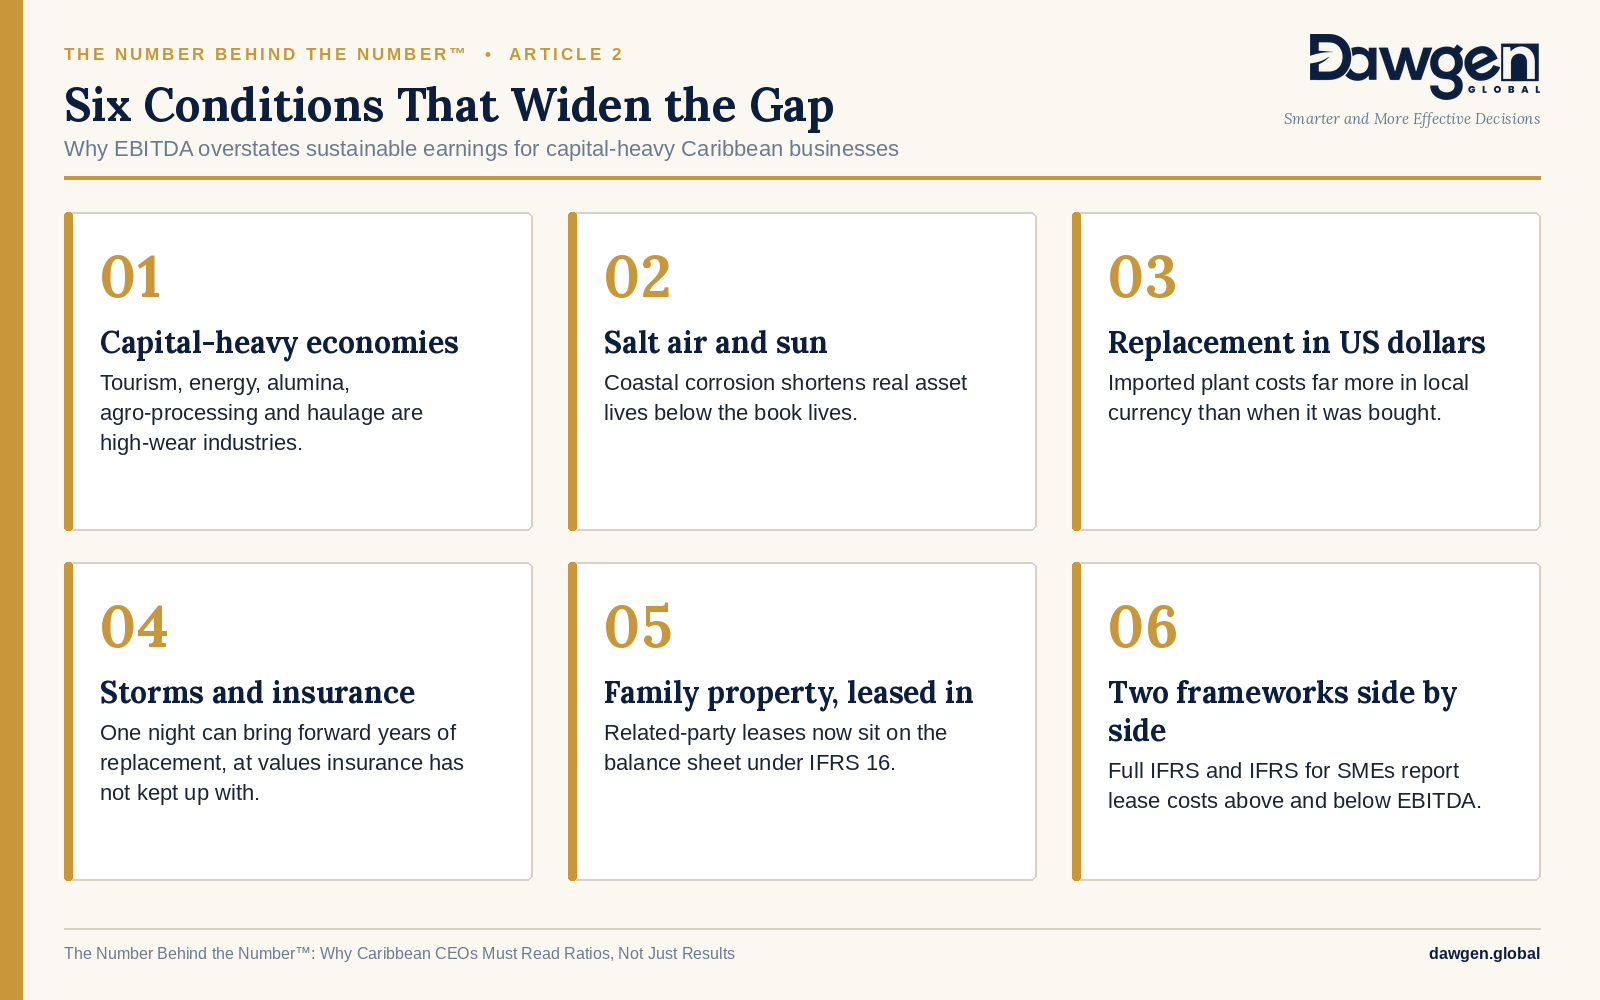
Together these conditions mean that, for a typical capital-heavy Caribbean business, reported EBITDA overstates sustainable earnings, and even reported EBITA may do so. The chief executive who knows the size of that gap has an advantage over every lender, buyer and competitor who does not.
SECTION 6
What it costs
Confusing EBITDA with sustainable earnings rarely causes trouble in the year it happens. The cost arrives later, and it arrives in four places. The figures are indicative, drawn from general practice rather than survey data.
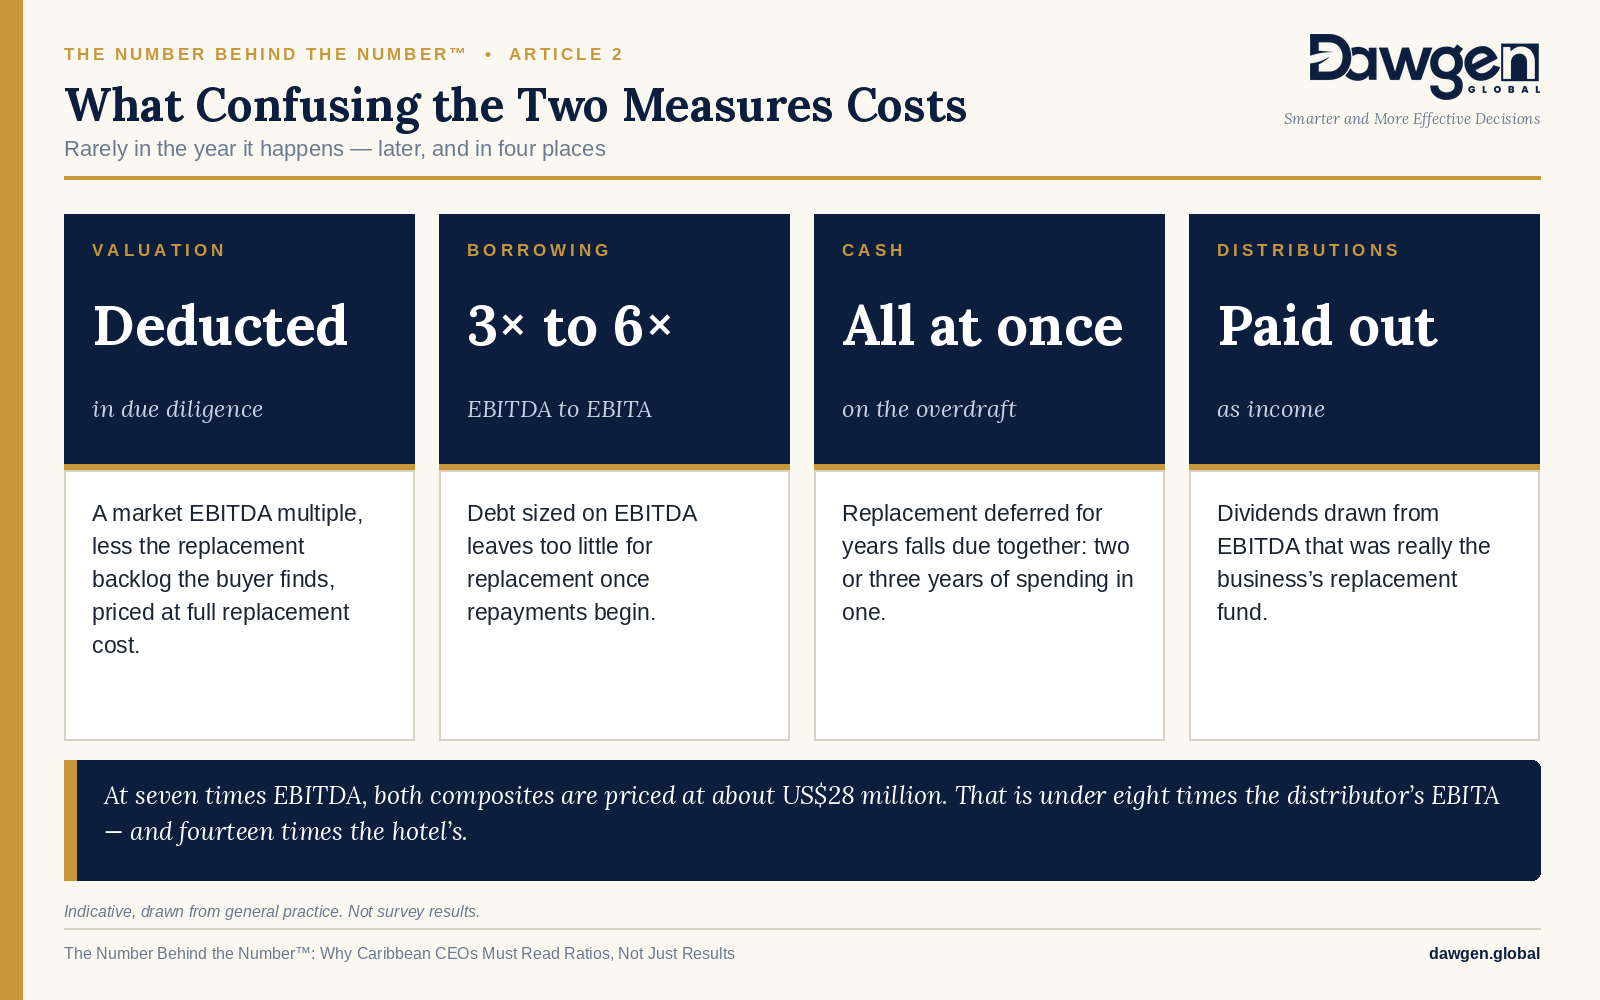
The valuation cost deserves a closer look. Suppose both businesses in the opening story were offered for sale at seven times EBITDA, a multiple the market might quote for either. Each would be priced at about US$28 million. For the distributor, that is under eight times its EBITA. For the hotel, it is fourteen times its EBITA, because half its EBITDA is needed to keep the building standing. An informed buyer will not pay the same multiple for both, and the hotel owner who expects to will be disappointed in the first week of due diligence.
The borrowing cost is the mirror image. A lender comfortable with three times EBITDA for both businesses is, in effect, lending the hotel six years of its post-depreciation earnings and the distributor just over three. If the hotel then defers replacement to meet its repayments, the lender’s security is wearing out while the loan is outstanding.
The least visible cost is the decision that feels prudent at the time. A board that sees EBITDA of four million approves a dividend of one million and a new restaurant of one and a half. Neither decision looks reckless. But if two million a year is already committed to standing still, and replacement spending has been running below that, the business has just spent money it had already used.
SECTION 7
Reading it properly: the Standing-Still Test
A chief executive does not need a valuation report to know whether the business is maintaining its assets or consuming them. Three numbers, calculated over the last three years, will answer the question.
- The Wear Ratio. Depreciation divided by EBITDA. It shows how much of operating earnings the accounts already set aside for wear.
- The Reinvestment Ratio. Spending on maintaining and replacing existing assets, divided by depreciation, averaged over three years. Growth spending, such as a new branch or an additional truck, is excluded. A ratio persistently below 1.0 means the business is replacing its assets more slowly than it is using them up.
- The Replacement Gap. The annual depreciation the business would charge if its assets were valued at today’s replacement cost over realistic lives, less the depreciation it actually charges. It measures how far the books understate the true cost of standing still.
From these comes one further figure, Sustainable EBITA: EBITDA less depreciation at replacement cost. It is the closest a set of accounts comes to what the business can earn, year after year, while keeping itself as it is.
| Sustainable EBITA = EBITDA − Depreciation at replacement cost |
Indicative readings
| Measure | Comfortable | Worth a conversation | Act now |
| Reinvestment Ratio (3-year average) | 1.0 or above | 0.8 to 1.0 | Below 0.8 |
| Replacement Gap as a share of book depreciation | Under 10% | 10% to 25% | Above 25% |
| Sustainable EBITA as a share of EBITDA | Close to reported EBITA | Well below reported EBITA | Under half of EBITDA in a business that is borrowing |
Indicative thresholds for discussion, not rules. The right level for any business depends on its assets, its sector and its plans.
The two composites, read properly
Return to the two businesses in the bank. The figures are three-year averages, in US$ millions.
| US$ millions | Resort hotel | Distributor |
| EBITDA | 4.00 | 4.00 |
| Book depreciation | (2.00) | (0.40) |
| EBITA | 2.00 | 3.60 |
| Depreciation at replacement cost | (2.60) | (0.50) |
| Sustainable EBITA | 1.40 | 3.50 |
| Maintenance and replacement spending | 1.40 | 0.45 |
| Net debt | 12.00 | 12.00 |
Composite illustration. Not a Dawgen Global client and not any listed company.
Now the three numbers, and what each measure of earnings does to the same debt.
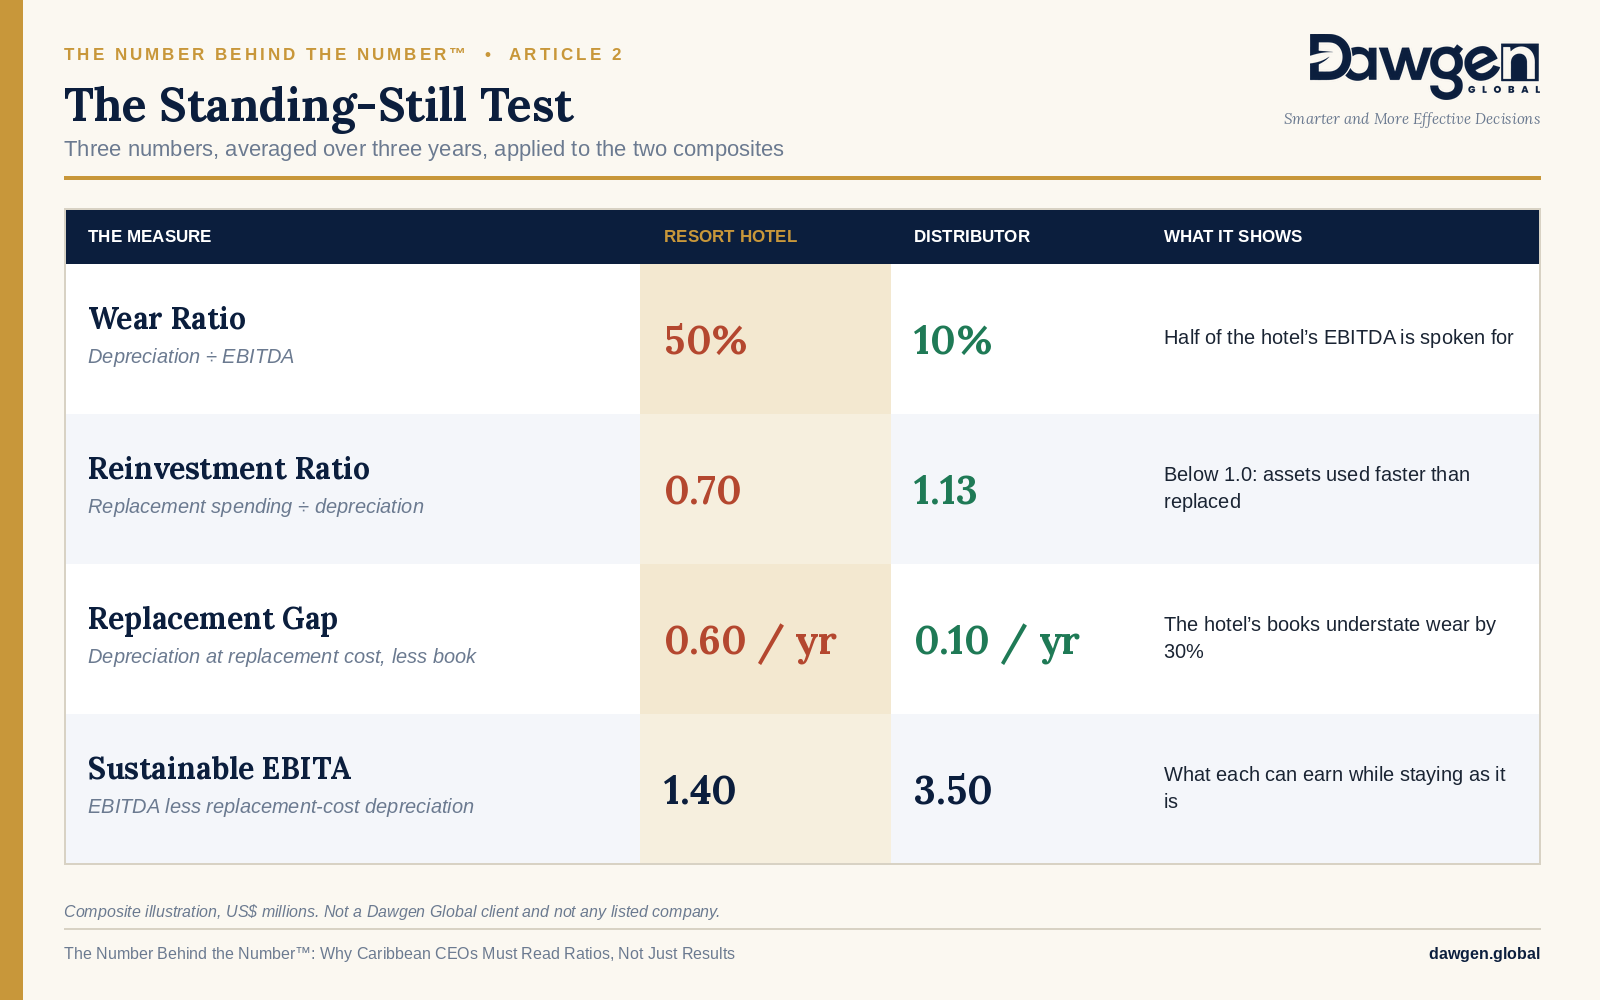
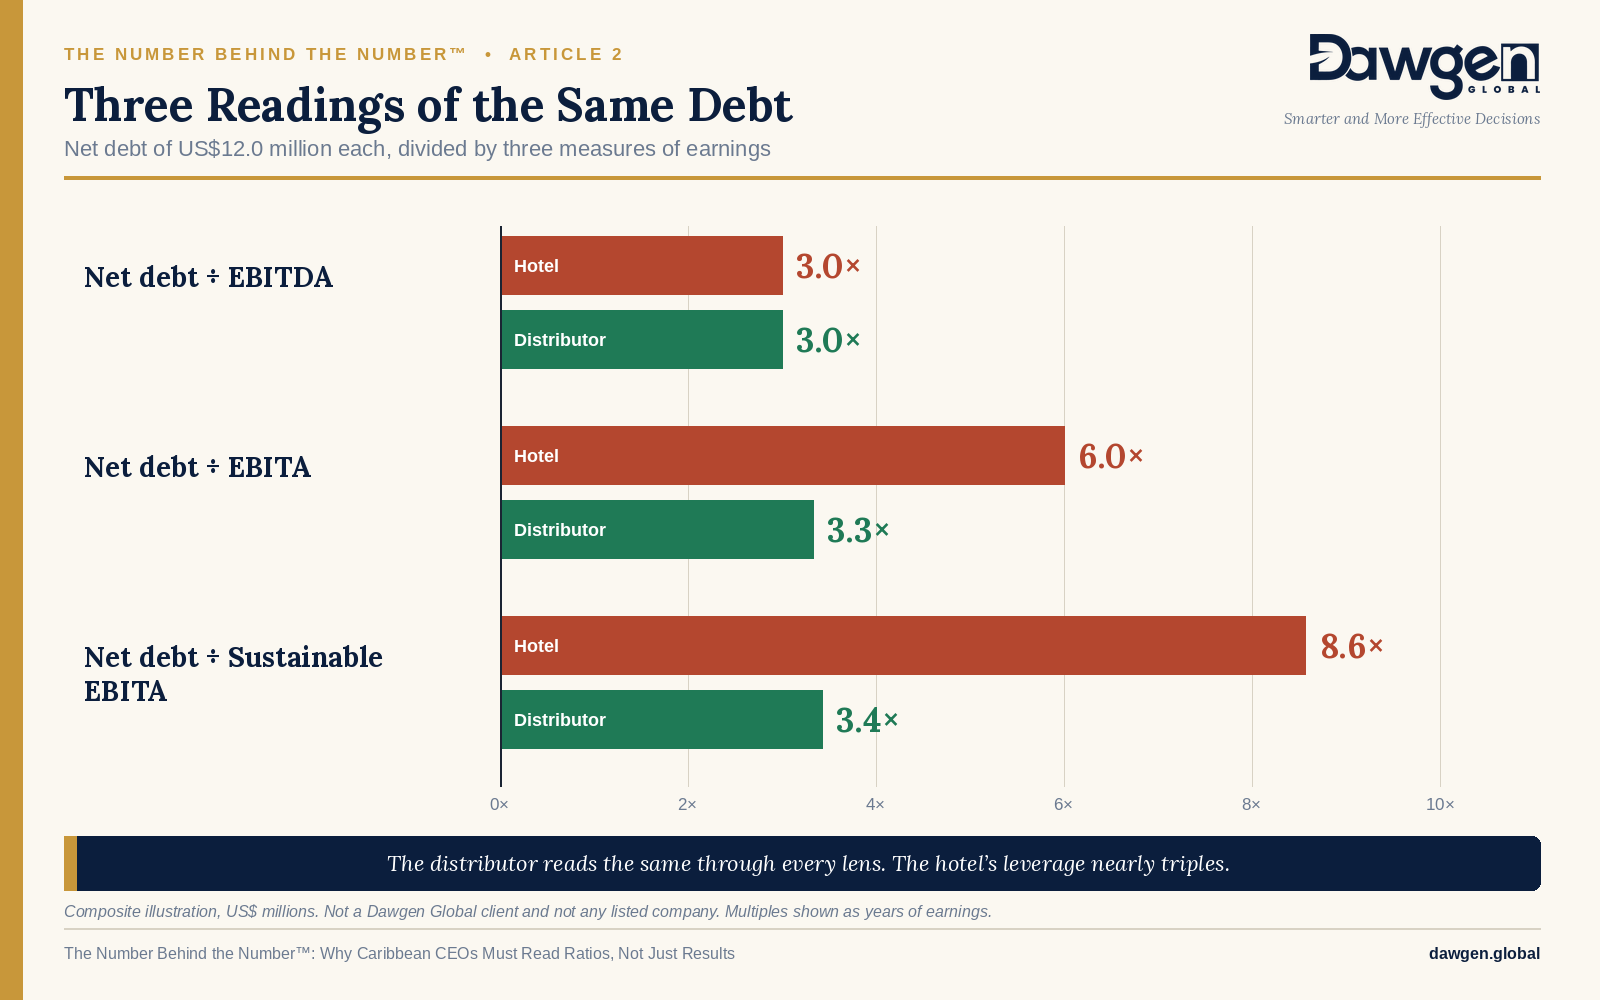
The distributor reads the same through every lens: three times, or a little more, whichever measure is used. Its EBITDA can be trusted because so little of it is spoken for.
The hotel reads differently at every step. On EBITDA it is as strong as the distributor. On EBITA its leverage doubles. On a replacement-cost basis it is close to nine times. And its Reinvestment Ratio of 0.70 shows why: for three years it has spent about seventy cents replacing assets for every dollar of wear the accounts record, and the accounts themselves understate the wear by almost a third. The gap has been funding the dividend and the debt service. It will eventually be paid, either by the owner in a planned programme or by a buyer who deducts it from the price.
What the hotel owner can do with this
None of this makes the hotel a bad business. It makes it a business that must be managed, financed and valued as what it is. With the three numbers in hand, the owner can:
- present the lender with a replacement plan alongside the EBITDA, which builds more confidence than the EBITDA alone;
- negotiate a facility with a tenor and repayment profile that leave room for replacement;
- set dividends from sustainable EBITA rather than EBITDA;
- and, when the time comes to sell, arrive with the replacement programme already under way, so the buyer has less to deduct.
SECTION 8
Where to start
Each of these steps can be taken with information the business already holds.
- Calculate your Wear Ratio for the last three years. Depreciation divided by EBITDA. If it is above a third, EBITA, not EBITDA, is the number to manage to.
- Separate maintenance spending from growth spending. Go through three years of capital spending and mark each item as replacing something the business already had, or adding something new. Divide the first total by depreciation to get your Reinvestment Ratio.
- Refresh the asset register at replacement cost. For the ten or twenty largest assets, ask what each would cost to replace today and how long it really lasts in your conditions. The difference from book depreciation is your Replacement Gap.
- Find out which EBITDA your lender uses. Read the covenant definitions in your facility agreement. Check whether they follow IFRS 16 or add rent back as a cost, and ask your finance lead to calculate the covenant exactly as the agreement defines it.
- Report both measures, and the lease effect, every month. Show EBITDA, EBITA and, where leases are material, EBITDA before IFRS 16, so that trends and comparisons are made on the same basis.
- Set dividends and capital plans from sustainable EBITA. Fund the replacement programme first, then decide what is available to distribute or invest in growth.
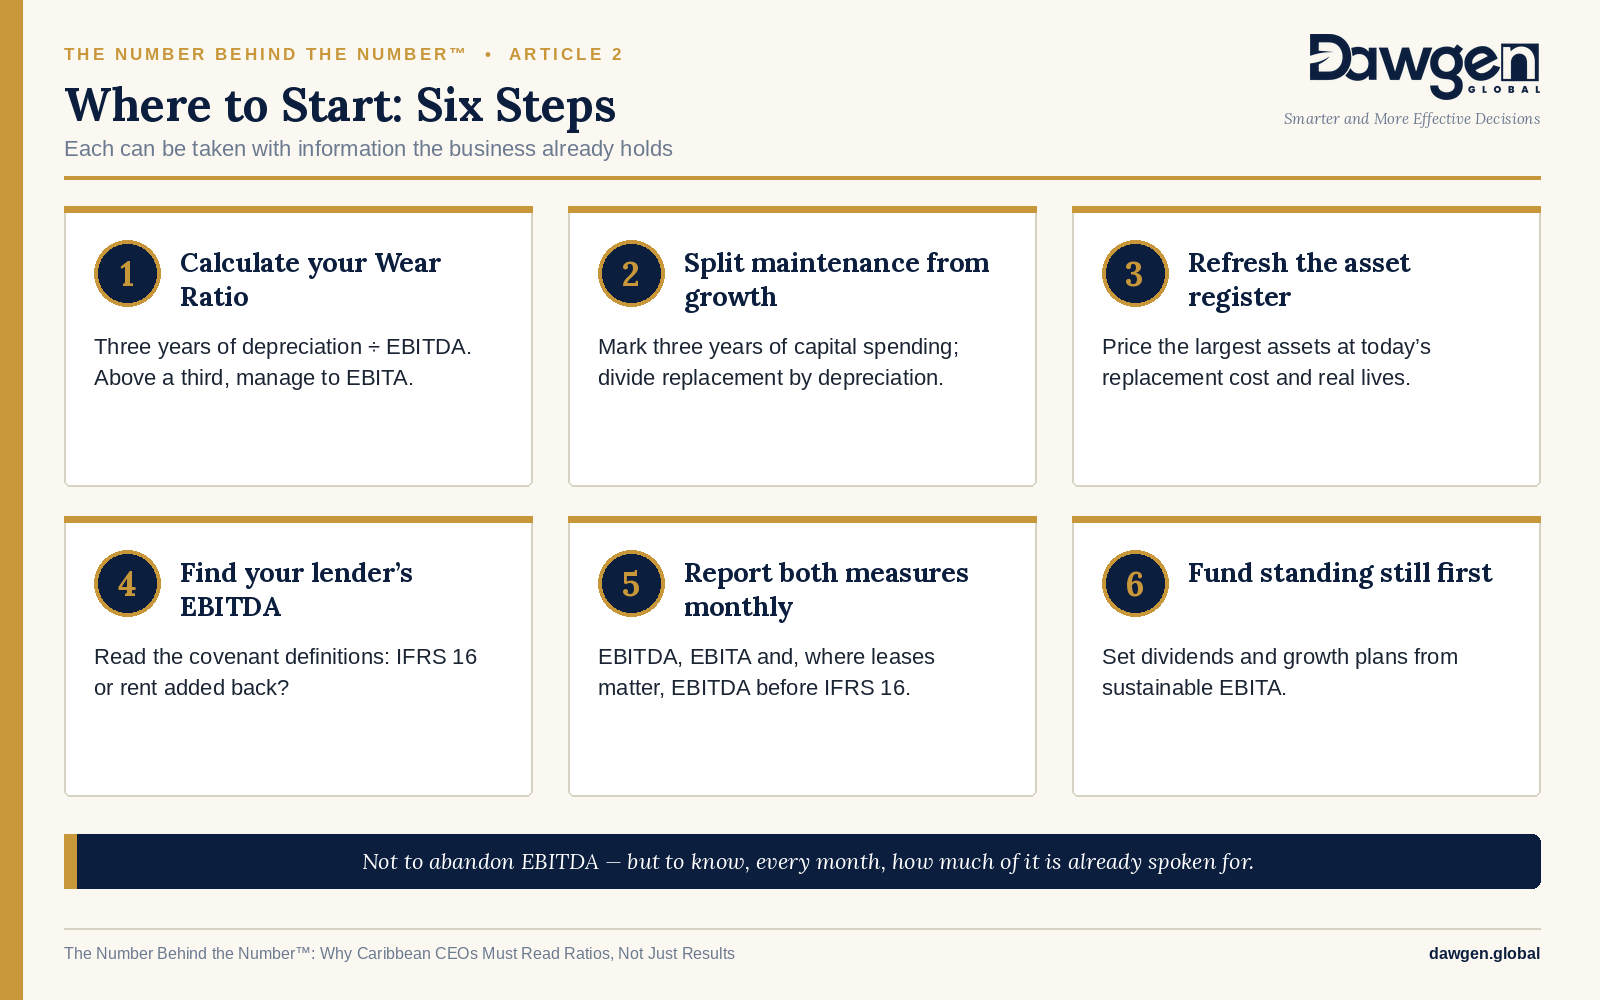
The aim is not to abandon EBITDA. The market will keep quoting it, and it remains the right lens for comparing operating efficiency and short-term debt capacity. The aim is to know, every month, how much of it is already spoken for.
What comes next in the series
Article 3, Adjusted Until It Flatters, turns to the quality of the earnings figure itself: the add-backs, one-off items, owner costs and related-party charges that stand between reported EBITDA and the number a lender or buyer will actually accept. Later articles take each lens in turn, from borrowing capacity and covenants to cash conversion, return on capital, tax and valuation, and the series closes with the CEO’s One-Page Ratio Dashboard.
| HOW DAWGEN GLOBAL HELPS
Dawgen Global works with chief executives and boards across more than fifteen Caribbean territories to put these numbers to work. ■ The Dawgen E·B·I·T·A Lens™ Ratio Health Check — a fixed-fee review that scores the business on all five lenses, including the Standing-Still Test. ■ Asset replacement and capital planning — a replacement-cost review of the asset register and a funded replacement programme, through our Business Advisory practice. ■ IFRS 16 and covenant review — reconciling reported EBITDA to the definitions in your facility agreements, through our financial reporting advisory and Corporate Finance teams. ■ Valuation and transaction readiness — preparing a capital-heavy business to be valued on its sustainable earnings, through our M&A practice. ■ The monthly Ratio Dashboard — EBITDA, EBITA and the Standing-Still Test reported every month through our Virtual CFO and Accounting BPO division. To see how your business reads through the E·B·I·T·A Lens™, or to request a Ratio Health Check, contact Dawgen Global. [email protected] | dawgen.global | (876) 926-5210 |
Download a copy of the article here: Article2_EBITDA_or_EBITA_The_Cost_of_Standing_Still (1)
The examples in this series are composites drawn from patterns observed across the region. They do not describe any client or any listed company. Figures described as indicative are illustrative ranges, not survey results.
About Dawgen Global
Dawgen Global is an independent, integrated multidisciplinary professional services firm headquartered at 47 Trinidad Terrace, New Kingston, Jamaica, serving more than 15 territories across the Caribbean. Founded and led by Dr. Dawkins Brown, Executive Chairman, the firm is independent and not affiliated with any international network. It delivers a full suite of professional services under one roof: audit and assurance; tax advisory; IT and digital transformation; risk management; cybersecurity; actuarial and insurance regulatory advisory; HR advisory; mergers and acquisitions; corporate recovery; business advisory and strategy; accounting BPO and virtual CFO services; and legal process outsourcing.
The proposition is simple: big-firm capability without the big-firm price. Dawgen Global’s integrated approach is built for the specific complexities and opportunities of the Caribbean market, helping organizations make sharper, better-informed decisions that drive measurable progress.
To explore a partnership, reach out:
- Website: dawgen.global
- Email: [email protected]
- WhatsApp (Global): +1 555-795-9071
- Caribbean offices: +1 876-665-5926 | +1 876-929-3670 | +1 876-926-5210