The Wealth That Hides in Plain Sight
There is a peculiar asymmetry in the way most organisations manage working capital. When liquidity is tight, every executive in the building knows it. The Treasurer is on the phone with the bank. The CFO is chairing daily cash-flow reviews. The board is asking pointed questions about covenant compliance. The entire organisation mobilises, and rightly so, because a liquidity crisis is an existential threat.
But when liquidity is abundant – when the cash is flowing, the buffers are full, and the PULSE Score sits comfortably in the Green Zone – almost nobody notices. The surplus is treated as a sign of health, a reassuring number on the balance sheet, something to feel good about before moving on to more pressing agenda items. No one asks the harder question: What is this surplus costing us? And what could it be earning?
This asymmetry represents one of the largest untapped value-creation opportunities in corporate finance. The organisations that master the transition from buffer mode to reprice mode – that know precisely when their surplus is a strategic weapon rather than idle capital – consistently outperform their peers on return on invested capital, margin expansion, and long-term shareholder value creation.
In the first five articles of this series, we built the diagnostic architecture: the PULSE layers, the Trigger Zone Matrix, the P-Layer’s predictive engine, the S-Layer’s ecosystem intelligence, and the governance model that wires it all together. This sixth article is the payoff. It is the playbook for the Green Zone – the detailed, quantified guide to turning surplus working capital into competitive advantage.
Every CFO knows how to manage a crisis. Far fewer know how to systematically capture margin when conditions are favourable. The Green Zone Playbook closes that gap.
Confirming the Green Zone: The Three Gates
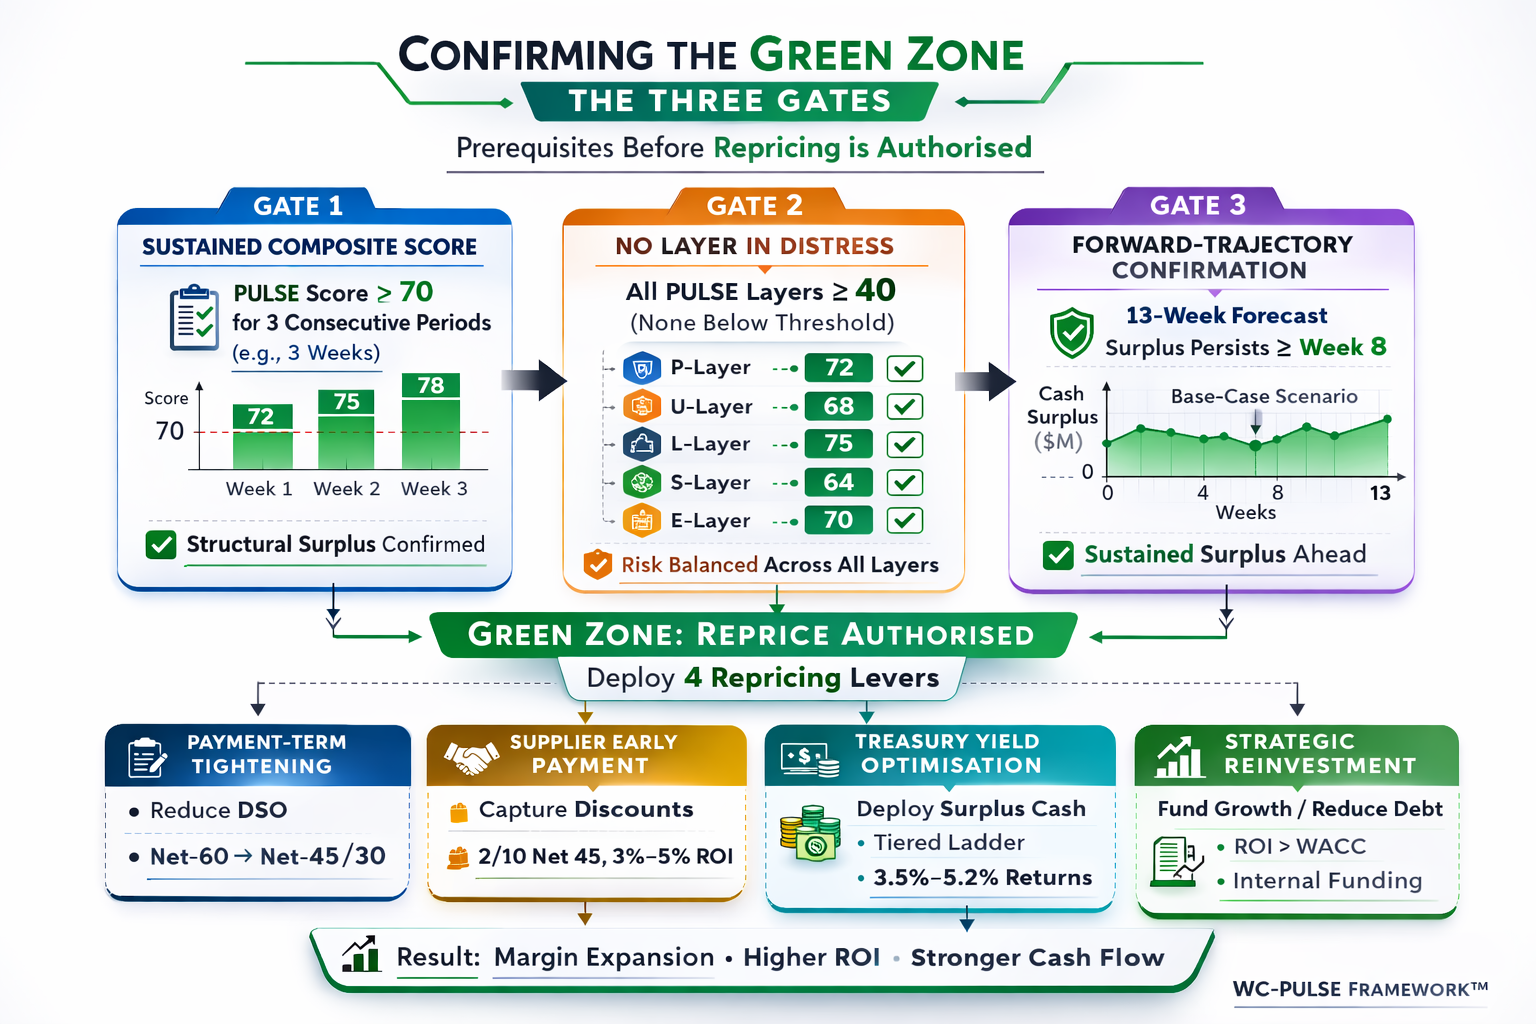
Before any repricing action is taken, the WC-PULSE Framework requires the organisation to pass through three confirmation gates. These gates exist because the most dangerous repricing mistake is premature repricing – releasing buffers or tightening terms based on a temporary surplus that reverses within weeks, leaving the organisation exposed.
Gate 1: Sustained Composite Score
The composite PULSE Score must exceed 70 for three consecutive measurement periods. A single reading above 70 is insufficient. Markets fluctuate, receivables can arrive in lumps, and one-off events can temporarily inflate cash balances. The three-period requirement filters out noise and confirms that the surplus is structural rather than transient. For most organisations operating on weekly PULSE cycles, this means three consecutive weeks of Green Zone classification.
Gate 2: No Layer in Distress
No individual PULSE layer may have a score below 40. This gate prevents the averaging problem that we identified in Article 1 as a fatal weakness of the Cash Conversion Cycle. A company can have a composite PULSE Score of 74 – comfortably Green – while its S-Layer sits at 35 because a key supplier is deteriorating. Without Gate 2, that company might tighten customer payment terms and accelerate supplier payments precisely when its supply-chain resilience is weakening. The no-layer-in-distress rule ensures that Green Zone confidence is genuine across all dimensions, not an artifact of strong performance in some layers masking weakness in others.
Gate 3: Forward-Trajectory Confirmation
The P-Layer’s 13-week forecast must confirm that the surplus is projected to persist under the base-case scenario through at least week eight. If the surplus is real today but the forecast shows it evaporating by week six due to a seasonal trough, a tax payment, or a known capex commitment, the organisation is not truly in the Green Zone – it is experiencing a temporary surplus within a fundamentally Amber trajectory. Gate 3 prevents organisations from spending cash today that they will need tomorrow.
Only when all three gates are cleared does the PULSE Dashboard signal Green Zone: Reprice Authorised. This triple-gate system is one of the most important safety mechanisms in the framework. It ensures that repricing actions are always grounded in confirmed, multi-dimensional, forward-looking evidence of genuine surplus.
The Four Repricing Levers
The Green Zone Protocol deploys four distinct repricing levers, each targeting a different source of margin. The most effective Green Zone operators deploy all four simultaneously, creating a compounding effect that maximises the total value captured from the surplus position.
Lever 1: Payment-Term Tightening
Payment-term tightening is the single highest-impact repricing lever for most organisations. It works by reducing the number of days between the delivery of goods or services and the receipt of payment, thereby releasing cash that was previously financing customer operations at zero return.
The mathematics are straightforward. For a company with US$120 million in annual revenue, each day of DSO represents approximately US$329,000 in receivables. Moving the standard payment terms from net-60 to net-45 – a 15-day reduction – releases approximately US$4.9 million in cash. At a weighted average cost of capital of 10 per cent, this released cash generates an annualised value of US$493,000. Move from net-60 to net-30, and the numbers double: US$9.9 million released, US$986,000 in annual value creation.
The objection that CFOs most frequently raise is customer resistance. The concern is legitimate but often overstated. In practice, payment-term tightening is most effective when it is segmented rather than universal. The WC-PULSE approach categorises customers into four tiers based on their payment behaviour, creditworthiness, strategic importance, and price sensitivity:
| Tier | Customer Profile | Repricing Strategy | Expected Capture |
| Tier 1 | Large, creditworthy, strategically critical. Strong payment history. High switching cost for both parties. | Negotiate 5–10 day term reduction in exchange for price stability guarantees, volume commitments, or preferential service levels. Position as partnership optimisation. | Moderate cash release, high relationship preservation. Target: 5–10 day DSO improvement. |
| Tier 2 | Mid-size, reliable payers, moderate strategic value. Payment within policy but no early-pay history. | Implement standard term tightening (e.g., net-60 to net-45) with 60–90 days advance notice. Offer early-pay discount (2/10 net 45) as an incentive. | Significant cash release with acceptable attrition risk. Target: 10–15 day DSO improvement. |
| Tier 3 | Small accounts, inconsistent payers, low strategic value. Often the tail of the receivables book. | Move to net-30 or cash-on-delivery. This segment generates disproportionate credit-management cost relative to revenue. Tighter terms improve both cash flow and operational efficiency. | High cash release per unit of effort. Acceptable attrition. Target: 15–30 day DSO improvement. |
| Tier 4 | Chronic late payers, deteriorating credit, disputed invoices. Currently dragging DSO upward. | Move to prepayment, letter-of-credit, or cash-before-delivery terms. If customer refuses, evaluate whether the account is profitable on a total-cost basis including the cost of capital consumed. | Cash release plus bad-debt risk reduction. Some revenue attrition expected and acceptable. Target: exit or reform the bottom 10% of the receivables book. |
The segmented approach ensures that repricing is surgically precise rather than blunt. Tier 1 customers experience a gentle conversation about partnership optimisation. Tier 4 accounts receive a firm restructuring of terms that protects the organisation’s cash flow and credit quality. The average DSO improvement across a well-executed tiered programme typically ranges from 8 to 18 days, depending on the starting position and customer-base composition.
Lever 2: Supplier Early-Payment Capture
The second lever reverses the direction of the cash flow and captures margin from the payables side. When the organisation has confirmed surplus liquidity, it can offer suppliers accelerated payment in exchange for a discount. This is one of the most attractive risk-adjusted returns available to any treasury function.
The standard early-payment proposition is 2/10 net 45: the buyer pays within 10 days instead of 45 and receives a 2 per cent discount on the invoice amount. The annualised return on this transaction is approximately 21 per cent – calculated as the 2 per cent discount earned over the 35 days of payment acceleration, extrapolated across 365 days. In a rate environment where the risk-free rate sits between 4 and 5 per cent and corporate lending rates range from 7 to 12 per cent, a 21 per cent annualised return on effectively zero-risk deployed capital is extraordinary.
The WC-PULSE Framework scales this lever through systematic deployment. Rather than offering early payment on an ad hoc basis, the framework identifies the full population of supplier invoices eligible for early-payment discount, ranks them by annualised return, and deploys available surplus in descending order of return until the surplus is fully utilised or the minimum buffer threshold is reached. This ensures that every dollar of surplus earns the highest available return before being allocated to lower-yielding alternatives.
For a company with US$80 million in annual procurement spend and a 40 per cent discount-eligible invoice population, a systematic early-payment programme can capture US$640,000 to US$960,000 in annual supplier discounts – a direct contribution to gross margin that flows straight to the bottom line.
Lever 3: Yield Optimisation on Surplus Cash
Not all surplus working capital can be deployed through term tightening or supplier discounts. The residual surplus – cash that is not needed for operations or strategic deployment within the next 90 days – should be earning a return. In the current rate environment, the opportunity cost of leaving this cash in non-interest-bearing current accounts is substantial.
The Green Zone Protocol prescribes a three-tier cash-deployment ladder:
- Tier A – Operational Float (0–30 days): Cash needed for day-to-day operations remains in the operating account or an overnight sweep arrangement. Target yield: the overnight rate, currently 4.5 to 5.0 per cent in most developed-currency jurisdictions. This tier captures yield on cash that was previously earning nothing, with zero incremental risk.
- Tier B – Tactical Reserve (30–90 days): Cash identified as surplus for the next one to three months is deployed in money-market funds, short-duration treasury instruments, or structured time deposits. Target yield: 15 to 30 basis points above the overnight rate. Liquidity is maintained through instruments that can be redeemed within 24 to 48 hours if conditions change and the PULSE Score deteriorates.
- Tier C – Strategic Surplus (90+ days): Cash confirmed as surplus by the P-Layer’s forward projections through at least week thirteen can be deployed in slightly longer-duration instruments – 3-month treasury bills, investment-grade commercial paper, or laddered certificates of deposit. Target yield: 30 to 60 basis points above Tier B. Duration is limited to ensure that the capital can be recalled within one PULSE measurement cycle if a zone transition occurs.
For an organisation with US$15 million in average surplus cash, moving from a non-interest-bearing operating account to a disciplined three-tier deployment ladder generates US$675,000 to US$825,000 in annual interest income. This is not a strategic transformation – it is a treasury hygiene improvement that the Green Zone Protocol makes systematic and automatic.
Lever 4: Strategic Reinvestment
The fourth and most consequential repricing lever does not capture margin from the existing business. It creates new margin by deploying surplus working capital into growth initiatives that would otherwise require external financing.
The strategic logic is compelling. When an organisation funds a growth initiative with internal working-capital surplus rather than debt, it avoids the interest cost, the arrangement fees, the covenant restrictions, and the management distraction of external financing. For a US$5 million investment funded internally rather than through a term loan at 8 per cent, the annual savings are US$400,000 in interest alone, plus the elimination of covenant restrictions that might constrain future operational flexibility.
The WC-PULSE Framework provides the confidence to make these investments. Without the framework, CFOs hesitate to deploy surplus cash into growth initiatives because they cannot be certain the surplus will persist. The risk of funding an acquisition or a product launch and then discovering two months later that the cash was needed for operations is paralysing. The PULSE Dashboard, with its three-gate confirmation process and its 13-week forward projections, resolves this uncertainty. When the system confirms Green Zone status with forward-trajectory persistence, the CFO has data-backed confidence that the surplus is available for strategic deployment.
The types of strategic reinvestment that the Green Zone Protocol supports include tuck-in acquisitions that expand market share or geographic reach, new product development and go-to-market investment, technology upgrades that improve operational efficiency and future working-capital performance, and accelerated debt paydown that permanently reduces the cost of capital. Each of these options is evaluated against the organisation’s strategic priorities and the expected return relative to the WACC, ensuring that surplus capital flows to its highest-value use.
The Compounding Effect: All Four Levers Together
The real power of the Green Zone Playbook emerges when all four levers are deployed simultaneously. Consider the aggregate impact for a mid-market enterprise with US$120 million in revenue, US$80 million in procurement spend, and US$15 million in average surplus cash:
| Repricing Lever | Mechanism | Annual Value Created |
| Payment-Term Tightening | 12-day average DSO reduction releasing US$3.9M at 10% WACC | US$395,000 |
| Supplier Early-Payment Capture | 2% discount on 40% of US$80M spend, accelerated from net-45 to net-10 | US$640,000 |
| Yield Optimisation | Three-tier deployment ladder on US$15M average surplus | US$750,000 |
| Strategic Reinvestment (Avoided Cost) | US$5M growth initiative funded internally vs. 8% term loan | US$400,000 |
| TOTAL ANNUAL VALUE CREATED | US$2,185,000 |
US$2.185 million in annual value creation. Not from restructuring. Not from headcount reduction. Not from a multi-year transformation programme. From the systematic, data-driven deployment of working capital that was already sitting on the balance sheet. This is the margin that hides in plain sight, visible only to organisations with a framework disciplined enough to find it and a governance structure coordinated enough to capture it.
The Green Zone is not a destination. It is a window of opportunity. The organisations that capture the most value are the ones that move fastest when the window opens – and pull back decisively when the data says it is closing.
Discipline in Abundance: Avoiding the Over-Confidence Trap
The Green Zone Playbook carries an important caveat: the greatest risk in the Green Zone is not inaction. It is overaction. The euphoria of surplus liquidity can lead to aggressive repricing that overshoots the sustainable position, leaving the organisation vulnerable when conditions inevitably shift.
The WC-PULSE Framework guards against over-confidence through three structural mechanisms. First, the three-gate confirmation process described above ensures that repricing only begins when the surplus is confirmed, multi-dimensional, and forward-looking. Second, the framework imposes a Green Zone Buffer Floor – a minimum working-capital reserve that is never deployed regardless of how strong the PULSE Score. This floor is calibrated during the implementation phase and typically represents 20 to 30 days of fixed operating costs. Third, the zone-transition intelligence described in Article 2 provides early warning when conditions are shifting from Green towards Amber, giving the CFO time to reverse repricing actions before the surplus erodes.
The discipline of the Green Zone is counterintuitive: it requires the CFO to be most conservative precisely when conditions feel most comfortable. The temptation to extend repricing actions beyond what the data supports – to keep tightening terms, to keep capturing discounts, to keep deploying cash into strategic initiatives – is powerful. The PULSE Dashboard resists this temptation by continuously recalculating the zone status and signalling the moment when the surplus begins to thin. Green Zone operators who respect these signals capture the most value over time, because they preserve the ability to return to the Green Zone in future cycles rather than depleting their position into the Amber or Red Zone.
Getting Started: The PULSE Margin Capture Analysis
The repricing opportunity in your organisation is quantifiable – and it is almost certainly larger than you think. Most CFOs who engage with the Green Zone Playbook for the first time discover that their organisation has been leaving US$1 million to US$5 million in annual value on the table, not because of poor management, but because no framework existed to systematically identify and capture it.
The Dawgen Global PULSE Margin Capture Analysis is a focused diagnostic engagement that quantifies your repricing opportunity across all four levers. In two weeks, our advisory team will assess your current payment-term structure and DSO improvement potential, model your supplier early-payment discount opportunity, evaluate your cash-deployment practices and yield improvement potential, and identify strategic reinvestment opportunities that the surplus could fund.
The output is a quantified Margin Capture Report with a prioritised action plan, expected financial impact by lever, and a recommended implementation sequence. Most clients discover that the value identified in the analysis exceeds the cost of the full PULSE implementation by a factor of five to ten.
IF YOU’RE SITTING ON SURPLUS WORKING CAPITAL,
YOU’RE LEAVING MARGIN ON THE TABLE.
Request a PULSE Margin Capture Analysis
We’ll quantify your repricing opportunity across all four levers – payment terms, supplier discounts, yield optimisation, and strategic reinvestment – and build your custom Green Zone Playbook with expected financial impact and implementation sequence.
Dawgen Global is a full-spectrum advisory firm delivering transformation across Strategy, Finance, Operations, Technology, and Governance. Our Working Capital Advisory practice is powered by the proprietary WC-PULSE Framework™, designed to convert working-capital management from a reactive function into a strategic capability that drives shareholder value. We serve mid-market and large enterprises across the Caribbean, North America, and international markets.
| Request Your Analysis: [email protected]
The WC-PULSE Thought Leadership Series
Article 1: “Your Cash Conversion Cycle Is Lying to You”
Article 2: “Buffer or Bleed: The US$2.4 Trillion Question Every CFO Gets Wrong”
Article 3: “The CFO’s 13-Week Crystal Ball”
Article 4: “Supplier Risk Is Working-Capital Risk”
Article 5: “From Treasury Silo to Strategic Nerve Centre”
Article 6: “The Reprice Playbook: How Top CFOs Turn Surplus Liquidity Into Margin” (You are here)
Coming Next – Article 7: “Interest Rates, FX Shocks, and Your Balance Sheet: Mastering the E-Layer” – How macro-economic forces reshape your working capital overnight, and the systematic approach to monitoring, hedging, and adapting through the PULSE E-Layer.
About Dawgen Global
“Embrace BIG FIRM capabilities without the big firm price at Dawgen Global, your committed partner in carving a pathway to continual progress in the vibrant Caribbean region. Our integrated, multidisciplinary approach is finely tuned to address the unique intricacies and lucrative prospects that the region has to offer. Offering a rich array of services, including audit, accounting, tax, IT, HR, risk management, and more, we facilitate smarter and more effective decisions that set the stage for unprecedented triumphs. Let’s collaborate and craft a future where every decision is a steppingstone to greater success. Reach out to explore a partnership that promises not just growth but a future beaming with opportunities and achievements.
 Email: [email protected]
  Visit: Dawgen Global Website

 WhatsApp Global Number : +1 555-795-9071
Caribbean Office: +1876-6655926 / 876-9293670/876-9265210  WhatsApp Global: +1 5557959071
USA Office: 855-354-2447
Join hands with Dawgen Global. Together, let’s venture into a future brimming with opportunities and achievements

