How to Reduce SKU, Process, and Policy Complexity Without Losing Customers
Executive Summary
Most organisations pursue cost reduction by negotiating harder, cutting headcount, or freezing budgets. Yet one of the biggest cost drivers is often invisible: complexity. Complexity hides in product variants, SKUs, pricing rules, approval steps, supplier sprawl, reporting requirements, and “special cases” that accumulate over time.
Complexity is expensive because it creates:
-
higher cost-to-serve per customer and per unit
-
more errors, rework, and exceptions
-
slower cycle times and more approvals
-
more inventory and obsolescence
-
more suppliers, contracts, and invoices
-
more IT systems and manual workarounds
In short: complexity increases cost while reducing speed and reliability. The good news is that complexity can be reduced without sacrificing customer value—if you approach it systematically.
This article explains:
-
why complexity grows (and why it is rarely measured)
-
the most common complexity traps in Caribbean and regional organisations
-
a practical “complexity audit” you can run quickly
-
a set of proven complexity reduction levers (SKU rationalisation, policy simplification, standardisation, modularisation)
-
how to apply the Dawgen V.A.L.U.E.-Chain Cost Advantage Framework™ to convert complexity reduction into validated “net” savings
What We Mean by “Complexity”
Complexity is not the same as sophistication. Complexity is the unnecessary variation that forces the organisation to work harder than customers value.
Complexity generally shows up in three forms:
1) Product and commercial complexity
-
too many SKUs and variants
-
customer-specific packaging or formulations
-
special pricing rules and discount exceptions
-
one-off promotions and bespoke service terms
-
fragmented customer segmentation and credit terms
2) Operational complexity
-
too many process steps and approvals
-
too many handoffs between departments
-
exceptions and rework loops
-
inconsistent standards across sites
-
frequent schedule changes and expediting
3) Organisational and governance complexity
-
overlapping roles and unclear decision rights
-
duplicated reporting
-
policy sprawl (too many rules, too many exceptions)
-
multiple systems doing the same job
-
vendor sprawl and contract inconsistency
Every additional “special case” adds cost. The organisation pays through labour, time, errors, working capital, and customer dissatisfaction.
Why Complexity Grows (Even in Well-Run Organisations)
Complexity grows because it is usually introduced for good reasons—then never removed.
Common drivers include:
“Yes culture” and customer accommodation
Teams add special variants to win deals. Over time, the business becomes a collection of exceptions.
Lack of SKU and process governance
No one owns the SKU portfolio end-to-end. Variants are created easily but rarely retired.
Weak data discipline
When data is inconsistent, teams build workarounds, spreadsheets, and extra checks to “stay safe.”
Poor decision rights
When accountability is unclear, approvals multiply. Each control layer is added to reduce risk, but it increases cost.
Technology patchwork
Instead of modernising systems, organisations bolt-on tools. Integration gaps create manual work and duplicated effort.
The Hidden Cost of Complexity Across the Value Chain
Complexity increases cost across the end-to-end value chain:
Source (procurement)
-
more suppliers, lower leverage
-
more contracts and terms to manage
-
more invoices and disputes
-
less standardisation and weaker compliance
Make / Operate (production and operations)
-
smaller batch sizes and changeovers
-
more planning variability
-
more quality issues due to inconsistent inputs
-
more downtime and scheduling instability
Deliver (logistics and service)
-
more picking, packing, and errors
-
more delivery exceptions
-
higher returns and rework
-
more customer service calls and credits
Sell (commercial)
-
discount leakage
-
complex pricing disputes
-
slow quoting and onboarding
-
more credit exceptions and collections effort
SG&A (support functions)
-
more approvals
-
more reporting
-
tool sprawl and manual reconciliations
-
vendor and policy sprawl
Complexity is “death by a thousand cuts.”
The Complexity Profit Equation
A simple way to think about it:
Profit = (Revenue × Realised Margin) – (Cost-to-Serve + Cost-of-Complexity)
Most organisations track revenue and direct costs. Fewer track cost-to-serve. Almost none track “cost-of-complexity.”
But cost-of-complexity is real—and it compounds over time.
The Seven Complexity Traps That Inflate Cost
Trap 1: SKU proliferation without portfolio discipline
Signal: many low-volume SKUs; high inventory; frequent obsolescence write-offs.
Trap 2: Customer-specific exceptions become the norm
Signal: “special terms” for many customers; high order handling cost.
Trap 3: Policy sprawl and exception-heavy approvals
Signal: excessive approvals; frequent overrides; slow cycle times.
Trap 4: Too many suppliers for similar categories
Signal: vendor sprawl and inconsistent terms; low procurement leverage.
Trap 5: Tool sprawl and fragmented systems
Signal: multiple systems for similar work; heavy spreadsheet dependence.
Trap 6: Over-reporting and meeting overload
Signal: teams produce reports “just in case” with minimal decision impact.
Trap 7: One-off fixes instead of root-cause redesign
Signal: recurring firefighting; the same issues keep returning.
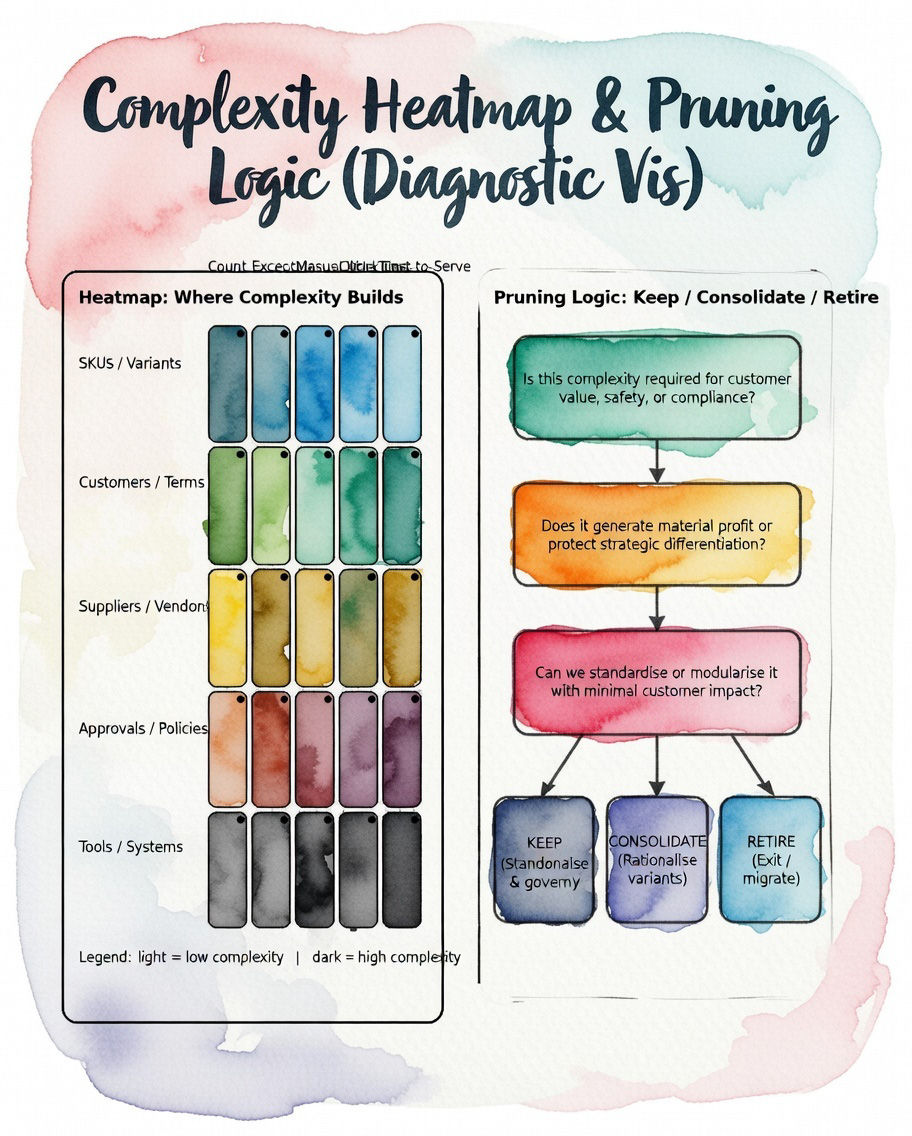
The Complexity Audit: A Practical Diagnostic You Can Run
Here’s a quick diagnostic approach that works well:
Step 1: Identify complexity hotspots
-
Top 20% of SKUs by count (not revenue)
-
Top customers driving service exceptions
-
Functions with the most approvals, handoffs, and rework
-
Categories with the most suppliers and lowest spend per supplier
-
Reports and meetings with unclear decisions/output
Step 2: Quantify “complexity load”
Metrics you can calculate quickly:
-
% of SKUs generating <1% of revenue each
-
inventory turns by SKU class
-
number of suppliers per category
-
number of approvals per transaction type
-
number of systems used per process
-
cycle time for core workflows (quote-to-cash, procure-to-pay)
Step 3: Group complexity into “must-have” vs “nice-to-have”
-
must-have complexity: regulatory, safety, core customer value
-
nice-to-have complexity: “legacy decisions” and unmanaged exceptions
Step 4: Create a Complexity Reduction Portfolio
This becomes a structured opportunity pipeline—not random trimming.
High-Impact Complexity Reduction Levers
1) SKU rationalisation (simplify the portfolio)
Approaches:
-
discontinue low-value variants
-
consolidate similar SKUs
-
standardise packaging sizes
-
migrate customers to preferred variants
-
implement SKU governance (create/retire rules)
Value: lower inventory, fewer changeovers, fewer errors.
2) Standardisation and modularisation
-
build products/services using modular options
-
standardise internal “golden processes”
-
reduce site-to-site variations
Value: lower process cost, improved quality.
3) Policy simplification and decision-rights redesign
-
remove redundant approvals
-
clarify decision rights
-
simplify thresholds and rules
Value: faster cycles, lower admin cost, better accountability.
4) Supplier and vendor consolidation
-
reduce supplier sprawl
-
standardise contracts and terms
-
improve compliance through preferred supplier lists
Value: better leverage, lower admin cost, improved reliability.
5) System and tool rationalisation
-
eliminate overlapping subscriptions
-
standardise workflows
-
automate routine work
Value: lower SG&A cost and fewer workarounds.
Quick Wins vs Structural Reshape for Complexity
Quick Wins (0–90 days)
-
freeze new SKUs and new vendors pending governance review
-
eliminate unused software subscriptions
-
remove redundant reports and reset meeting cadence
-
tighten exceptions and enforce standards for ordering and approvals
-
identify “top 25 complexity culprits” (SKUs/customers/suppliers)
Structural Reshape (3–18 months)
-
SKU governance and portfolio redesign
-
operating model simplification (shared services, standard processes)
-
technology rationalisation and workflow automation
-
supplier consolidation and standard contracting
-
pricing and discount policy redesign
Sustained Advantage (18+ months)
-
continuous complexity management
-
periodic portfolio pruning
-
governance that prevents re-complexification
How V.A.L.U.E.™ Drives Complexity Reduction That Sticks
V — Validate the Profitability Challenge
Quantify complexity load and how it hits:
-
margin leakage
-
cost-to-serve
-
working capital
-
service performance
A — Analyse the Value Chain and Cost-to-Serve
Map how complexity creates cost across:
-
procurement, operations, logistics, commercial, SG&A
L — Locate Levers and Build Opportunity Portfolio
Build structured initiatives:
-
SKU rationalisation
-
supplier consolidation
-
policy simplification
-
process redesign and automation
U — Uplift & Prioritise
Prioritise based on:
-
savings potential
-
implementation effort
-
risk to customer value
-
speed to capture
E — Execute with Governance and Controls
Use clear cadence and tracking:
-
initiative owners
-
decision rights
-
benefits validation
-
controls to prevent reversal
™ — Transform for Sustainability
Hardwire:
-
SKU governance
-
policy discipline
-
standard processes
-
continuous improvement
Reduce Complexity, Raise Profitability, Improve Speed
Complexity is one of the most controllable profit levers because it sits inside decisions you can change: portfolio choices, policies, processes, and governance.
The organisations that win will not be those that simply “cut budgets.” They will be those that simplify their business model and convert complexity reduction into sustainable cost advantage.
Next Step!
Want to identify the complexity cost hiding in your value chain and turn it into sustainable savings?
Email [email protected] with the subject line “V.A.L.U.E. – Complexity Audit” to request an initial discussion and our data intake checklist.
WhatsApp Global: +1 555 795 9071 | Contact form: https://www.dawgen.global/contact-us/
About Dawgen Global
“Embrace BIG FIRM capabilities without the big firm price at Dawgen Global, your committed partner in carving a pathway to continual progress in the vibrant Caribbean region. Our integrated, multidisciplinary approach is finely tuned to address the unique intricacies and lucrative prospects that the region has to offer. Offering a rich array of services, including audit, accounting, tax, IT, HR, risk management, and more, we facilitate smarter and more effective decisions that set the stage for unprecedented triumphs. Let’s collaborate and craft a future where every decision is a steppingstone to greater success. Reach out to explore a partnership that promises not just growth but a future beaming with opportunities and achievements.
 Email: [email protected]
  Visit: Dawgen Global Website

 WhatsApp Global Number : +1 555-795-9071
Caribbean Office: +1876-6655926 / 876-9293670/876-9265210  WhatsApp Global: +1 5557959071
USA Office: 855-354-2447
Join hands with Dawgen Global. Together, let’s venture into a future brimming with opportunities and achievements

