How to Stress-Test Your Ecosystem Before It Stress-Tests You
The Invisible Chain
On a Tuesday morning in March 2024, the Chief Financial Officer of a Caribbean food-and-beverage manufacturer opened his inbox to find a message from his procurement director. The company’s second-largest packaging supplier – a firm that provided the specialised labelling and shrink-wrap materials for 40 per cent of the finished-goods line – had filed for creditor protection overnight. Operations would receive no shipments for at least six weeks while the supplier’s assets were restructured.
Within 72 hours, the working-capital consequences began cascading. Production lines dependent on that supplier’s materials slowed and then stopped. Finished-goods inventory that could not be completed sat on warehouse floors, consuming space, insurance, and carrying cost but generating no revenue. Customers who had placed orders began receiving delay notifications, and three of them – including the company’s largest retail chain account – invoked penalty clauses in their supply agreements. Emergency procurement of substitute materials from an alternative supplier required prepayment at a 22 per cent premium to the contracted price.
In total, the working-capital impact of a single supplier failure amounted to US$6.3 million over the ensuing quarter: US$1.8 million in stranded inventory carrying costs, US$2.1 million in lost revenue from unfulfilled orders, US$1.6 million in premium procurement costs, and US$800,000 in customer penalty payments. The company’s Cash Conversion Cycle, which had been a respectable 41 days, ballooned to 78 days before stabilising. The composite PULSE Score, had it been in place, would have plummeted from a comfortable Amber Zone to deep Red.
None of this was visible in the company’s financial metrics before the event occurred. The current ratio was healthy. The CCC was below the industry median. The 13-week cash-flow forecast showed no stress. Every internal indicator was green – because every internal indicator was blind to the health of the ecosystem on which the company depended.
Your balance sheet ends at your company’s legal boundary. Your working-capital risk does not.
The Ecosystem Blind Spot: Why Traditional Metrics Fail
In Article 1 of this series, we identified the supplier-ecosystem blind spot as the fifth critical weakness of the Cash Conversion Cycle. In this article, we examine that blind spot in detail and introduce the S-Layer of the WC-PULSE Framework™ – the diagnostic layer that monitors the health, behaviour, and risk profile of the counterparties whose actions directly determine whether your working capital operates smoothly or seizes up without warning.
The fundamental problem is one of boundaries. Traditional working-capital metrics – DSO, DIO, DPO, the current ratio, the CCC – measure what is happening inside your organisation. They monitor your receivables, your inventory, your payables. But working capital is an ecosystem phenomenon. Your cash does not flow in a closed loop within your own walls. It flows through a network of customers, suppliers, logistics providers, financial intermediaries, and regulators. A disruption at any node in that network can propagate through the system and arrive at your balance sheet with devastating speed.
The past five years have made this reality impossible to ignore. Global supply-chain disruptions, pandemic-induced shutdowns, geopolitical sanctions, shipping bottlenecks, commodity-price whiplash, and the cascading failures of financial intermediaries have demonstrated, repeatedly and painfully, that counterparty risk is working-capital risk. Yet the vast majority of organisations continue to monitor their working capital as though it existed in isolation.
Three Dimensions of Ecosystem Risk
The S-Layer of the WC-PULSE Framework monitors ecosystem risk across three distinct dimensions, each of which can independently trigger zone transitions in the Trigger Zone Matrix:
- Counterparty Financial Health: Are your key suppliers and customers financially stable? A supplier approaching insolvency will begin exhibiting warning signs – delayed deliveries, quality deterioration, requests for early payment, changes in ownership – long before the formal filing that triggers the crisis. A customer under cash-flow pressure will stretch payment terms gradually, often by just a few days per quarter, in a pattern that is invisible to average DSO calculations but clearly visible to the S-Layer’s behavioural monitoring.
- Concentration Risk: How dependent are you on a small number of counterparties? This is the most dangerous and most commonly ignored dimension of ecosystem risk. An organisation that sources 50 per cent of its critical materials from a single supplier has a fundamentally different risk profile from one that sources the same materials across five qualified suppliers. Yet the CCC, the current ratio, and the 13-week forecast treat both organisations identically.
- Behavioural Trend Analysis: Are your counterparties’ behaviours changing? This is the dimension that converts the S-Layer from a static risk assessment into a dynamic early-warning system. It does not merely measure current DSO and DPO. It tracks the trajectory of payment behaviour over time, customer by customer and supplier by supplier, looking for the drift patterns that signal emerging stress.
The S-Layer Metrics Toolkit
The S-Layer generates its 0–100 score using a composite of six proprietary metrics, each designed to capture a specific dimension of ecosystem risk that traditional working-capital analysis ignores.
| Metric | What It Measures | Why It Matters |
| Supplier Concentration Index (SCI) | The proportion of critical inputs sourced from your top 3, top 5, and top 10 suppliers. Expressed as a Herfindahl-style index where higher values indicate greater concentration. | A high SCI means a single supplier failure can halt operations. The S-Layer applies penalty weightings when SCI exceeds industry-calibrated thresholds, directly depressing the composite PULSE Score. |
| Customer Concentration Index (CCI) | The proportion of revenue derived from your top 3, top 5, and top 10 customers. Mirrors the SCI methodology applied to the receivables side. | A high CCI means a single customer default or payment delay can drain liquidity. Combined with the P-Layer’s payment-behaviour models, the CCI quantifies the magnitude of receivables concentration risk. |
| Ageing Waterfall Velocity (AWV) | The speed at which receivables migrate through ageing buckets (current → 30 days → 60 days → 90+ days). Measured as a weekly flow rate rather than a static snapshot. | A rising AWV signals that receivables are ageing faster than they are being collected – a leading indicator of customer-base deterioration that average DSO calculations mask. |
| Supplier Payment Drift Index (SPDI) | The change in your suppliers’ behaviour towards you: are they tightening terms, requesting early payment, reducing credit limits, or altering delivery schedules? | Suppliers tighten terms when they perceive elevated risk – either in your organisation or in their own. A rising SPDI can signal both external ecosystem stress and reputational risk that your internal metrics cannot see. |
| Counterparty Credit Composite (CCC*) | A weighted credit-health score for your top counterparties, incorporating public credit ratings, payment-bureau data, financial-statement analysis, and news-sentiment indicators where available. | The CCC* provides the earliest possible warning of counterparty distress. A downgrade in a top-5 supplier’s credit score triggers an automatic S-Layer reassessment and, if significant, a zone-transition evaluation. |
| Ecosystem Resilience Score (ERS) | A composite measure of how quickly your organisation could recover from the loss of any single counterparty. Factors in alternative supplier qualification, inventory buffer days for critical inputs, and contractual protections. | The ERS answers the question the board should be asking: “If our top supplier disappeared tomorrow, how many days until we are back to full operations?” A low ERS combined with a high SCI is the highest-risk configuration in the S-Layer. |
These six metrics are not monitored in isolation. The S-Layer’s scoring algorithm examines the interactions between them. A high Supplier Concentration Index is concerning. A high SCI combined with a deteriorating Counterparty Credit Composite and a low Ecosystem Resilience Score is a compounding risk that exponentially increases the probability of a working-capital disruption. The S-Layer’s interaction-weighting model captures these compound effects in ways that individual metric monitoring cannot.
Building the Early-Warning System
The S-Layer’s six metrics generate a continuous stream of data. The framework converts that data into actionable intelligence through a structured early-warning architecture that monitors three signal categories:
Category 1: Slow-Burn Signals
These are gradual deterioration patterns that unfold over weeks or months and are invisible to anyone monitoring averages rather than trends. The most important slow-burn signals include a customer’s payment period extending by two to three days per quarter over consecutive quarters – a pattern that adds 8 to 12 days to the effective DSO within a year without ever triggering an exception in a traditional ageing report. Another critical slow-burn signal is a supplier gradually reducing the credit limit they extend to your organisation, a behaviour that often precedes a formal terms renegotiation or, in more severe cases, a demand for prepayment.
The S-Layer tracks these slow-burn signals using rolling trend analysis with configurable sensitivity thresholds. When the Ageing Waterfall Velocity for a specific customer exceeds its 12-month trailing average by more than 15 per cent for four consecutive weeks, the system generates an Amber Alert and flags the customer for enhanced monitoring and proactive engagement.
Category 2: Acute-Event Signals
These are sudden, high-impact events that demand immediate response: a supplier filing for insolvency, a major customer announcing a strategic restructuring, a credit-rating downgrade of a top-five counterparty, or a logistics provider experiencing a force-majeure disruption. The S-Layer monitors external data feeds – credit-bureau alerts, news-sentiment analysis, and regulatory filings – to detect these events as close to real time as the data ecosystem permits.
Acute-event signals bypass the normal scoring process and trigger an Emergency Red Override in the Trigger Zone Matrix, as described in Article 2. When a top-three supplier or top-three customer experiences a qualifying acute event, the system immediately initiates Red Zone protocols regardless of the composite PULSE Score, because the potential working-capital impact of a major counterparty failure is severe enough to override aggregate health indicators.
Category 3: Systemic-Stress Signals
The most sophisticated and most valuable signal category is systemic stress – patterns that indicate the entire ecosystem, rather than a single counterparty, is coming under pressure. These signals are generated by monitoring aggregate trends across the full supplier and customer base: a simultaneous extension of payment terms by multiple customers, a cluster of suppliers requesting early payment within the same period, or a deterioration in the average Counterparty Credit Composite across the portfolio.
Systemic-stress signals are the hardest to detect because no single counterparty is exhibiting crisis-level behaviour. The stress is diffuse, distributed, and only visible when viewed at the portfolio level. The S-Layer’s portfolio-monitoring algorithms are designed specifically to detect this pattern, because systemic ecosystem stress is the precursor to the most damaging working-capital crises – the ones where multiple problems arrive simultaneously and overwhelm the organisation’s ability to respond.
The supplier who files for insolvency is not your biggest risk. The five suppliers who are all quietly deteriorating at the same time are.
Stress-Testing Your Ecosystem: A Practical Protocol
Beyond continuous monitoring, the S-Layer prescribes periodic stress-testing of the supplier and receivables ecosystem. Dawgen Global recommends quarterly ecosystem stress tests for all organisations and monthly tests for those operating in the Amber Zone or with elevated concentration indices. The stress test follows a structured five-step protocol:
- Identify critical dependencies: Map every supplier and customer that accounts for more than 5 per cent of your procurement spend or revenue respectively. For each, document the switching cost (financial and operational), the qualification timeline for an alternative, and the inventory buffer available for the relevant input or output. This map is the foundation of your ecosystem risk architecture.
- Simulate single-point failures: For each critical counterparty identified in Step 1, model the working-capital impact of their sudden unavailability for 30, 60, and 90 days. Quantify the impact on inventory carrying costs, production throughput, revenue realisation, and cash flow. Feed these scenarios into the P-Layer’s 13-week forecast to see how each failure affects the projected cash position and the composite PULSE Score.
- Simulate correlated failures: This is the step that most organisations skip and that matters most. Model the impact of two or more critical counterparties failing simultaneously or within a short window. In practice, correlated failures are far more common than independent ones, because counterparties within the same industry or geography are subject to the same macro stresses. A commodity-price shock, a currency depreciation, or a regulatory change can weaken multiple suppliers concurrently.
- Calculate the Ecosystem Buffer Requirement: Based on the stress-test results, determine the additional working-capital buffer needed to survive the worst plausible correlated failure scenario. This Ecosystem Buffer is additive to the base buffer calculated from the PULSE composite score. It represents the insurance premium for counterparty risk and should be explicitly sized, funded, and governed as a distinct component of the total working-capital reserve.
- Design contingency protocols: For each critical counterparty, establish a pre-approved contingency plan that can be activated within 48 hours of a disruption. This includes pre-qualified alternative suppliers, pre-negotiated emergency pricing, inventory pre-positioning for critical inputs, and customer-communication templates. The goal is to reduce the response time from weeks to days, because in a working-capital crisis, speed of response is the primary determinant of financial impact.
Organisations that complete this protocol for the first time are consistently surprised by what they discover. The typical finding is that the loss of a single critical supplier would increase the Cash Conversion Cycle by 20 to 35 days and consume 40 to 60 per cent of the available cash buffer within six weeks. For companies operating in the Amber Zone, this single finding often provides the justification for the entire PULSE implementation.
Beyond Monitoring: Strategic Supplier Diversification
The S-Layer is not merely a monitoring tool. When used strategically, it becomes the foundation for a deliberate supplier-diversification programme that reduces concentration risk over time and increases the Ecosystem Resilience Score.
Effective diversification is not about adding suppliers for the sake of reducing numbers on a concentration index. It is about building qualified, tested, and operationally ready alternatives for every critical input, so that the organisation has genuine optionality when disruption occurs.
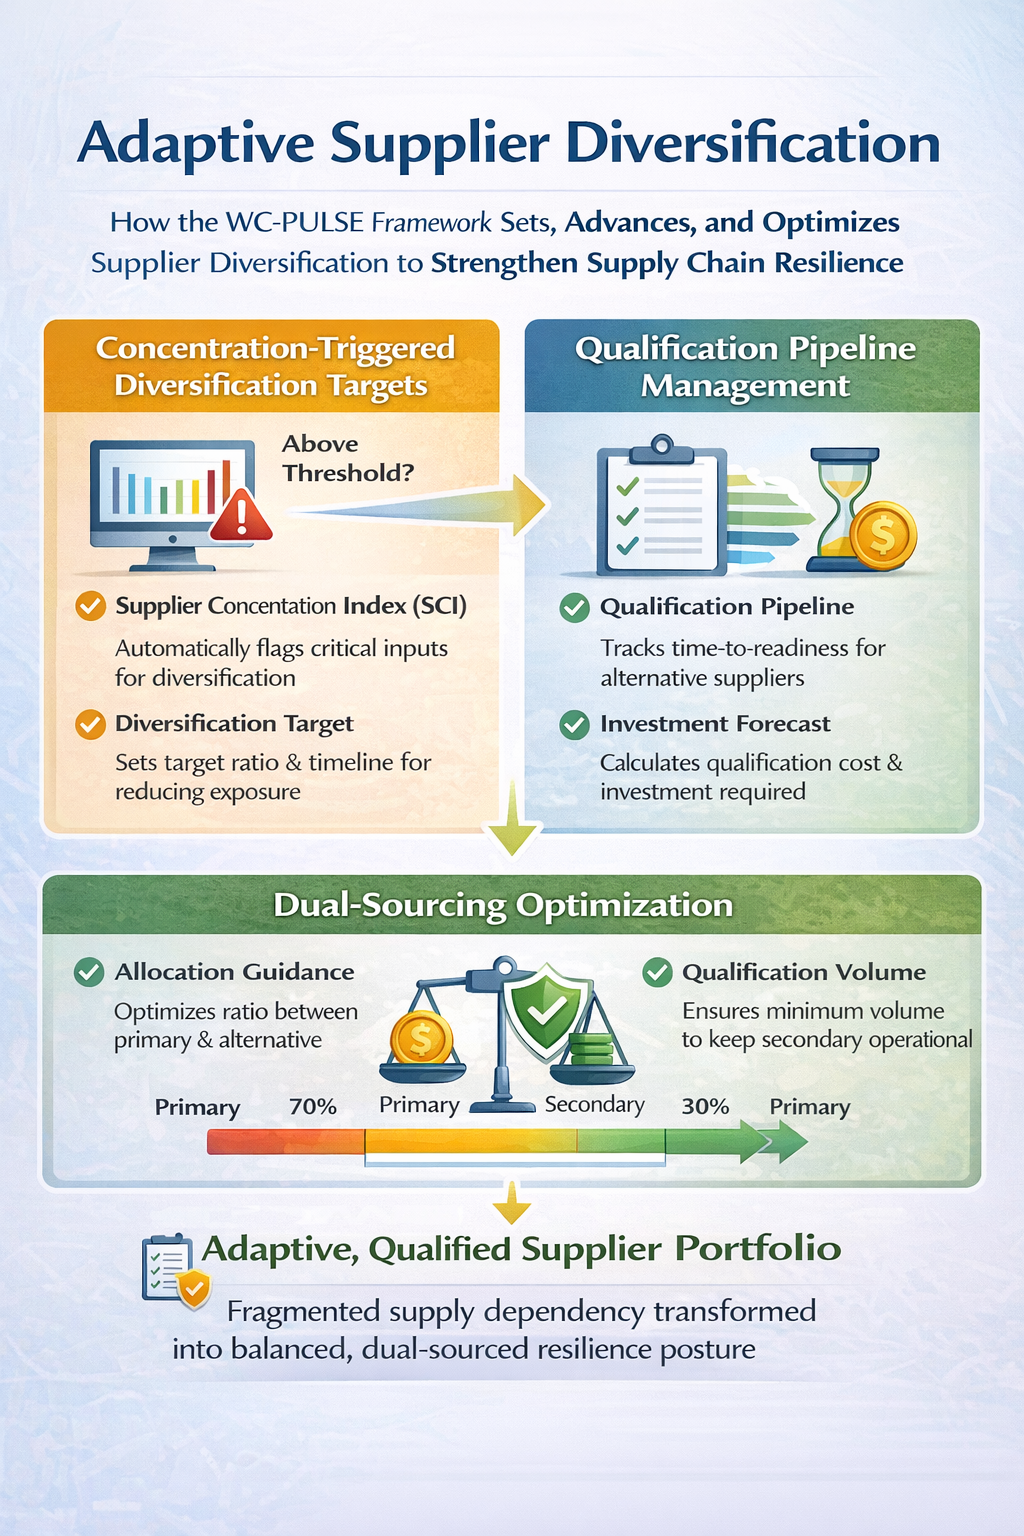
The WC-PULSE Framework drives this through three mechanisms:
- Concentration-triggered diversification targets: When the Supplier Concentration Index for any critical input exceeds a calibrated threshold, the S-Layer automatically flags it for the procurement function with a recommended diversification target and timeline. This converts diversification from a discretionary strategic initiative into a data-driven, continuously monitored operational requirement.
- Qualification pipeline management: The framework tracks the status of alternative-supplier qualification for every critical input, including the estimated time-to-readiness and the investment required to complete qualification. This pipeline ensures that diversification is not merely planned but actively progressing, with visible accountability and milestone tracking.
- Dual-sourcing optimisation: For organisations that have achieved meaningful diversification, the S-Layer provides allocation guidance that balances cost efficiency with resilience. Rather than simply splitting volume equally between two suppliers, the framework recommends allocation ratios that minimise total cost of ownership while maintaining a minimum qualification volume with the secondary supplier to keep them operationally ready.
The strategic payoff of systematic diversification is substantial. Organisations that reduce their top-supplier concentration from 50 per cent to 30 per cent typically see their Ecosystem Resilience Score improve by 25 to 40 points, their insurance and risk-management costs decline, and their negotiating leverage with primary suppliers increase – because a supplier who knows they are the only option prices accordingly.
The CFO-CPO Partnership: Bridging Finance and Procurement
One of the most consequential insights from the S-Layer is that working-capital management cannot be confined to the finance function. Supplier risk is simultaneously a procurement issue and a treasury issue, and the organisations that manage it most effectively are those where the CFO and the Chief Procurement Officer operate from the same data, the same risk framework, and the same trigger protocols.
The WC-PULSE Framework facilitates this partnership by providing a shared language and a shared dashboard. The S-Layer metrics are visible to both the finance and procurement teams, and the trigger alerts are routed to both functions simultaneously. When the Supplier Concentration Index exceeds its threshold, both the CPO and the CFO see the alert – the CPO to initiate diversification actions, the CFO to assess the working-capital buffer implications. When the Counterparty Credit Composite for a key supplier deteriorates, procurement can begin qualifying alternatives while treasury adjusts the cash-flow forecast and buffer calculations.
This cross-functional integration is not optional. It is essential. The most dangerous working-capital surprises occur precisely at the boundary between finance and procurement, where neither function has complete visibility and each assumes the other is monitoring the risk. The S-Layer eliminates this gap.
HOW EXPOSED IS YOUR WORKING CAPITAL TO SUPPLIER FAILURE?
Take the Free PULSE Supplier Stress Test
A 20-question self-assessment that reveals your ecosystem’s vulnerabilities in under 10 minutes. You’ll receive an instant Ecosystem Risk Score, a Concentration Risk Heat Map, and a prioritised list of the three actions that will most improve your resilience.
Dawgen Global is a full-spectrum advisory firm delivering transformation across Strategy, Finance, Operations, Technology, and Governance. Our Working Capital Advisory practice is powered by the proprietary WC-PULSE Framework™, designed to convert working-capital management from a reactive function into a strategic capability that drives shareholder value. We serve mid-market and large enterprises across the Caribbean, North America, and international markets.
Want the full diagnostic? Book a PULSE Ecosystem Assessment with our advisory team:
 Email: [email protected]
 WhatsApp Global Number : +1 555-795-9071
The WC-PULSE Thought Leadership Series
Article 1: “Your Cash Conversion Cycle Is Lying to You: Why CFOs Need a PULSE Check”
Article 2: “Buffer or Bleed: The US$2.4 Trillion Question Every CFO Gets Wrong”
Article 3: “The CFO’s 13-Week Crystal Ball: Predictive Cash-Flow Modelling That Actually Works”
Article 4: “Supplier Risk Is Working-Capital Risk: How to Stress-Test Your Ecosystem” (You are here)
Coming Next – Article 5: “From Treasury Silo to Strategic Nerve Centre: Reinventing Working Capital Governance” – How to break down the walls between Sales, Procurement, Operations, and Finance through shared PULSE metrics, trigger protocols, and cross-functional accountability.
About Dawgen Global
“Embrace BIG FIRM capabilities without the big firm price at Dawgen Global, your committed partner in carving a pathway to continual progress in the vibrant Caribbean region. Our integrated, multidisciplinary approach is finely tuned to address the unique intricacies and lucrative prospects that the region has to offer. Offering a rich array of services, including audit, accounting, tax, IT, HR, risk management, and more, we facilitate smarter and more effective decisions that set the stage for unprecedented triumphs. Let’s collaborate and craft a future where every decision is a steppingstone to greater success. Reach out to explore a partnership that promises not just growth but a future beaming with opportunities and achievements.
Email: [email protected]  Visit: Dawgen Global Website
WhatsApp Global Number : +1 555-795-9071
Caribbean Office: +1876-6655926 / 876-9293670/876-9265210  WhatsApp Global: +1 5557959071
USA Office: 855-354-2447
Join hands with Dawgen Global. Together, let’s venture into a future brimming with opportunities and achievements

