When to Build Working-Capital Buffers. When to Reprice for Margin. And How to Know the Difference.
The US$2.4 Trillion Paradox
Somewhere in the global financial system, there is US$2.4 trillion that does not know what it is supposed to be doing. It sits on corporate balance sheets in the form of excess working capital – cash reserves, inflated inventory, extended receivables, and over-funded payables – waiting for a purpose that no one has clearly defined. Some of it is prudent buffer, the corporate equivalent of a rainy-day fund that will prove invaluable when the next economic shock arrives. But a significant portion of it – by most credible estimates, more than half – is idle capital that is quietly destroying shareholder value every single day.
This is the paradox at the heart of working-capital management: too much buffer and you bleed margin. Too little buffer and you bleed survival. The cost of getting this balance wrong is not theoretical. It is measured in basis points of return on invested capital, in credit-rating downgrades, in lost growth opportunities, and – in the most severe cases – in corporate obituaries.
Yet the vast majority of organisations have no systematic framework for answering the most fundamental question in corporate treasury: How much working-capital buffer is enough? And when should we stop buffering and start repricing for margin?
In our first article in this series, we introduced the Dawgen Global WC-PULSE Framework™ and exposed the five blind spots in the Cash Conversion Cycle. In this second article, we go deeper into the operational core of the framework: the Trigger Zone Matrix and the Buffer-versus-Reprice decision protocol that gives CFOs a data-driven answer to the US$2.4 trillion question.
The Silent Tax: What Over-Buffering Actually Costs
Let us begin with the side of the equation that most finance leaders underestimate: the cost of holding too much working capital. It is a silent tax, invisible on the income statement but devastating to the balance sheet and to long-term value creation.
The Opportunity-Cost Calculation
Every dollar locked in working capital is a dollar that cannot be deployed elsewhere. In a world where the weighted average cost of capital for a mid-market enterprise ranges from 8 to 14 per cent, the mathematics are unforgiving. A company holding US$50 million in excess working capital at a WACC of 10 per cent is effectively incurring an annual opportunity cost of US$5 million – money that could have funded a product launch, an acquisition, a debt reduction, or a return to shareholders.
Scale that calculation across an enterprise with US$200 million in total working capital where even a 15 per cent overshoot represents US$30 million in excess, and the annualised opportunity cost reaches US$3 million. Over a five-year strategic planning horizon, that is US$15 million in value that was never created – not because of a bad decision, but because of the absence of a decision. No one asked whether the buffer was too large, because no one had a framework to determine the right size.
The Margin Compression Effect
Over-buffering does not just consume capital. It compresses margins in ways that are difficult to detect in standard financial reporting. When a company holds excess inventory, it incurs warehousing costs, insurance, obsolescence risk, and the carrying cost of the capital tied up in that stock. When it allows receivables to age beyond optimal terms because it has not repriced its payment policies, it effectively extends interest-free loans to customers – loans that the company itself is financing at its own cost of debt.
When a company maintains excessive cash balances in low-yield deposits while paying 6, 8, or 10 per cent on its revolving credit facility, it is engaging in negative arbitrage – paying more for its funding than it earns on its reserves. This is the financial equivalent of filling a swimming pool with a garden hose while a fire hose drains the other end.
The most dangerous form of excess working capital is the kind that nobody notices – because the organisation has never defined what “enough” looks like.
The Cliff Edge: What Under-Buffering Actually Costs
If over-buffering is a slow bleed, under-buffering is a cliff edge. And the corporate landscape is littered with organisations that ran too lean and discovered, too late, that their working-capital reserves were insufficient to absorb even a modest shock.
The Liquidity Death Spiral
Under-buffering creates a specific and lethal dynamic that we call the Liquidity Death Spiral. It begins with a trigger event: a major customer delays payment, a supplier demands prepayment, a credit line is reduced, or a seasonal trough arrives deeper than expected. In a well-buffered organisation, this trigger is absorbed by reserves. In an under-buffered one, it initiates a cascade.
The company scrambles to cover the shortfall. It accelerates collections aggressively, damaging customer relationships. It delays supplier payments, triggering early-payment penalty clauses or, worse, supply interruptions. It draws on credit facilities at unfavourable rates, increasing interest expense. It defers critical maintenance or investment, degrading operational capability. Each of these actions solves today’s problem while creating tomorrow’s. The spiral accelerates until the company either secures emergency financing – invariably at punitive terms – or fails entirely.
The Real-World Toll
The evidence is overwhelming. Academic research spanning two decades consistently shows that working-capital distress – not insolvency, but the inability to fund day-to-day operations smoothly – is a leading predictor of corporate failure. Companies do not die because they are unprofitable. They die because they run out of cash. The distinction is critical, and it is one that traditional metrics like the Cash Conversion Cycle or even the current ratio fail to capture with sufficient granularity.
Consider the experience of a Caribbean distribution company that we advised in 2023. This was a profitable enterprise with a strong competitive position and a loyal customer base. Its working-capital reserves, however, had been systematically reduced over three years in pursuit of higher returns on invested capital. When a combination of foreign-exchange depreciation and a delayed government receivable created a US$3.8 million cash shortfall, the company had no buffer to absorb it. The resulting emergency bridge loan carried an effective interest rate of 18 per cent, and the covenant restrictions it imposed constrained the company’s operations for the next fourteen months.
The cost of the under-buffer was not just the punitive interest. It was the strategic paralysis, the lost opportunities, the management distraction, and the reputational damage of being perceived as financially fragile by suppliers and customers alike. All of it was avoidable – if the company had known, with precision, where the boundary between efficient and dangerous truly lay.
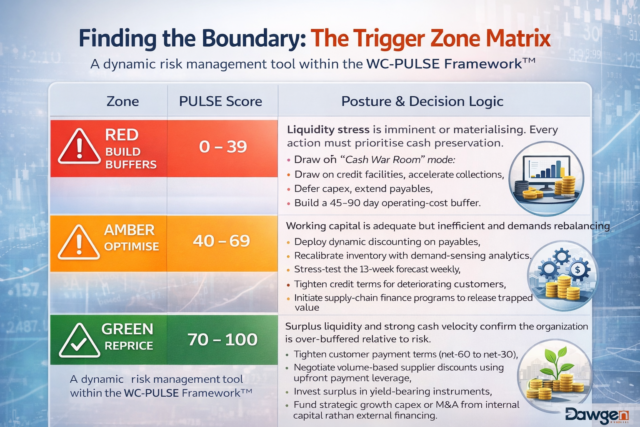
Finding the Boundary: The Trigger Zone Matrix
This is precisely the problem that the Trigger Zone Matrix within the WC-PULSE Framework™ is designed to solve. Rather than treating working-capital management as a static target – “hold 45 days of cash” or “maintain a current ratio of 1.5” – the Trigger Zone Matrix provides a dynamic, condition-responsive classification system that tells the CFO, in real time, which regime the organisation is operating in and what actions that regime demands.
The matrix operates across three zones, each derived from the composite PULSE Score described in Article 1:
The critical innovation in this model is that zone assignment is not based on a single metric or a static threshold. It is the product of five diagnostic layers – Predictive Cash-Flow Velocity, Utilisation and Asset Intensity, Liquidity Depth and Duration, Supplier and Receivables Ecosystem Health, and External Macro Sensitivity – each scored independently and combined with industry-calibrated weights. This means the system captures complexity that no single ratio can see.
The Buffer Equation: How Much Is Enough?
One of the most common questions we receive from CFOs engaging with the WC-PULSE Framework for the first time is deceptively simple: “Just tell me – how many days of cash should I hold?” The honest answer is that there is no universal number, because the right buffer depends on at least six variables that are unique to every organisation:
- Volatility of cash inflows: A company with predictable subscription revenue needs a smaller buffer than one dependent on project-based or seasonal sales. The P-Layer of PULSE quantifies this through Cash-Flow-at-Risk modelling.
- Concentration risk: An organisation where three customers represent 60 per cent of revenue needs a larger buffer than one with a diversified customer base. The S-Layer captures this through the Supplier and Customer Concentration Index.
- Credit-facility availability: A company with US$50 million in undrawn revolving credit has a fundamentally different buffer requirement than one operating at facility limits. The L-Layer measures this through Liquidity Depth scoring.
- Macro exposure: An organisation importing in US dollars and selling in a volatile local currency faces FX-driven cash-flow swings that demand additional buffer. The E-Layer quantifies this through the FX Exposure Ratio and Commodity Beta.
- Operational flexibility: A company that can scale down operations quickly – reducing variable costs within 30 days – needs less buffer than one with heavy fixed-cost structures. The U-Layer captures this through asset-intensity measurement.
- Industry cyclicality: Businesses in cyclical sectors such as construction, energy, or tourism must hold buffers calibrated to the amplitude of their cycle, not just to average conditions.
The WC-PULSE Framework synthesises all six variables into a single, calibrated output: the Optimal Buffer Range, expressed in days of fixed operating cost coverage. For most mid-market enterprises, this range falls between 30 and 90 days, but the precise figure – and the triggers that move it – are what separates strategic treasury from guesswork.
The Reprice Moment: Knowing When to Go on Offence
If the Red Zone is about survival and the Amber Zone is about efficiency, the Green Zone is about competitive advantage. And it is the zone that most CFOs underutilise, because the bias in corporate treasury is overwhelmingly toward caution. Holding excess cash feels safe. Releasing it feels risky. The WC-PULSE Framework is designed to overcome this behavioural bias with data.
The Green Zone Protocol is triggered when the composite PULSE Score exceeds 70 for three consecutive measurement periods and when no individual layer has a score below 40. These dual conditions ensure that the organisation is not merely liquid in aggregate but healthy across all five dimensions. When both conditions are met, the framework authorises – and indeed encourages – a shift from defensive buffering to offensive repricing.
The Repricing Toolkit
Repricing is not a single action. It is a coordinated set of moves designed to capture margin from surplus working capital:
- Payment-term tightening: Moving customers from net-60 to net-30 is the single highest-impact lever in most organisations. For a company with US$100 million in annual revenue, this move releases approximately US$8.2 million in cash that was previously financing customer operations at no return. That released cash can be redeployed at the company’s WACC, generating US$800,000 to US$1.2 million in annual value.
- Supplier early-payment leverage: When you have surplus cash, you have negotiating power. Offering suppliers payment in 10 days instead of 45 in exchange for a 2 per cent discount translates to an annualised return of approximately 21 per cent on the accelerated payment. This is one of the most attractive risk-adjusted returns available to any treasury function.
- Yield optimisation on surplus: Cash that is not needed for operations or strategic deployment within 90 days should be earning a return. In the current rate environment, short-duration treasury instruments, money-market funds, and structured deposits can capture 80 to 95 per cent of the risk-free rate with minimal credit or duration risk.
- Strategic reinvestment: The most sophisticated Green Zone operators do not merely optimise returns on surplus. They use the confidence provided by the PULSE Dashboard to fund growth initiatives – new markets, new products, tuck-in acquisitions – from internal capital, avoiding the cost and covenant burden of external financing.
The companies that will win the next decade are not the ones with the largest cash piles. They are the ones that know, with precision, when their cash pile is a weapon and when it is a weight.
Zone Transition Intelligence: The Early-Warning System
The Trigger Zone Matrix is not a static classification. It is a dynamic system that monitors for zone transitions using leading indicators, not lagging ones. This anticipatory capability is what separates the WC-PULSE Framework from traditional working-capital dashboards that report on conditions after they have already changed.
The framework monitors four critical transition signals:
- Red-to-Amber Recovery Signal: Two consecutive weeks of improving Cash-Flow-at-Risk combined with DSO declining by more than 5 per cent from its stress peak. When both conditions are met, the system signals that the acute crisis is stabilising and selective buffer release can begin – but only selective. Full zone transition requires the composite PULSE Score to sustain above 40 for three consecutive periods.
- Amber-to-Green Acceleration Signal: The composite PULSE Score exceeds 65 for three consecutive periods, the Cash Conversion Cycle shortens below the industry median, and the free-cash-flow yield surpasses the weighted cost of debt by 200 or more basis points. This triple confirmation prevents premature repricing and ensures the organisation has genuine surplus capacity, not a temporary blip.
- Green-to-Amber Caution Signal: Any single PULSE layer dropping below 40 triggers an automatic zone reassessment, even if the composite score remains above 70. This rule exists because a strong composite can mask a critically weak layer – precisely the averaging problem we identified with the CCC in Article 1. A company with an overall PULSE Score of 72 but an S-Layer score of 35 (indicating supplier ecosystem distress) should not be in repricing mode.
- Emergency Red Override: Certain events bypass the scoring system entirely and trigger immediate Red Zone protocols regardless of the composite PULSE Score. These include the default of a top-three customer, the loss of a primary credit facility, a regulatory enforcement action that freezes assets, or a force-majeure supply-chain disruption. These override triggers are calibrated during the framework’s implementation phase and are specific to each client’s risk profile.
The power of this system lies in its graduated response. It does not wait for a crisis to prescribe action, nor does it impose unnecessary conservatism during periods of strength. It calibrates the response to the reality – continuously, automatically, and with the precision that manual monitoring simply cannot achieve.
The CFO’s New Mandate
The question of buffer versus reprice is not a technical question. It is a strategic one. And it is rapidly becoming a governance imperative. Boards are asking harder questions about capital allocation. Investors are scrutinising working-capital efficiency as a proxy for management quality. Rating agencies are incorporating liquidity resilience into their assessments with increasing rigour. In this environment, the CFO who cannot articulate a principled, data-driven approach to working-capital buffer sizing and repricing is the CFO who is operating on borrowed time.
The WC-PULSE Framework provides that approach. It gives the CFO a common language for discussing working-capital strategy with the board. It gives the Treasurer a real-time decision engine for managing liquidity. It gives the FP&A team a predictive capability that transforms the 13-week forecast from a compliance exercise into a strategic weapon. And it gives the entire organisation a shared understanding of when to build, when to hold, and when to deploy.
The US$2.4 trillion question is not one that every CFO gets wrong. It is one that most CFOs never get the chance to answer properly, because they lack the framework to do so. The WC-PULSE Framework changes that.
STOP GUESSING. START CALIBRATING.
Discover whether your working capital is a safety net or a drag on shareholder value.
The PULSE Buffer Calculator is a self-service diagnostic that models your optimal buffer range based on your industry, cash-flow volatility, concentration risk, and macro exposure. It takes less than 15 minutes and delivers a personalised Buffer Adequacy Score with an immediate action recommendation.
When you’re ready for the full diagnostic, our advisory team is standing by:
Dawgen Global is a full-spectrum advisory firm delivering transformation across Strategy, Finance, Operations, Technology, and Governance. Our Working Capital Advisory practice is powered by the proprietary WC-PULSE Framework™, designed to convert working-capital management from a reactive function into a strategic capability that drives shareholder value. We serve mid-market and large enterprises across the Caribbean, North America, and international markets.
About Dawgen Global
“Embrace BIG FIRM capabilities without the big firm price at Dawgen Global, your committed partner in carving a pathway to continual progress in the vibrant Caribbean region. Our integrated, multidisciplinary approach is finely tuned to address the unique intricacies and lucrative prospects that the region has to offer. Offering a rich array of services, including audit, accounting, tax, IT, HR, risk management, and more, we facilitate smarter and more effective decisions that set the stage for unprecedented triumphs. Let’s collaborate and craft a future where every decision is a steppingstone to greater success. Reach out to explore a partnership that promises not just growth but a future beaming with opportunities and achievements.
 Email: [email protected]
  Visit: Dawgen Global Website

 WhatsApp Global Number : +1 555-795-9071
Caribbean Office: +1876-6655926 / 876-9293670/876-9265210  WhatsApp Global: +1 5557959071
USA Office: 855-354-2447
Join hands with Dawgen Global. Together, let’s venture into a future brimming with opportunities and achievements

