
If strategy is about choice, commercial strategy is about coverage choice—who gets human attention, who gets assisted digital, and who gets world-class self-serve. Most organizations inherit their route-to-market rather than design it. The result is predictable: rising cost-to-serve, inconsistent experiences, and sales capacity trapped in low-yield activity.
The Dawgen Coverage Matrix™ fixes this. It is the commercial engine of the Dawgen Delta Framework™, aligning Customers, Company, and Competitors by matching wallet size and service intensity to the lowest-cost model that still wins. Done right, the matrix becomes a lever that raises your Dawgen Fit Index™, improves LTV/CAC, and expands ROIC—often within a single quarter.
This article is your field guide: how to build the matrix, design roles and cadences, wire incentives and SLAs, and operationalize it across sectors (including Caribbean realities of scale, FX, and logistics). You’ll also find templates, KPIs, and a 90-day rollout plan with common pitfalls to avoid.
1) What the Dawgen Coverage Matrix™ Is (and What It Solves)
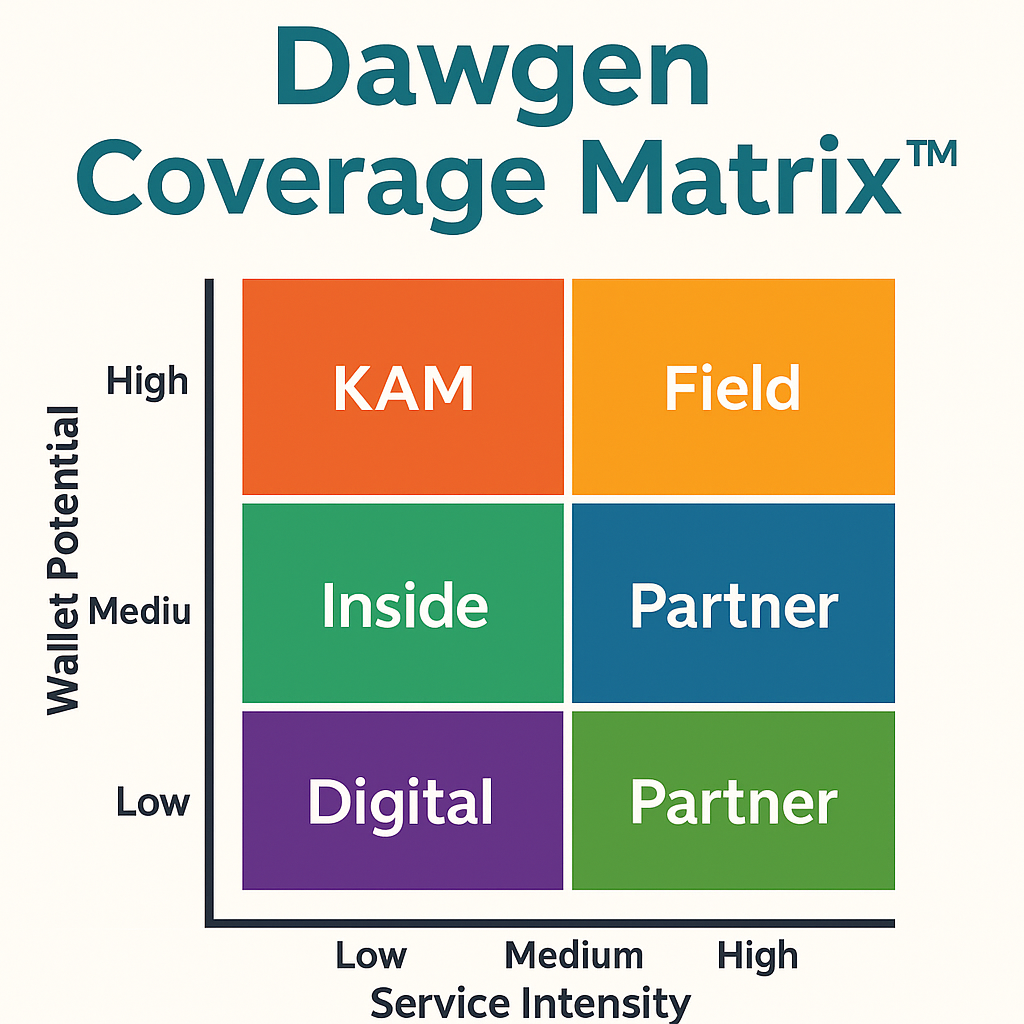
Definition. The Coverage Matrix classifies accounts (or prospects) along two practical axes:
-
Economic Potential (“Wallet”) – current and forecast revenue, margin potential, and strategic value (influence, references, data).
-
Service Intensity (“How They Win”) – the degree of human/technical effort required to acquire, onboard, expand, and retain the account at acceptable risk.
The output is a design for resources and cadence: which accounts get Key Account Managers (KAMs), Field/Enterprise sellers, Inside Sales, Partner-led coverage, or Digital Self-Serve. It also specifies SLA tiers, offer menus, and deal-desk rules that protect margin.
Problems it solves:
-
Sellers spread too thin across unqualified or low-yield activity.
-
High-potential accounts under-served; long-tail too expensive to maintain.
-
Mixed messages to the market and partners; channel conflict.
-
Price erosion from ad-hoc exceptions and unmanaged “specials.”
-
Capacity planning chaos; no clean way to add headcount or technology where it pays back.
2) The Coverage Matrix—Four Core Models
Most businesses end up with five canonical coverage models. We tailor names and thresholds, but the logic holds across industries:
-
Strategic / KAM (one-to-few)
-
When: Very large wallet, complex buying centers, high switching costs, regulated stakes.
-
Who: Senior KAM, solution architect, exec sponsor, service squad.
-
Cadence: Weekly pipeline + monthly exec QBR; joint business plan.
-
Pricing & Offer: Custom or Premium tier with SLA guarantees and multi-year terms.
-
-
Enterprise / Field (few-to-many)
-
When: Large wallet; some complexity; regional footprint.
-
Who: Field AE + Sales Engineer; CSM for post-sale.
-
Cadence: Bi-weekly deal reviews; quarterly business reviews.
-
Pricing & Offer: Bundled “Assured” tier with options and fences.
-
-
Commercial / Inside Sales (many-to-many)
-
When: Mid-market wallet; standardized needs; remote selling works.
-
Who: Inside AE + SDR; pooled SE/CSM; marketing automation.
-
Cadence: Weekly call blocks; monthly campaigns; digital trials.
-
Pricing & Offer: Good/Better/Best menus; strict deal-desk rules.
-
-
Partner-led (many-to-many via ecosystem)
-
When: Fragmented geographies (e.g., islands), specialist verticals, or capability gaps.
-
Who: Channel managers; solution partners; distributors; agents.
-
Cadence: Joint plans; enablement; MDF; quarterly partner scorecards.
-
Pricing & Offer: Partner discounts with price integrity guardrails.
-
-
Digital Self-Serve (infinite-to-one)
-
When: Low wallet or highly standardized product; land-and-expand potential.
-
Who: Product-led growth (PLG), in-app prompts, lifecycle emails, chat/AI assist.
-
Cadence: Always-on; cohort analytics; usage triggers.
-
Pricing & Offer: Transparent menus; trial-to-paid nudges; usage-based options.
-
The matrix assigns accounts to these models based on wallet × effort, then adds specific SLAs, cadences, and hand-off rules so customers can graduate to higher models as value grows.
3) How to Build Your Coverage Matrix (Step-by-Step)
Step 1 — Define Wallet Potential
Use three lenses:
-
Actuals: current revenue and margin.
-
Modeled Potential: category spend × share opportunities × attach rate.
-
Strategic Value: brand/reference power, data access, adjacency unlocks.
Put accounts into A / B / C bands (e.g., A ≥ top 15% potential; C ≤ bottom 50%).
Step 2 — Score Service Intensity
Estimate the cost-to-acquire and cost-to-serve by account type:
-
Buying complexity, number of stakeholders, proof requirements.
-
Integration, onboarding, risk/compliance, after-sale support.
-
Logistics footprint and volatility (relevant in multi-island markets).
Score High / Medium / Low. Cross with wallet bands to create 6–9 cells.
Step 3 — Assign Coverage Models by Cell
Example mapping:
| Wallet \ Intensity | Low | Medium | High |
|---|---|---|---|
| A (Large) | Field | Field/KAM | KAM |
| B (Medium) | Inside | Field | Field |
| C (Small) | Digital | Inside | Inside/Partner |
Step 4 — Define SLAs, Offers, and Hand-offs
-
SLAs: response times, onboarding TTFV targets, issue resolution, dedicated resources.
-
Offer menus: which Good/Assured/Premium tiers are allowed in each cell.
-
Hand-offs: clear triggers for moving an account up (e.g., 3 months at ≥X MRR; >Y product modules; entering regulated segment).
Step 5 — Wire Roles, Cadences, and Territories
-
Roles: SDR, AE, SE, CSM, KAM, Partner Manager; avoid role sprawl.
-
Cadences: weekly call blocks, monthly pipeline, quarterly QBRs; publish the calendar.
-
Territories/Books: size by capacity model (see next), not by feelings.
Step 6 — Install the Deal Desk
Protect price integrity with fences and rules:
-
Minimum margin per tier; discount thresholds requiring approvals.
-
Trade rules (scope for price)—never margin for nothing.
-
SLA credits default to account credits (not cash).
Step 7 — Instrument & Iterate
Track model-specific KPIs (below) and refresh quarterly. The Coverage Matrix is a living system.
4) The Capacity Model (Where the Money Hides)
Coverage only works if it fits human time. Build a 12-week model per role:
-
Hours per rep per week (after meetings, admin): e.g., 24 sellable hours.
-
Activity benchmarks: discovery calls, demos, proposals, QBRs, site visits.
-
Funnel math: conversion from inquiry → SAL → SQL → win; cycle time; deal size.
-
Book size: accounts per rep by model (e.g., KAM 5–12; Field 30–60; Inside 150–300; CSM 30–60 for high touch; 200–500 for tech-touch).
Use this to size headcount, justify technology, and sequence hiring. If the math doesn’t balance, your design won’t either.
5) Incentives & Governance That Make It Stick
Compensation. Pay for the outcome you want:
-
KAM/Field: weight on new ACV/GM, expansion, and strategic milestones (multi-year, SLA adoption).
-
Inside/SDR: qualified pipeline and new logos; spiffs tied to targeted products/segments.
-
CSM: gross retention, net retention, time-to-value, SLA attainment.
-
Partner Managers: partner-sourced revenue, enablement milestones, price integrity.
Targets & Territories. Ground in the capacity model. Publish rules to remove shadow politics.
Governance.
-
Monthly Commercial Council reviews: pipeline by model, price integrity, SLA credits, channel conflict.
-
Quarterly Wargame Lab™ to anticipate competitor channel plays and adjust partner strategy.
6) KPIs by Coverage Model (Feed the Dawgen Fit Index™)
Customer Fit
-
Time-to-First-Value (TTFV) by model
-
Early churn (≤90 days) by segment and model
-
NPS/CSAT by model and SLA tier
-
Self-serve adoption and digital completion rates
Company Fit
-
LTV/CAC by model
-
Gross margin and deal margin by tier
-
Sales cycle and throughput
-
Capacity utilization (hours vs plan)
-
Cost-to-serve (tickets per account, touch minutes)
Competitor Fit
-
Relative price index in head-to-head deals
-
Win-rate vs top three rivals by segment
-
Partner coverage density in target geographies/verticals
All of these roll up into your Dawgen Fit Index™, giving leadership a single number to steer by.
7) Sector Playbooks (Illustrative)
A) Financial Services (SME & Retail)
-
Challenge: Large long-tail of micro-merchants; high compliance overhead.
-
Matrix:
-
KAM: top corporates and regulated entities (Assurance Wrap™ required).
-
Field: mid-market SMEs with payroll/FX needs.
-
Inside: small SMEs via remote onboarding.
-
Digital: micro-merchants; app-led; agent network for KYC help.
-
-
Levers: SLA-backed settlement windows in higher tiers; digital cash-in/cash-out partners; RM scorecards tied to adoption and NPS.
-
Result: higher ARPU mix; reduced KYC rework; lower churn in first 90 days.
B) B2B SaaS & Professional Services
-
Challenge: Senior talent selling to small deals; unpredictable scoping.
-
Matrix:
-
KAM: enterprises with multi-BU potential; exec sponsor and solution architect.
-
Field: upper-mid with integrations.
-
Inside: standard modules; PLG trials; usage-based offers.
-
Partner: local integrators in small markets for last-mile.
-
-
Levers: scoping playbooks; milestone-based packages; deal-desk fences; CSM tech-touch for value tier.
-
Result: cycle-time down; CAC payback improves; net retention up on “Assured” tier.
C) FMCG & Distribution (Caribbean Multi-Island)
-
Challenge: Fragmented geography, logistics variability, shelf execution.
-
Matrix:
-
KAM: national chains & wholesalers with joint business plans.
-
Field: regional chains and tier-1 independents.
-
Partner: sub-distributors for out-islands.
-
Digital: e-ordering for long-tail with seasonal promos.
-
-
Levers: OTIF SLAs by tier; route optimization; planogram compliance audits; price-pack architecture.
-
Result: OTIF up, returns down, shelf availability higher, margin mix improves.
D) Energy & Utilities
-
Challenge: Reliability expectations, regulatory oversight, tariff constraints.
-
Matrix:
-
KAM: industrial & government accounts; Premium uptime SLAs.
-
Field: commercial sites.
-
Partner: device/installer ecosystems.
-
Digital: residential self-serve, usage analytics.
-
-
Levers: predictive maintenance SLAs; capex stage-gates; outage communication playbooks.
-
Result: improved customer satisfaction; more stable revenue; better capex productivity.
8) Pricing & SLAs Inside the Matrix
Coverage design and pricing must reinforce each other:
-
Tiered SLAs: tighter commitments only in Assured/Premium tiers; protect with credits not cash rebates.
-
Price Fences: term length, regulated status, time window, volume, integration scope.
-
Deal-Desk Guardrails: discount thresholds; trade scope for price; require SLA adoption for special terms.
-
Attach Plays: training, data dashboards, and Assurance Wrap™ as margin-accretive add-ons.
This ensures the matrix shifts mix upward rather than becoming a cost sink.
9) 90-Day Rollout Plan (The Delta Cadence)
Weeks 1–2 — Diagnose & Design
-
Baseline wallet and service intensity; produce the 6–9 cell draft.
-
Map current roles and time use; build the capacity model.
-
Decide model definitions, SLAs, and offer menus per cell.
Weeks 3–4 — Enable & Instrument
-
Publish territories/books; run enablement on scripts and cadences.
-
Stand up deal desk and CRM fields (model tag, SLA tier, hand-off triggers).
-
Launch first partner enables; define MDF and scorecards.
Weeks 5–8 — Pilot
-
Trial in 1–2 regions/verticals; measure TTFV, LTV/CAC, win-rate, utilization.
-
Run a mini-wargame on competitor/channel responses.
-
Fix obvious bottlenecks (handoffs, approvals, discount leakage).
Weeks 9–12 — Scale
-
Finalize thresholds; roll across the portfolio.
-
Tie incentives to model metrics and ΔDawgen Fit Index™.
-
Publish a transparent monthly Commercial Council dashboard.
10) Templates You Can Lift
Coverage Assignment (per account)
-
Wallet Band (A/B/C): ______
-
Service Intensity (H/M/L): ______
-
Assigned Model: KAM / Field / Inside / Partner / Digital
-
SLA Tier: Value / Assured / Premium
-
Primary Motion This Quarter: Land / Expand / Retain / Recover
-
Hand-off Trigger to Next Model: __________________________
Rep Book Size Planner
-
Model: __________
-
Capacity (sellable hours/wk): ____
-
Activities per week: discovery __; demos __; visits __; QBRs __
-
Funnel conversion %: inq→SAL __; SAL→SQL __; SQL→Win __
-
Avg deal value: ______
-
Max accounts per rep: ______ (auto-calc)
Partner Scorecard
-
Sourced revenue; pipeline; price integrity incidents; enablement hours; certification status; SLA compliance rate.
11) Common Pitfalls (and Dawgen Fixes)
-
“Everyone is special.”
Fix: Publish thresholds. If a deal doesn’t meet the threshold, it’s Inside/Digital unless exec-approved with a business case. -
Channel conflict.
Fix: Put rules of engagement in writing; last-touch plus sourced credit; centralized adjudication; public logs. -
Discount leakage.
Fix: Deal desk with price fences and approval matrix; require reciprocal scope changes; ban “stealth specials.” -
Role sprawl & meeting bloat.
Fix: Strict cadences with purpose; remove any meeting without owner/agenda; protect seller call blocks. -
Under-invested digital.
Fix: Treat self-serve as a first-class channel; instrument onboarding; staff content/enablement; give PLG owners targets. -
Static books and territories.
Fix: Quarterly reshapes based on wallet changes; automate “graduate up” triggers.
12) Caribbean & Regional Nuance
-
Geography & Scale: Multi-island realities make Partner-led crucial; design clear enablement and compliance checks.
-
FX & Logistics: Bake indexation into Premium tiers; use Assurance Wrap™ for regulated sectors.
-
Omnichannel (incl. WhatsApp/agents): Ensure CRM captures these flows; route tickets to the right model.
-
Talent Markets: Train Inside Sales as a leadership bench; promote into Field/KAM based on scoreboard, not tenure.
13) Tying the Coverage Matrix to ROIC
-
Growth: More wins in target cells, higher expansion from structured QBRs.
-
Margin: Better mix (Assured/Premium), fewer unpriced exceptions.
-
Capital Efficiency: Predictable demand lowers buffers; partner models reduce fixed assets.
-
Risk: Compliance handled within tiers; fewer bespoke “hero” projects.
Clients typically see within two quarters:
-
+10–20% seller productivity,
-
LTV/CAC +15–30%,
-
Gross margin +120–250 bps from mix and price integrity,
-
Early churn −2–5 pts,
with a corresponding Dawgen Fit Index™ uplift that tracks into ROIC spread improvement.
Ready to Design Coverage that Pays?
Dawgen Global will help your team build and pilot the Dawgen Coverage Matrix™, stand up the deal desk, and align incentives and cadences—so every hour sellers spend creates measurable delta.
Request a proposal today:
📧 [email protected]
💬 WhatsApp (Global): +1 555 795 9071
Let’s align your route-to-market with the outcomes you promise—the Dawgen Way.
About Dawgen Global
“Embrace BIG FIRM capabilities without the big firm price at Dawgen Global, your committed partner in carving a pathway to continual progress in the vibrant Caribbean region. Our integrated, multidisciplinary approach is finely tuned to address the unique intricacies and lucrative prospects that the region has to offer. Offering a rich array of services, including audit, accounting, tax, IT, HR, risk management, and more, we facilitate smarter and more effective decisions that set the stage for unprecedented triumphs. Let’s collaborate and craft a future where every decision is a steppingstone to greater success. Reach out to explore a partnership that promises not just growth but a future beaming with opportunities and achievements.
✉️ Email: [email protected] 🌐 Visit: Dawgen Global Website
📞 📱 WhatsApp Global Number : +1 555-795-9071
📞 Caribbean Office: +1876-6655926 / 876-9293670/876-9265210 📲 WhatsApp Global: +1 5557959071
📞 USA Office: 855-354-2447
Join hands with Dawgen Global. Together, let’s venture into a future brimming with opportunities and achievements

