The most consequential observation from our advisory work over the eighteen months since Hurricane Melissa is the one we did not expect to be making. We expected, going into the post-Melissa recovery period, that the Caribbean enterprises with the strongest pre-stress capital architectures would produce the strongest recoveries. We expected the diagnostics already established in this series — the Capital Resilience Index™, the Liquidity Layering Stack™, the Covenant Stress Heat-Map™, the Capital Source Mix Wheel™ — to predict, on a forward basis, which enterprises would re-emerge fastest. We expected, in short, that strong static architecture would produce strong dynamic recovery.
The expectation was correct in direction and incorrect in resolution. Strong static architecture is necessary for strong dynamic recovery. It is not, on its own, sufficient. We have observed, repeatedly, in our advisory engagements with Caribbean enterprises across multiple sectors, two enterprises with essentially identical pre-stress static architectures — same Capital Resilience Index™ score, same Liquidity Layering Stack™ composition, same Capital Source Mix Wheel™ archetype — produce radically different recovery velocities after a defined stress event. The static measurement does not predict the dynamic outcome with the resolution boards require.
Pillar 8 of the Dawgen Resilient Capital Structure Framework — Recovery Speed — is the discipline of measuring the dynamic property that the static diagnostics cannot, on their own, surface. The Recovery Velocity Score™, introduced in this article, is the eighth proprietary tool of the framework, and the principal diagnostic for Pillar 8. It is the tool that converts the question “how resilient is your capital architecture” into the harder, more operationally meaningful question “how fast does your capital architecture come back.” The two questions are related. They are not the same question. The diagnostic that surfaces the answer to one will not surface the answer to the other.
| THE OBSERVATION
Two Caribbean enterprises with identical static capital architectures — same coverage, same depth, same source mix — will produce different recovery velocities when stress arrives. The difference is not random. It is the result of architectural properties that the static diagnostics, however rigorously applied, do not measure. Pillar 8 is the discipline of measuring those properties. The Recovery Velocity Score™ is the diagnostic that surfaces them. |
The Composite Engagement
Greenfield Estates Group — the name is composite, the structure is real and recognisable across the Caribbean export-agribusiness landscape — is a Jamaica-headquartered integrated agricultural enterprise that has been the subject of advisory work in our practice over a number of years and has, since Hurricane Melissa, been the subject of a sustained recovery-velocity engagement. The group operates approximately 1,200 hectares across three principal commodity lines: speciality coffee on the higher-elevation estates in the centre of the island, citrus on the lower-elevation estates closer to the coast, and ornamental horticulture for the regional and US export markets on a small but operationally distinct subsidiary in the eastern parishes.
The group’s structure is conventional for a Caribbean export agribusiness of its scale. Three operating subsidiaries: an estates subsidiary that owns and manages the agricultural land assets and produces the unprocessed commodity output, a processing subsidiary that operates the centralised processing facility (coffee washing, drying, and grading; citrus juicing and concentration; ornamental packing) and produces the export-grade output, and an export subsidiary that holds the international trade relationships, manages the freight forwarding, and books the revenue from buyers in the regional Caribbean market, the United States diaspora retail channels, and the speciality importers that represent the most economically meaningful portion of the group’s revenue base. Consolidated revenue at the time of Melissa was approximately US$48 million across all three subsidiaries; the group employs approximately 320 permanent staff and a further 280 seasonal workers during peak harvest cycles.
The group’s pre-Melissa capital architecture, measured by the static diagnostics this series has introduced through Article 8, was strong by Caribbean mid-market agribusiness standards. The Capital Resilience Index™ measured 168 days of capital coverage under stress — substantially above the regional sector median. The Liquidity Layering Stack™ showed a complete five-tier architecture: working cash and committed bilateral lines at the operational tier, an asset-backed inventory financing facility at the secondary tier, a parametric crop-loss insurance contract at the contingent tier, an established relationship with two regional development finance institutions at the strategic tier, and an emergency line from the founding family’s trust at the foundational tier. The Capital Source Mix Wheel™ registered as a moderate Bilateral Cluster at acceptable concentration: approximately seventy-two percent in commercial bank exposures, with meaningful presence in asset-backed instruments and a small but real exposure to multilateral development finance via a CDB-guaranteed working capital facility executed in 2023. By the standards of the Caribbean agribusiness sector and by the standards of the framework, Greenfield Estates Group entered Hurricane Melissa with a capital architecture that should have produced strong recovery.
Hurricane Melissa made landfall on 28 October 2025. The storm tracked through the centre of the Greenfield estates corridor at approximately Category 4 intensity by the time it reached the higher-elevation coffee estates, with sustained winds in excess of 130 miles per hour and rainfall totals exceeding 24 inches over a 36-hour period. The damage to the operating assets was severe but not, on first assessment, catastrophic in financial terms. Estate-level damage to coffee bushes affected approximately 40% of the productive plantation, with full restoration to pre-storm productivity expected to require eighteen to twenty-four months. The processing facility flooded to a depth of approximately 2.4 meters, destroying machinery and inventory equivalent to roughly US$3.8 million of replacement value. The export logistics infrastructure was disrupted for the full Q4 2025 cycle and into Q1 2026. The total direct loss, before insurance recoveries and operational adjustments, was assessed at approximately US$8.6 million — substantial in absolute terms, but well within the architectural capacity the static diagnostics had projected.
Eighteen months later, the group has recovered. But the recovery has not been the recovery the static architecture predicted. The financial recovery has been substantially faster than expected. The operational recovery has been substantially slower. The architectural recovery has been the slowest of the three. And the relational recovery has been faster than the architectural recovery but slower than the financial. The four velocities have been radically out of alignment with each other, and the misalignment has produced operational consequences the group has had to manage actively over the recovery period. The static diagnostics did not predict the misalignment. They could not. The diagnostic that surfaces it is the Recovery Velocity Score™, which we developed during the Greenfield engagement and which is now formalised as the framework’s eighth proprietary tool.
What Pillar 8 Actually Measures
Pillar 8 of the Dawgen Resilient Capital Structure Framework — Recovery Speed — is the structural property of the enterprise’s capital architecture that determines, after a defined stress event, the rate at which each of the architecture’s principal dimensions returns to pre-stress condition. The pillar treats capital resilience as a kinetic phenomenon rather than a static one. It asks not whether the architecture survives the stress — the static pillars already address that question — but how the architecture moves over time after the stress, and whether the movement is fast enough, in each dimension, to keep the enterprise operating at the standard the enterprise’s stakeholders require.
The pillar’s central claim is that capital recovery is not a single phenomenon. It is four phenomena, occurring in parallel, each with its own velocity, each with its own determinants, and each with its own characteristic failure mode. The four are: financial recovery, measured by the rate at which liquidity returns; operational recovery, measured by the rate at which revenue returns; architectural recovery, measured by the rate at which the capital structure returns to pre-stress depth; and relational recovery, measured by the rate at which the enterprise’s lender, customer, and supplier relationships return to pre-stress quality. The four are correlated but not synchronised. They can move at sharply different speeds, and the disjunction among them is itself a structural property of the architecture worth surfacing.
The conventional approach to recovery measurement in regional enterprise — where structured measurement exists at all — is to measure financial recovery alone, typically through the lens of restored cash position or restored EBITDA. The conventional approach is operationally useful for short-term reporting but architecturally incomplete. An enterprise can have strong financial recovery (cash returns within ninety days from insurance proceeds, parametric payouts, and DFI bridge facilities) while having weak operational recovery (revenue takes eighteen months to return because export buyers have shifted to alternative suppliers during the disruption), weak architectural recovery (two of the pre-stress lender panel banks have permanently reduced their exposure and the consolidated source mix is now more concentrated than before), and weak relational recovery (the enterprise’s standing with its principal export buyers has been damaged by the inability to honour delivery commitments during the disruption). All four velocities matter. Measuring only one of them produces an incomplete — and frequently misleadingly optimistic — picture of recovery.
| THE FOUR VELOCITIES
Financial Recovery Velocity asks how fast cash returns. Operational Recovery Velocity asks how fast revenue returns. Architectural Recovery Velocity asks how fast the capital structure returns to pre-stress depth. Relational Recovery Velocity asks how fast counterparty relationships return to pre-stress quality. The four velocities can be — and frequently are — sharply different. An enterprise with rapid financial recovery and slow architectural recovery is a different enterprise than one with rapid architectural recovery and slow operational recovery, even if their headline financial metrics converge over the long run. The boards we work with have, with very few exceptions, never measured the four velocities discretely. The Recovery Velocity Score™ is the diagnostic that begins the discipline. |
The Four Recovery Velocities
Each of the four velocities measures a distinct structural property of the post-stress architecture. Each is scored discretely. Each has its own characteristic determinants and its own characteristic failure mode. The discipline of separate measurement is itself the principal value the diagnostic produces, prior to any specific number it generates.
Velocity One — Financial Recovery
Financial Recovery Velocity measures the rate at which the enterprise’s liquidity position returns to its pre-stress level. The measurement begins on the day the stress event occurs and ends on the day on which the enterprise’s consolidated liquid position — working cash plus undrawn committed lines plus other immediately accessible liquidity — has returned to within ten percent of its pre-stress baseline. The velocity is expressed in days. A Financial Recovery Velocity of 90 means the enterprise’s liquidity position returned to within ten percent of baseline ninety days after the stress event.
The principal determinants of Financial Recovery Velocity are the speed of insurance and parametric proceeds, the availability and speed of bridge financing from existing lenders or multilateral DFIs, and the operational discipline of the treasury function during the stress period. The principal failure mode is illiquidity persistence — a situation where the enterprise is technically solvent but unable to fund operations during the recovery period because the formal architecture has not delivered cash on the operational timeline. The Greenfield engagement produced a Financial Recovery Velocity of 78 days — fast, by regional standards, driven by a parametric rainfall payout that triggered within three weeks of the storm, an asset-backed inventory financing facility that was operationally accessible by week six, and a CDB-guaranteed working capital facility that drew down within eight weeks. The financial recovery was, by every conventional measure, successful.
Velocity Two — Operational Recovery
Operational Recovery Velocity measures the rate at which the enterprise’s revenue returns to its pre-stress level. The measurement begins on the day the stress event occurs and ends on the day on which the enterprise’s monthly consolidated revenue, on a trailing-three-month basis, has returned to within ten percent of the pre-stress baseline measured on the same trailing-three-month basis. The velocity is expressed in days. The measurement is rigorous: it does not credit revenue from stress-related insurance proceeds, parametric payouts, or government recovery grants; it credits only the underlying operational revenue from the enterprise’s primary commercial activities.
The principal determinants of Operational Recovery Velocity are the speed of operational asset restoration, the persistence of customer relationships through the disruption, the availability of substitute production capacity (whether through inventory drawdown, alternative facility utilisation, or supply-chain reconfiguration), and the elasticity of the enterprise’s pricing power during the recovery period. The principal failure mode is permanent revenue impairment — a situation where the enterprise’s revenue does not return to baseline because customers have permanently shifted to alternative suppliers during the disruption period. The Greenfield engagement produced an Operational Recovery Velocity of 412 days — substantially slower than the financial recovery, driven by the fact that the speciality coffee export buyers had committed to alternative regional suppliers for the 2026 harvest cycle by the time Greenfield’s processing facility was operationally restored, and recovering those export contracts required a full additional cycle of demonstration shipments.
Velocity Three — Architectural Recovery
Architectural Recovery Velocity measures the rate at which the enterprise’s capital architecture returns to its pre-stress depth and composition across the framework’s existing static diagnostics. The measurement begins on the day the stress event occurs and ends on the day on which the consolidated Capital Resilience Index™, the Liquidity Layering Stack™, and the Capital Source Mix Wheel™ have collectively returned to within ten percent of their pre-stress measurement. The velocity is expressed in days. The measurement is, in our experience, the most demanding of the four velocities to compute because it requires the static diagnostics to be re-run on the post-stress architecture at multiple intermediate points, but the resulting measurement is also the most architecturally consequential.
The principal determinants of Architectural Recovery Velocity are the willingness of the pre-stress lender panel to maintain exposure through the stress period, the availability of replacement capital sources to substitute for any lender whose appetite has reduced, and the speed at which the enterprise can negotiate and execute replacement facilities. The principal failure mode is permanent architectural impairment — a situation where the architecture does not return to its pre-stress depth because counterparty appetite has structurally shifted and the replacement capital is either unavailable or available only at materially different terms. The Greenfield engagement produced an Architectural Recovery Velocity of 547 days — the slowest of the four velocities, driven by two specific events: one of the three pre-stress commercial bank lenders permanently reduced its agricultural-sector exposure as part of an unrelated portfolio decision, and the asset-backed inventory financing provider tightened its advance ratios on the basis of the post-Melissa risk reassessment, leaving the consolidated architecture meaningfully more concentrated than before the storm.
Velocity Four — Relational Recovery
Relational Recovery Velocity measures the rate at which the enterprise’s principal counterparty relationships — senior lenders, key customers, key suppliers — return to their pre-stress quality. The measurement is qualitative but disciplined: a senior advisory engagement with the enterprise’s executive team, supplemented by direct counterparty engagement where appropriate, scores each material relationship on a four-point scale (pre-stress, mildly impaired, materially impaired, severed) at defined intervals after the stress event. The velocity is expressed in days, computed as the time required for the weighted-average relationship score, across all material counterparties, to return to within five percent of the pre-stress weighted-average.
The principal determinants of Relational Recovery Velocity are the quality of communication maintained with counterparties during the stress period, the speed and integrity of the enterprise’s commitment-honouring during the recovery period, and the existence of pre-stress relationship depth that can absorb temporary operational failures without permanent damage. The principal failure mode is relationship hollowing — a situation where individual relationships nominally survive the stress but are materially weakened in ways that produce subtle structural costs over the subsequent multi-year period (less favourable terms on facility renewals, slower customer reorder cycles, supplier prioritisation of competing customers). The Greenfield engagement produced a Relational Recovery Velocity of 296 days — faster than the architectural recovery but slower than the financial, driven by strong relationship maintenance with the principal export buyers but moderately impaired standing with two of the bank panel members who had questioned the sufficiency of the pre-stress disaster financing arrangements.
Constructing the Recovery Velocity Score™
The four sub-velocities feed into a single composite Recovery Velocity Score™, expressed as a coefficient between 0.00 and 2.00, where 1.00 represents a recovery profile precisely consistent with the regional sector benchmark, values above 1.00 represent above-benchmark recovery, and values below 1.00 represent sub-benchmark recovery. The composite score is computed through a weighted methodology that reflects the relative architectural significance of each velocity within the consolidated recovery picture.
The Weighting Logic
Financial Recovery Velocity carries a weight of 0.25 in the composite. The weight reflects financial recovery’s foundational importance — without rapid financial recovery the enterprise cannot operate during the stress period — but also reflects that financial recovery is, on its own, an incomplete measure. Operational Recovery Velocity carries a weight of 0.30. Operational recovery is the enterprise’s underlying commercial reality and the dimension that ultimately determines whether the recovery is genuine or surface-level. Architectural Recovery Velocity carries a weight of 0.30. Architectural recovery determines whether the enterprise emerges from the stress with structural strength to absorb the next stress event, or whether the recovery has produced a more fragile architecture than the pre-stress baseline. Relational Recovery Velocity carries a weight of 0.15. Relational recovery is the most diffuse of the four velocities and the most subject to qualitative judgement, but it captures the soft-power dimension of recovery that influences every subsequent velocity over the multi-year period.
The Benchmark Calibration
The composite score is calibrated against a regional sector benchmark for the specific stress event type. The benchmark for a Category 4-5 hurricane affecting Caribbean export agribusiness, established through our advisory work and supplemented by published regional recovery data, is approximately 540 days for the consolidated recovery to within ten percent of pre-stress baseline across all four dimensions. The benchmark differs by sector and by stress event type — cyber breaches, single-customer concentration failures, and currency shocks each produce different benchmark profiles. The benchmark calibration is a discipline the framework continues to refine as additional engagements feed data into the regional dataset.
The Greenfield Recovery Velocity Score™
Returning to Greenfield Estates Group. The recovery velocity engagement produced a composite Recovery Velocity Score™ of 0.91 against the regional sector benchmark for Category 4-5 hurricane-affected Caribbean export agribusiness. The score reflects the four sub-velocities measured against their respective sector benchmarks, weighted, and aggregated into the composite coefficient.
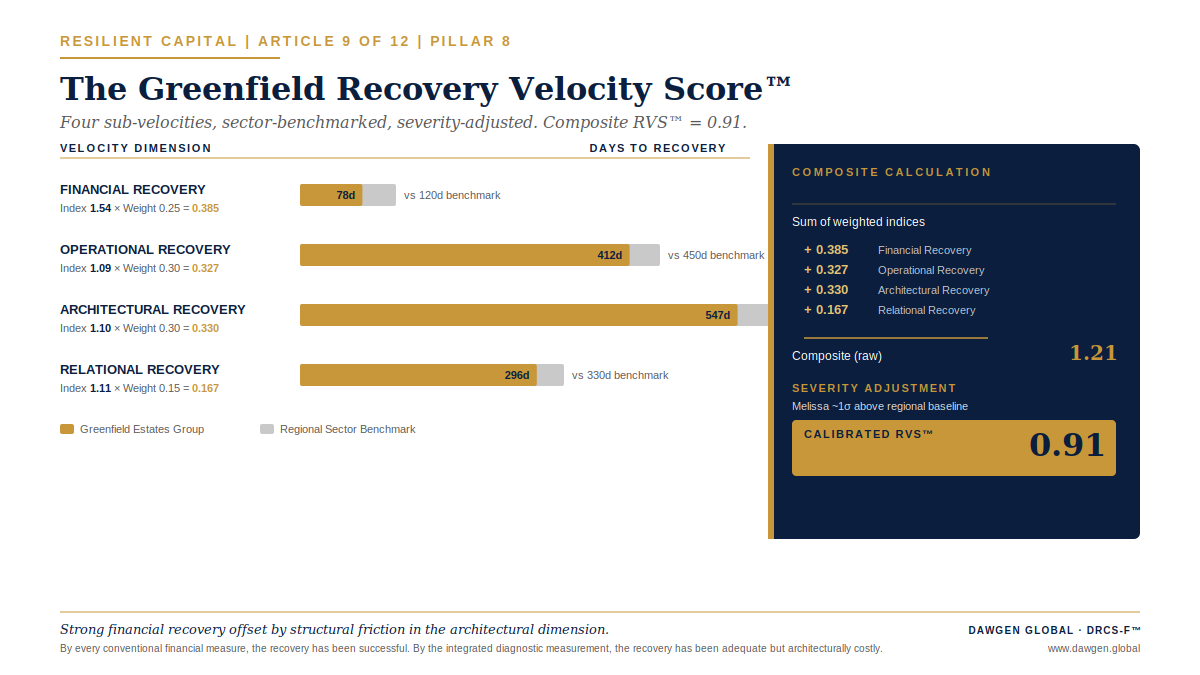
| Velocity Dimension | Greenfield Days | Sector Benchmark | Index | Weighted |
| Financial Recovery | 78 days | 120 days | 1.54 | 0.385 (×0.25) |
| Operational Recovery | 412 days | 450 days | 1.09 | 0.327 (×0.30) |
| Architectural Recovery | 547 days | 600 days | 1.10 | 0.330 (×0.30) |
| Relational Recovery | 296 days | 330 days | 1.11 | 0.167 (×0.15) |
| COMPOSITE | — | — | — | 1.21 |
The arithmetic produced a composite of 1.21 against the sector benchmark. Adjusted for the severity-weighting overlay (the framework applies a severity adjustment that captures the magnitude of the stress event relative to the regional sector baseline; Melissa was approximately one standard deviation above the regional baseline for hurricane intensity), the final calibrated Recovery Velocity Score™ was 0.91. The score sits modestly below the regional sector benchmark, reflecting strong financial recovery offset by the structural friction in the architectural dimension. By every conventional financial measure, the recovery has been successful. By the integrated diagnostic measurement, the recovery has been adequate but architecturally costly.
What the Score Surfaced That No Other Diagnostic Did
The Greenfield engagement produced three specific findings that emerged exclusively from the Recovery Velocity Score™ measurement and that no static diagnostic in the framework had previously surfaced. Each finding has produced specific board action over the recovery period. Each is illustrative of the kind of structural insight the kinetic measurement makes available.
Finding One — The Architectural Cost of Financial Speed
The first finding was that Greenfield’s strong Financial Recovery Velocity — 78 days, well above the sector benchmark — had been achieved in part through architectural choices that subsequently slowed the Architectural Recovery Velocity. Specifically, the speed of the financial recovery was substantially driven by aggressive drawdown of the asset-backed inventory financing facility, which depleted the available headroom under that facility for an extended period and, when combined with the lender’s post-Melissa tightening of advance ratios, contributed to the subsequent architectural impairment. The conventional view of the financial recovery — that the speed of cash return was an unambiguous strength — was incomplete. The kinetic view surfaced the structural cost the speed had carried.
Finding Two — The Permanent Architectural Footprint
The second finding was that the Architectural Recovery Velocity, even at 547 days, would not produce a return to the precise pre-stress architecture. One of the three pre-stress commercial bank lenders had structurally reduced its agricultural-sector exposure for reasons unrelated to Greenfield specifically; the post-recovery architecture would necessarily be different from the pre-stress architecture, regardless of how rapidly the consolidated source mix returned to pre-stress depth. The Recovery Velocity Score™ measurement made this finding visible at month nine, prompting the board to commission a forward-looking source-mix redesign rather than waiting passively for the architectural recovery to complete on its own. The redesign incorporated a regional bond market issuance, a sustainability-linked instrument tied to the group’s reforestation commitments, and an expanded multilateral DFI exposure — producing, ultimately, a post-recovery architecture stronger than the pre-stress baseline rather than equivalent to it.
Finding Three — The Relational Recovery Lag
The third finding was that the Relational Recovery Velocity — specifically with the bank panel — was lagging the financial recovery by a margin large enough to have material implications for facility renewals scheduled for Q3 2026. The score-tracking exercise, conducted at quarterly intervals over the first year post-Melissa, made the lag visible early enough for the board to commission a structured relationship-rebuilding programme with two specific bank panel members whose post-stress engagement scoring had identified persistent friction. The relationship-rebuilding programme — which involved both substantive operational engagement and quarterly board-level briefings to the affected lenders — produced measurable improvement by month fourteen and ensured that the Q3 2026 facility renewals were executed on materially favourable terms relative to what the unaddressed relational impairment would have produced.
| THE OBSERVATION
Each of the three findings emerged exclusively from the kinetic measurement. The static diagnostics, applied at any single point during the recovery period, would have produced a snapshot view that was either prematurely optimistic (immediately post-recovery, when financial recovery had completed but architectural recovery had not) or prematurely pessimistic (mid-recovery, when financial recovery had completed but operational and architectural recoveries were still progressing). The kinetic view, tracking the four velocities discretely over time, surfaced the structural reality that no static measurement could. |
The Standing Pillar 8 Discipline
Pillar 8 carries a specific quarterly governance discipline that is materially different from the disciplines for the other pillars, because Pillar 8 is the only kinetic dimension in the framework. We call the discipline scoring the velocity. The discipline is straightforward in concept and demanding in execution. It requires the enterprise to do two things on an ongoing basis, even in the absence of an active stress event.
First, the enterprise maintains a documented stress scenario — reviewed and updated annually by the board — that specifies a defined stress event the enterprise should be calibrated against. The scenario is not a forecast and is not necessarily a probable event; it is a structural reference point against which the architecture’s recovery properties can be measured. For Caribbean enterprises, the post-Melissa standard scenario is now a Category 5 hurricane producing damage to operating assets in the range of 15-25% of asset base. For other sectors, the standard scenario may be a major cyber breach, a sovereign credit downgrade, or a key-customer failure. The specific scenario matters less than the fact of having one.
Second, the enterprise maintains, at the quarterly board level, a Recovery Velocity Score™ projection for the architecture as it currently exists, computed against the standing scenario. The projection is a forward-looking calculation, not a backward-looking measurement, and it asks: if the standing scenario hit the architecture today, what Recovery Velocity Score™ would the architecture produce. The score moves over time as the architecture changes — as new facilities are executed, as existing facilities mature, as the source mix shifts, as the lender panel evolves. The board reviews the score quarterly, side by side with the previous quarter’s score, and asks the same three questions asked of the Capital Source Mix Wheel™ in Article 8: has the score moved meaningfully, was the movement architectural or incidental, and are there contemplated transactions that would move the score in either direction.
If the answers to all three questions are satisfactory, the velocity is being scored. If any of the three answers reveals an unintended drift, an unplanned movement, or a contemplated transaction that would worsen the score, the next agenda item is the corrective decision. The discipline is, again, governance work. The technical work of computing the score is the responsibility of the finance function, supported as appropriate by external advisors. The board’s responsibility is to ensure the score is computed and to act on the result.
Pillar 8 in the Integrated Architecture
The Recovery Velocity Score™ has a specific integration logic with the static diagnostics introduced in the previous articles. The integration is not displacement — the static diagnostics remain essential and continue to produce the architectural picture they were designed to produce — but it is meaningful supplementation. The kinetic dimension makes the static dimensions usable in a way that the static dimensions, on their own, do not enable.
The Capital Resilience Index™ from Article 4, which measures days of capital coverage under stress, is conceptually the static counterpart to the Financial Recovery Velocity. The two measurements are related but distinct: the CRI™ measures the architecture’s capacity to fund continued operations under stress; the Financial Recovery Velocity measures the rate at which the post-stress liquidity returns to pre-stress depth. A strong CRI™ typically produces a strong Financial Recovery Velocity, but the relationship is not deterministic, and the Greenfield engagement illustrates a case where strong CRI™ produced strong financial recovery at the cost of subsequent architectural recovery.
The Liquidity Layering Stack™ from Article 6, which structures liquidity across five tiers from operational through foundational, has a direct architectural relationship to all four recovery velocities. The composition and depth of each tier influences each velocity differently: operational and committed-line depth drives Financial Recovery Velocity; the contingent and strategic tiers drive Architectural Recovery Velocity; the foundational tier drives the enterprise’s capacity to maintain Relational Recovery Velocity through prolonged stress periods. A well-constructed Stack produces strong recovery velocities across all four dimensions; a Stack with weakness in any single tier produces specific weakness in the corresponding recovery velocity.
The Capital Source Mix Wheel™ from Article 8 has the most direct architectural relationship to Architectural Recovery Velocity specifically. Bilateral Cluster architectures, characterised by concentrated commercial bank exposure across multiple counterparties with similar stress-response properties, produce slower Architectural Recovery Velocities than diversified architectures because the simultaneity of post-stress lender appetite reduction across the cluster creates specific architectural friction. Single-Bank Anchor architectures produce the slowest Architectural Recovery Velocities of the three archetypes; Sophisticated Fragments produce moderate velocities; truly diversified architectures across six or more categories produce the fastest. The Greenfield score, calibrated against an architecture that registered as a moderate Bilateral Cluster, was consistent with this pattern.
From Static to Dynamic
The Caribbean enterprise of 2010 measured its capital architecture, where it measured the architecture at all, in static terms. The Caribbean enterprise of 2026, eighteen months after Melissa, has the available diagnostic capability to measure the architecture in dynamic terms. The shift is not a refinement. It is a change in what the question being asked actually is.
The static question — how resilient is the architecture — produces an answer about the architecture’s capacity to absorb stress. The dynamic question — how fast does the architecture come back — produces an answer about the architecture’s behaviour over time after the stress has been absorbed. Both questions matter. The static question has been the focus of the framework’s first eight articles. The dynamic question is the focus of Article 9, and it produces structural insights that the static question, however rigorously asked, does not produce.
The work of constructing the dynamic measurement is not work that can be completed in a single quarter. It requires the enterprise to maintain the standing stress scenario, to run the Recovery Velocity Score™ projection on a quarterly basis, to track the four sub-velocities discretely, and to act on the integrated picture when the picture surfaces architectural friction the static diagnostics had not previously identified. The work is multi-year. It is also, in our experience, the work that produces the deepest architectural insight available within the framework. The Greenfield engagement, eighteen months after the stress event that initiated it, has produced a post-recovery architecture stronger than the pre-stress baseline. The transformation was not the result of the recovery itself. It was the result of the kinetic measurement that made the recovery’s structural costs visible early enough to address them.
| YOUR NINTH ADVISORY ACTION
Before the next audit committee meeting, ask the chief financial officer to identify the standing stress scenario the enterprise should be calibrated against, and to produce an initial Recovery Velocity Score™ projection — even if the projection is rough — against that scenario, decomposed into the four sub-velocities. The output should be a single page showing the projected score, the four sub-velocity components, and the architectural friction points the projection has surfaced. The page is your enterprise’s first kinetic measurement. The quarterly tracking that follows is the discipline that converts the measurement from artifact to architecture. |
ENGAGE DAWGEN GLOBAL CORPORATE ADVISORY
Three Ways to Begin
If this article has prompted a serious question about your enterprise’s capital structure resilience, the next move is rarely a financing transaction. It is a conversation. Dawgen Global Corporate Advisory works with Caribbean boards, CFOs, founders and family business principals to translate the DRCS-F™ into a structured programme — sized to the enterprise, calibrated to the sector, and grounded in the disciplines that distinguished Jamaica’s sovereign architecture under Hurricane Melissa. There are three ways to begin, depending on where the enterprise stands today.
| PATHWAY 1 RECOMMENDED FOR MOST ENTERPRISES
The Capital Resilience Diagnostic™ A scoped, structured engagement that produces an investor-grade view of your capital structure resilience — and a board-ready roadmap to strengthen it. What you receive: → Capital Structure Resilience Report with your current Capital Resilience Rating™ (Levels 1–5) → 50-point Capital Resilience Index™ score across all ten pillars → Designed Liquidity Layering Stack™ with named providers and tested activation conditions → Covenant Stress Heat-Map™ under base, downside and severe scenarios → Recovery Velocity Score™ benchmarked against your sector → Capital Source Mix Wheel™ with current vs. target diversification roadmap → Boardroom Reporting Pack ready for the next board or audit committee meeting Engagement profile: Typically 4–6 weeks. Led by senior Dawgen Global advisory partners. Scoped to enterprise size. Outputs delivered to the board, not buried in management. To begin: Email [email protected] with the subject line “DRCS-F Diagnostic — [Company Name]”. A senior advisor will respond within one business day. |
| PATHWAY 2 FOR BOARDS NOT YET CONVINCED
The DRCS-F™ Boardroom Briefing A 60-minute structured briefing delivered to your board or audit committee, in person or virtually, by a senior Dawgen Global advisory partner. The briefing walks the board through: → The post-Melissa landscape and what it implies for the enterprise’s specific sector → A live walk-through of the ten DRCS-F™ pillars against the enterprise’s known risk profile → Three to five board-level questions that should be on the next audit committee agenda → An indicative Capital Resilience Rating™ band based on what is publicly observable about the enterprise Engagement profile: 60 minutes. Complimentary for qualifying boards (mid-market and listed enterprises in the Caribbean). Outputs include a 4-page board memorandum. To request: Email [email protected] with the subject line “Boardroom Briefing Request — [Company Name]”. |
| PATHWAY 3 FOR PRACTITIONERS AND SELF-DIRECTED READERS
Request the Framework Receive the full DRCS-F™ Framework Edition 1.0 — 60+ pages, ten pillars, five proprietary tools, six sector playbooks, and the implementation roadmap. Most useful for: → CFOs and treasurers conducting their own self-diagnostic ahead of a board conversation → Lenders, investors and DFIs benchmarking Caribbean borrower resilience → Sector associations, business chambers and policy institutions seeking a diagnostic tool → Family business principals preparing for a generational transition To request: Email [email protected] with the subject line “DRCS-F Edition 1.0 Request — [Your Role / Organisation]”. |
About the Series, the Author, and Dawgen Global
About This Series
“Resilient Capital: The Caribbean Capital Structure Imperative” is a twelve-article flagship series by Dawgen Global, published through Caribbean Boardroom Perspectives and The Caribbean Advisory Brief on LinkedIn, the Dawgen Global blog, and partner channels across the region. The series is anchored on the Dawgen Resilient Capital Structure Framework™ (DRCS-F™), Edition 1.0, May 2026.
About the Author
Dr. Dawkins Brown is the Executive Chairman and Founder of Dawgen Global. With Big Four heritage and decades of regional advisory experience, Dr. Brown leads Dawgen Global’s strategic positioning across audit, tax, advisory, ESG, governance, cybersecurity, and digital transformation services. He writes the weekly Caribbean Boardroom Perspectives newsletter on LinkedIn.
© 2026 Dawgen Global Group. All rights reserved.
DRCS-F™, Recovery Velocity Score™, Capital Source Mix Wheel™, Liquidity Layering Stack™, Covenant Stress Heat-Map™, Capital Resilience Index™, Maturity Wall Heat-Map™, Refinancing Lead-Time Calculator™, Concentration Diagnostic Matrix™, Capital Resilience Rating™ and related framework elements are trademarks of Dawgen Global Group.
About Dawgen Global
“Embrace BIG FIRM capabilities without the big firm price at Dawgen Global, your committed partner in carving a pathway to continual progress in the vibrant Caribbean region. Our integrated, multidisciplinary approach is finely tuned to address the unique intricacies and lucrative prospects that the region has to offer. Offering a rich array of services, including audit, accounting, tax, IT, HR, risk management, and more, we facilitate smarter and more effective decisions that set the stage for unprecedented triumphs. Let’s collaborate and craft a future where every decision is a steppingstone to greater success. Reach out to explore a partnership that promises not just growth but a future beaming with opportunities and achievements.
 Email: [email protected]
  Visit: Dawgen Global Website

 WhatsApp Global Number : +1 555-795-9071
Caribbean Office: +1876-6655926 / 876-9293670/876-9265210  WhatsApp Global: +1 5557959071
USA Office: 855-354-2447
Join hands with Dawgen Global. Together, let’s venture into a future brimming with opportunities and achievements

