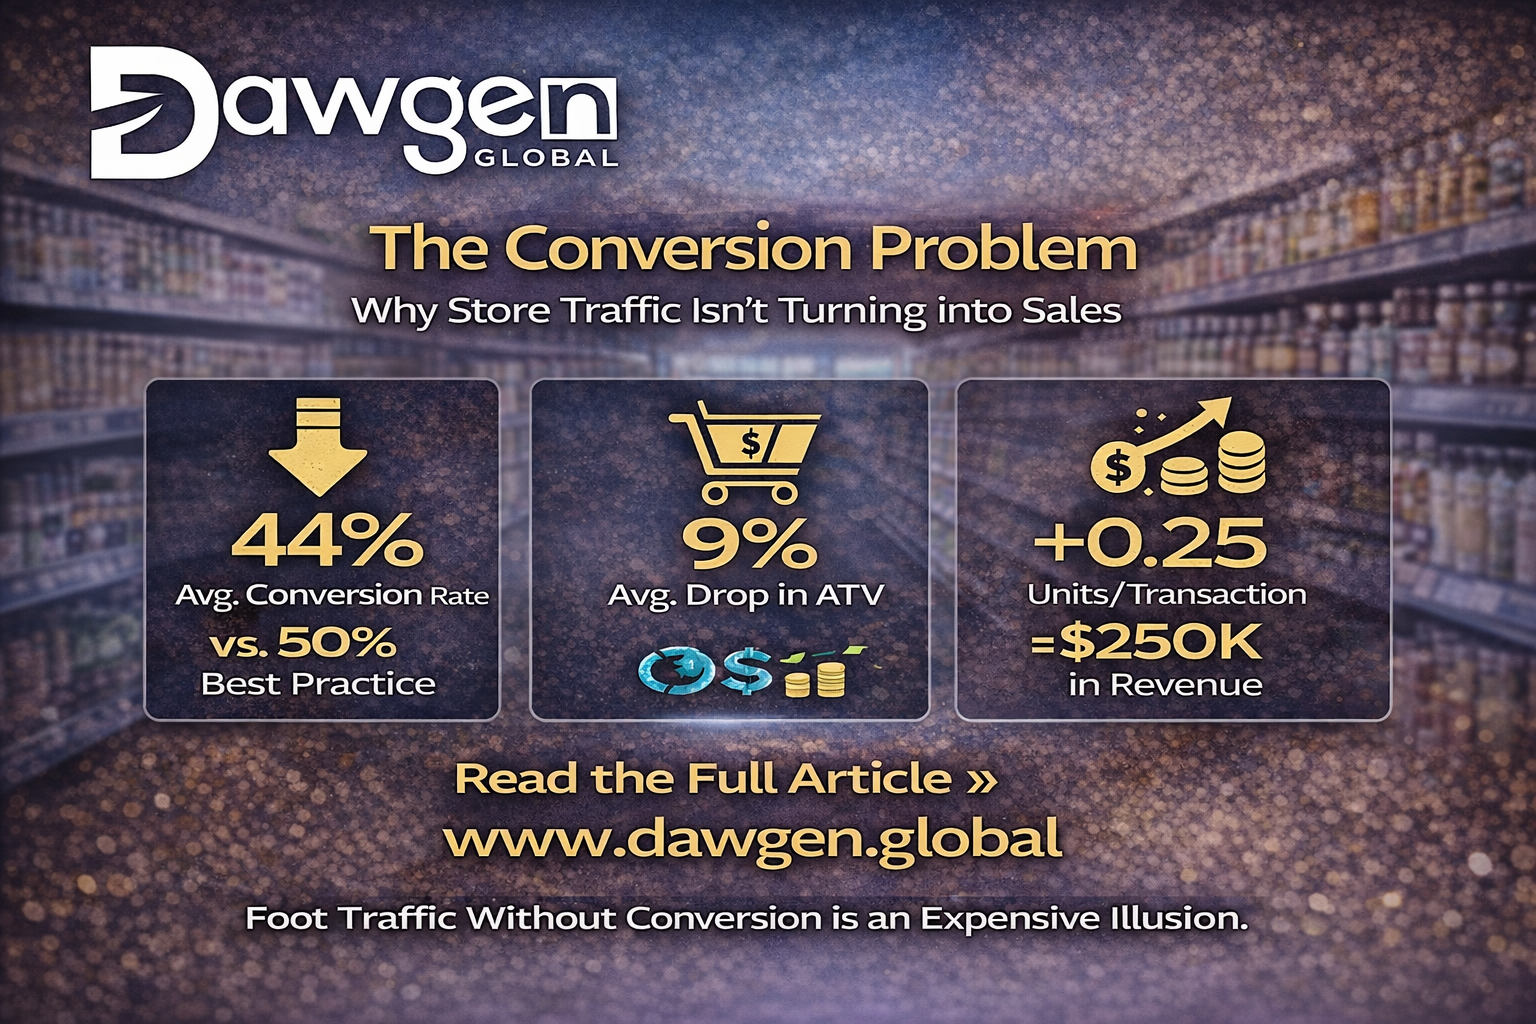
Foot traffic without conversion is an expensive illusion. SALESVECTOR™ quantifies the gap between who walks through your door and what they leave with — and builds the structured path to close it.
Every Caribbean retailer counts their customers — at least informally. They see the queues at the register, feel the energy of a busy trading floor, and draw comfortable conclusions about how well the business is performing. What almost none of them count, with the rigour the question deserves, is the proportion of those customers who walk out without buying anything. Or who buy significantly less than the store’s category mix and promotional architecture should be generating. That gap — between the customers who enter and the revenue they could plausibly generate — is the conversion problem. And across the Caribbean retail sector, it is one of the most consistently underestimated profit opportunities available.
The SALESVECTOR™ model within the D·RIS™ framework is built around a single organising insight: that sales performance analysis, in most Caribbean retail businesses, stops at the top line. Revenue is measured. Revenue growth or decline is noted. And the management response is largely intuitive — stock more of what sells, promote harder when sales are soft, add staff when it gets busy. These are not unreasonable responses. But they are responses without a diagnostic foundation. They address symptoms without establishing causes. And they leave the most significant revenue improvement levers — conversion rate, average transaction value, units per transaction, sales density — largely untouched.
The Five Core Metrics of Sales Performance
Conversion Rate
Conversion rate is the percentage of customer visits — foot traffic events — that result in a purchase transaction. It is the foundational metric of retail sales performance because it captures the effectiveness of everything the retailer does to convert presence into purchase: the merchandising, the staff engagement, the product availability, the pricing, the promotional execution. A well-run Caribbean supermarket should be converting at 44–48%. A fashion retailer at 22–28%. A pharmacy at 52–58%. Every point of conversion rate below benchmark represents a customer who entered your store, failed to find sufficient reason to buy, and left — taking their money to a competitor or simply not spending it at all.
Average Transaction Value
Average transaction value (ATV) is the mean value of all completed transactions in a given period. It reflects the depth of purchase per customer visit — how much of their available wallet the retailer captures in each interaction. ATV is influenced by range breadth, promotional effectiveness, upselling and cross-selling behaviour, pricing strategy, and the ease of finding complementary products. Caribbean retailers in the SALESVECTOR™ dataset consistently show ATVs running 8–14% below the modelled optimal for their category mix and price positioning.
Units Per Transaction
Units per transaction (UPT) is the average number of items purchased per completed transaction — the most direct measure of basket depth. Low UPT is a diagnostic indicator of multiple potential causes: poor cross-merchandising, inadequate promotional packaging, stock availability gaps in complementary categories, or staff not trained to suggest related purchases. A single UPT improvement of 0.3 items per transaction, across one hundred thousand annual transactions, generates thirty thousand additional item sales.
Sales Per Square Foot
Sales per square foot is the measure of spatial productivity — how efficiently the retailer converts physical floor space into revenue. Caribbean retailers with underperforming sales density are typically allocating disproportionate space to low-velocity categories and insufficient space to high-velocity, high-margin product. The SALESVECTOR™ space productivity analysis identifies the specific reallocation opportunities and models their revenue impact.
Sales Target Achievement
Sales target achievement measures the consistency with which the business delivers against its revenue plan — by location, by category, by period, and by team. It is both a performance metric and a management quality indicator. SALESVECTOR™ distinguishes between random versus systematic misses, whether concentrated in specific periods or categories, and whether they indicate market factors or internal execution failures.
| The difference between a retail business generating USD 18 million and one generating USD 21 million is often not more customers, more locations, or a better product range. It is a 3-percentage-point improvement in conversion rate, a 9% improvement in ATV, and a 0.25-unit improvement in UPT. SALESVECTOR™ quantifies exactly where those improvements are available — and structures the path to capturing them. |
The Upselling and Cross-Selling Deficit
Among the ten SALESVECTOR™ dimensions, the upselling and cross-selling audit consistently produces the most significant findings. The deficit is not a function of staff unwillingness. In most cases, front-line retail staff in the Caribbean are personable, customer-oriented, and genuinely motivated to be helpful. The deficit is a function of system and training failures: staff who have not been trained in the specific language and approach of effective upselling, who have no visibility of complementary product recommendations at the point of customer interaction, who are not incentivised to drive basket depth, and who operate in a physical environment where cross-merchandising has not been structured to prompt multi-product purchase. The SALESVECTOR™ audit examines all four dimensions — training, information systems, incentive design, and physical cross-merchandising — and produces a structured improvement plan. Businesses implementing this plan consistently report ATV improvements of 6–11% within the first ninety days.
Hourly Sales Pattern Analysis: The Hidden Scheduling Lever
The hourly sales pattern analysis examines the distribution of sales, transaction volumes, and conversion rates across trading hours and trading days, comparing this pattern against the current staffing model. What the analysis almost always reveals is a significant mismatch between peak trading periods and peak staffing levels. Caribbean retailers — particularly in grocery and pharmacy — typically see their highest transaction volumes between 11am and 2pm, between 4pm and 7pm, and on Friday and Saturday. Yet their staffing models, designed around administrative convenience rather than trading pattern optimisation, frequently have insufficient front-line capacity precisely at these peak periods. The consequence is threefold: queue times increase, reducing conversion and degrading customer experience; sales floor coverage decreases; and staff stress levels rise, affecting service quality and contributing to turnover.
| SALESVECTOR™ Revenue Impact Modelling
Every SALESVECTOR™ assessment produces a three-scenario revenue impact model — conservative, base, and stretch — quantifying the revenue impact of closing identified performance gaps. The model is built from the client’s actual transaction data and benchmarked against Caribbean sector performance norms. For a business generating USD 20 million annually, a SALESVECTOR™ improvement programme targeting conversion rate, ATV, and UPT gaps typically models a base-case revenue uplift of USD 1.4 million to USD 2.1 million — achievable within an eighteen-month improvement cycle. |
The Sales Incentive Effectiveness Question
Sales incentive programmes are widely used across Caribbean retail — and widely misdesigned, inconsistently applied, and poorly evaluated for effectiveness. The SALESVECTOR™ incentive audit examines the current incentive architecture against a structured framework covering alignment (does the incentive reward behaviours that actually drive business value, or the easiest-to-game metric?), clarity (do front-line staff understand the scheme well enough to modify their behaviour?), achievability (are targets calibrated to stretch without disengaging?), and measurement (is the programme being evaluated for its commercial return?). In most Caribbean retail businesses, at least two of these four dimensions are materially deficient.
From Data to Action: The 90-Day SALESVECTOR™ Programme
The SALESVECTOR™ assessment produces a Sales Optimisation Scorecard alongside the revenue impact model, the conversion gap analysis, and the ninety-day action plan. Priority one (thirty days): quick wins requiring no capital investment — upselling language training, cross-merchandising adjacency improvements, scheduling rebalance to address peak period gaps, and sales target communication improvements. These initiatives typically generate measurable ATV and conversion improvements within four to six weeks. Priority two (thirty to sixty days): structural improvements — incentive programme revisions, sales performance dashboard implementation, and category space reallocation. Priority three (sixty to ninety days): capability investments — POS reporting improvements, training programme build, and the ongoing sales intelligence monitoring framework. Businesses completing the full SALESVECTOR™ programme consistently report score improvements of 14 to 22 points — and the revenue: conversion rates that have moved, ATVs that have grown, and trading pattern management that has visibly improved.
| How Dawgen Global Can Help
Dawgen Global’s advisory team works with retail enterprises across the Caribbean to implement the strategies and frameworks outlined in this article. Using our proprietary Dawgen Retail Intelligence Suite (D·RIS™), we deliver structured, scored, and benchmarked assessments across all fifteen dimensions of retail performance — translating findings into financially-quantified improvement plans that management teams can execute with confidence. Our engagements are governed by the Dawgen Retail Assurance Methodology™ (D·RAM) — a rigorous five-phase cycle that moves from assessment through to measurable, sustained improvement — and every engagement contributes to your composite Dawgen Retail Health Index™ (D·RHI) score: the Caribbean’s first independent retail health rating. To request a complimentary D·RIS™ Framework Briefing or discuss how Dawgen Global can support your retail business:
|
About Dawgen Global
“Embrace BIG FIRM capabilities without the big firm price at Dawgen Global, your committed partner in carving a pathway to continual progress in the vibrant Caribbean region. Our integrated, multidisciplinary approach is finely tuned to address the unique intricacies and lucrative prospects that the region has to offer. Offering a rich array of services, including audit, accounting, tax, IT, HR, risk management, and more, we facilitate smarter and more effective decisions that set the stage for unprecedented triumphs. Let’s collaborate and craft a future where every decision is a steppingstone to greater success. Reach out to explore a partnership that promises not just growth but a future beaming with opportunities and achievements.
 Email: [email protected]
  Visit: Dawgen Global Website

 WhatsApp Global Number : +1 555-795-9071
Caribbean Office: +1876-6655926 / 876-9293670/876-9265210  WhatsApp Global: +1 5557959071
USA Office: 855-354-2447
Join hands with Dawgen Global. Together, let’s venture into a future brimming with opportunities and achievements

