The Machine That Learns How Your Customers Pay
In Article 3 of this series, we introduced the P-Layer of the WC-PULSE Framework™ and described how it transforms the traditional 13-week cash-flow forecast from a static spreadsheet into a dynamic, scenario-driven prediction engine. We explained the four pillars – rolling architecture, behavioural modelling, scenario stress-testing, and trigger integration – and quantified the results: 30 to 45 per cent improvement in forecast accuracy, 8 to 15 per cent working-capital release, and 40 to 60 per cent reduction in emergency borrowing costs.
What we did not explain was how it works under the hood. This article opens the engine compartment. It reveals the technology architecture that powers the P-Layer, explains the machine-learning models that predict customer payment behaviour, describes the data pipeline that feeds the system, and – most importantly – provides a pragmatic roadmap for CFOs and CIOs who want to bring AI-powered cash forecasting into their organisations without the hype, the complexity, or the multi-million-dollar price tag that enterprise AI projects typically carry.
This is not a technology article for technologists. It is a technology article for finance leaders who need to understand what is possible, what is practical, and what is worth the investment.
The goal is not to build the most sophisticated AI system. It is to build the most useful one – a system that makes the 13-week forecast accurate enough to trust and actionable enough to matter.
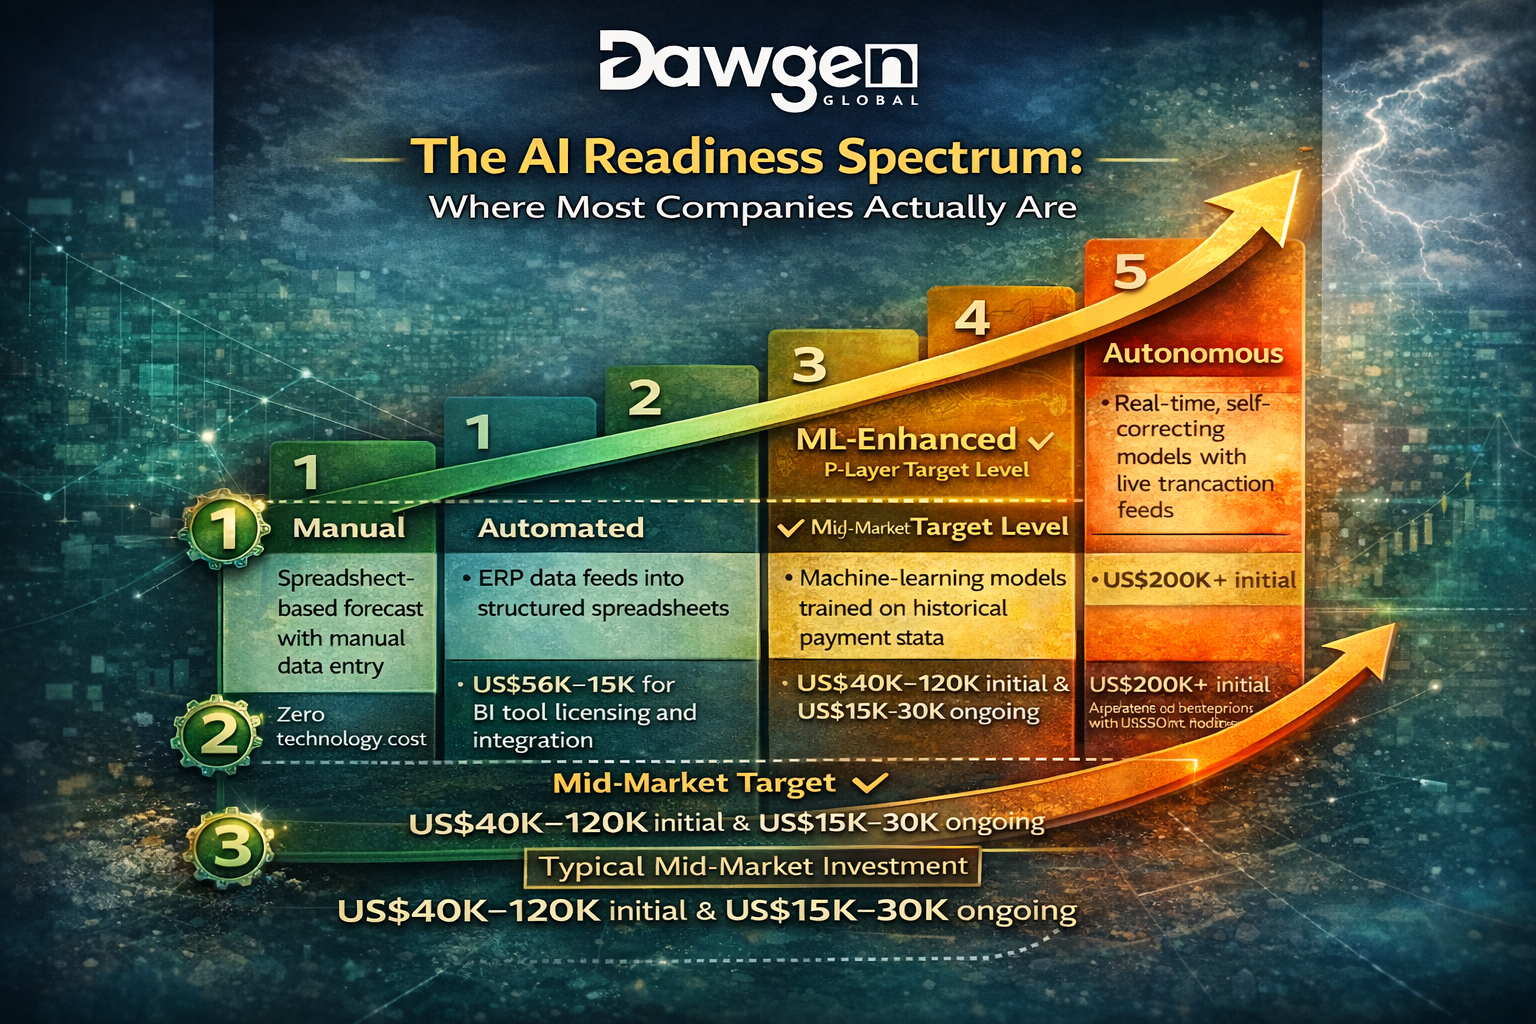
The AI Readiness Spectrum: Where Most Companies Actually Are
Before discussing the technology, it is essential to establish a realistic baseline. The conversation around AI in finance is dominated by vendor marketing, conference keynotes, and case studies from Fortune 100 companies with dedicated data-science teams and eight-figure technology budgets. This creates a distorted picture that leads mid-market CFOs to one of two conclusions: either AI is too complex and expensive for their organisation, or they need to replicate what the largest enterprises have built.
Both conclusions are wrong. The reality is that AI-powered cash forecasting exists on a spectrum, and meaningful value can be captured at every level – including levels that require no data scientists, no dedicated infrastructure, and no custom model development.
| Level | Classification | Technology Characteristics | Typical Investment |
| 1 | Manual | Spreadsheet-based forecast with manual data entry. No automation, no models, no scenario capability. The analyst is the algorithm. | Zero technology cost. High labour cost. Low accuracy. |
| 2 | Automated | ERP data feeds into a structured spreadsheet or BI dashboard. Formulas automate calculations, but assumptions are static. No machine learning. | US$5K–15K for BI tool licensing and integration. Moderate labour savings. |
| 3 | Rules-Based | Automated feeds plus rule-based adjustments: if customer X paid late 3 of the last 4 months, adjust their expected payment date by 7 days. No statistical modelling but codified institutional knowledge. | US$15K–40K. Rules maintained by the FP&A team. Significant accuracy improvement over Level 2. |
| 4 | ML-Enhanced | Machine-learning models trained on historical payment data. Probabilistic payment forecasts by customer. Automated anomaly detection. Scenario engine with CFaR output. This is the P-Layer target state. | US$40K–120K initial build. US$15K–30K annual maintenance. Delivered through PULSE implementation. |
| 5 | Autonomous | Real-time, self-correcting models with live transaction feeds, NLP-driven contract analysis, and automated trigger-response execution. Continuous learning from forecast errors. | US$200K+ initial. Requires dedicated data engineering. Appropriate for enterprises with US$500M+ revenue. |
Most mid-market organisations sit at Level 1 or Level 2. The WC-PULSE Framework’s P-Layer is designed to bring them to Level 4 – ML-Enhanced – within the 90-day implementation timeline, at a cost that is recoverable from the working-capital improvements identified in the first two weeks. Level 5 is achievable but is typically a Phase 2 objective for organisations that have operated the Level 4 system for at least six months and want to push further.
The critical insight is that the jump from Level 1 to Level 3 – from manual to rules-based – captures approximately 60 per cent of the total accuracy improvement available. The jump from Level 3 to Level 4 – adding machine learning – captures another 25 per cent. And the jump from Level 4 to Level 5 captures the remaining 15 per cent at significantly higher cost. For most organisations, Level 4 represents the optimal balance of capability and investment.
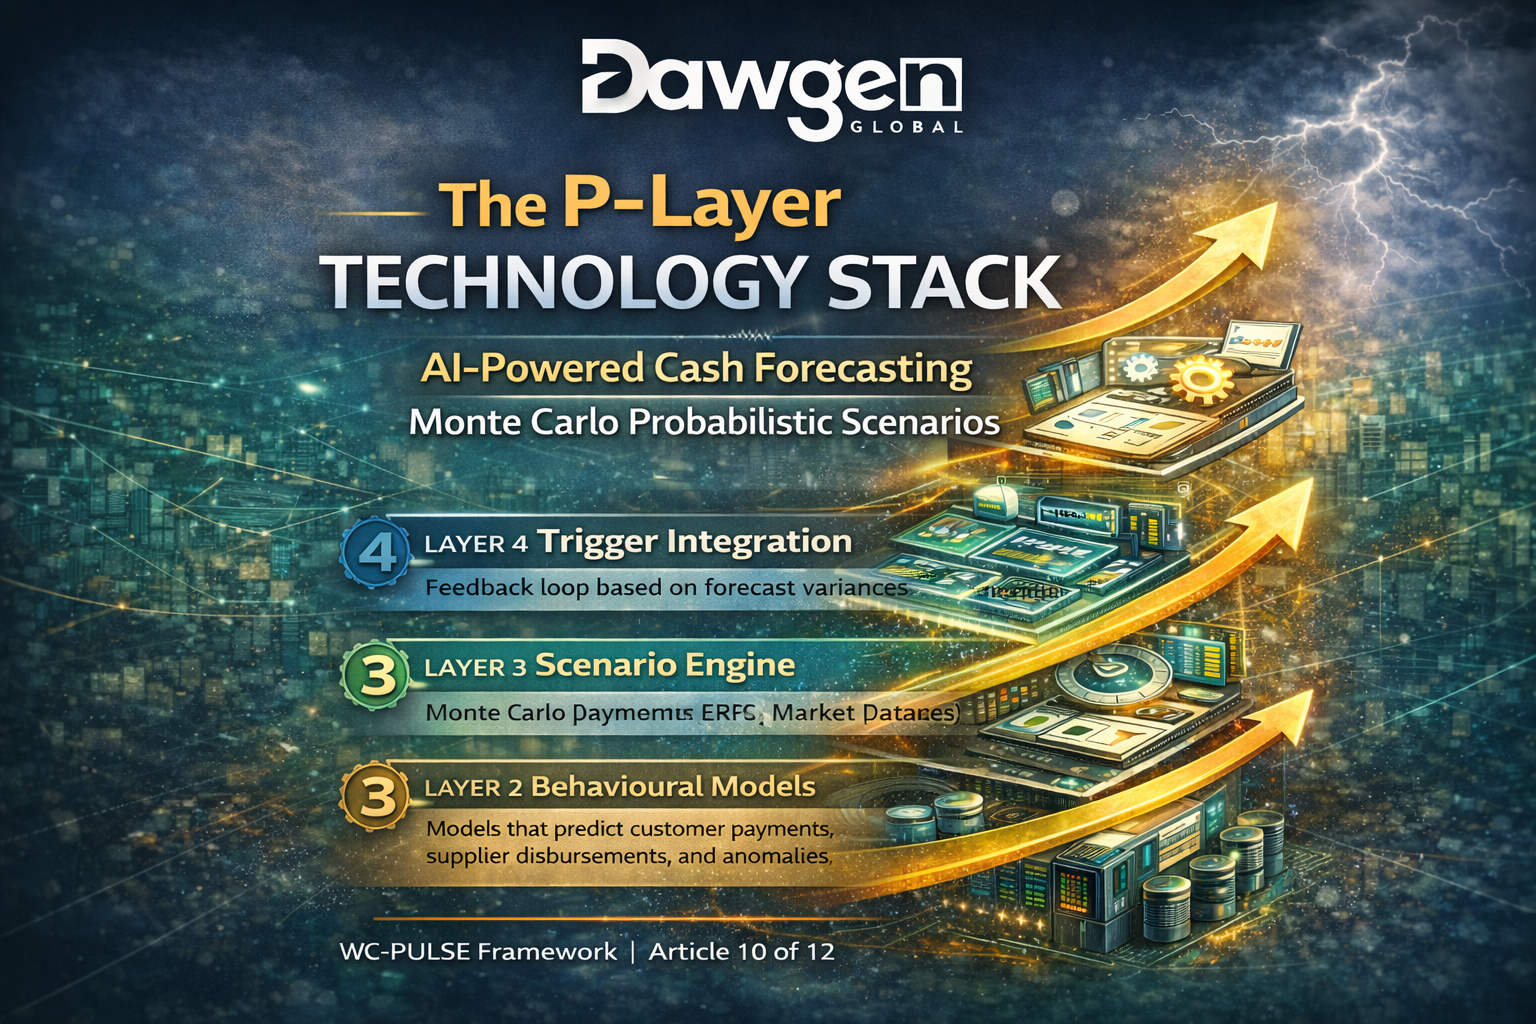
The P-Layer Technology Stack
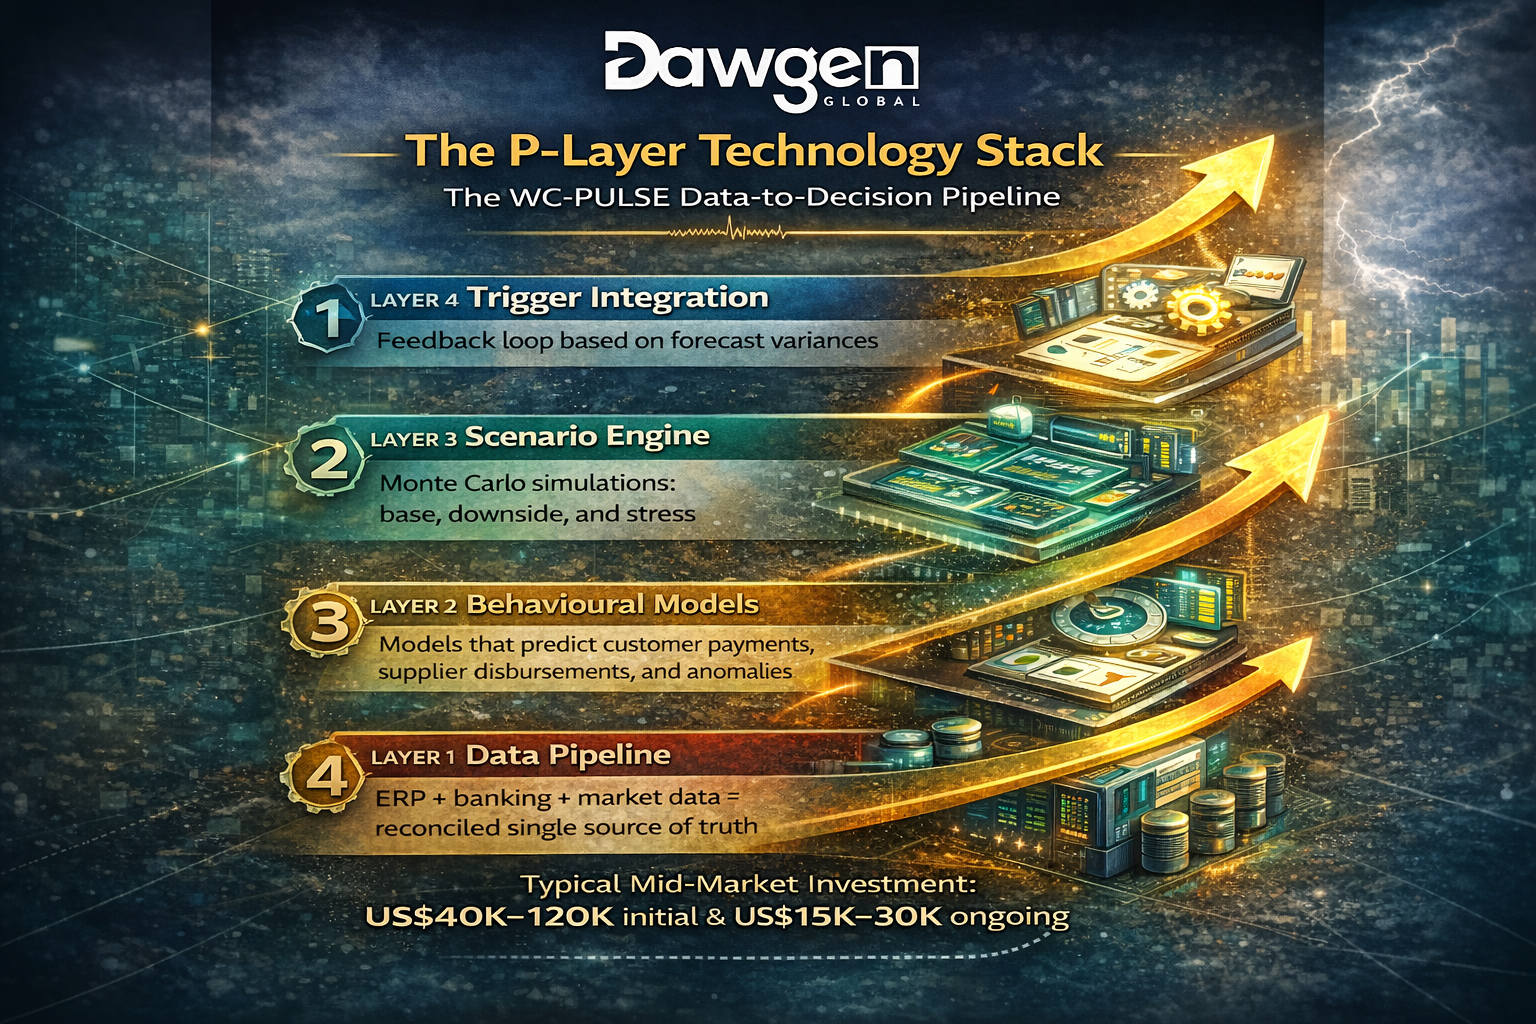
The P-Layer’s technology architecture consists of four layers, each performing a distinct function in the data-to-decision pipeline.
Layer 1: The Data Pipeline
The foundation of any AI system is its data. The P-Layer requires three primary data feeds, each of which connects to the client’s existing systems through standard integration protocols.
- ERP Feed: The primary source of transactional data. The pipeline extracts accounts-receivable line items (invoice date, due date, amount, customer, payment status, payment date), accounts-payable line items (same fields for the payables side), inventory movements, and general-ledger balances. The integration typically uses the ERP’s native API or, for older systems, a scheduled database extract. SAP, Oracle, Microsoft Dynamics, NetSuite, and Sage all have well-documented extraction methods that the PULSE implementation team has standardised.
- Banking Feed: Daily cash balances, transaction flows, and facility utilisation from the company’s primary banking platform. Most commercial banks now offer API-based data access through open-banking protocols or proprietary treasury-management interfaces. Where API access is not available, the pipeline accepts structured file uploads in BAI2, MT940, or CSV format.
- Market-Data Feed: Exchange rates, benchmark interest rates, and commodity indices for the E-Layer’s macro-sensitivity calculations. These feeds are sourced from public data providers and updated daily. The integration is lightweight – typically a simple API call to a free or low-cost market-data service.
The data pipeline normalises, validates, and reconciles these three feeds into a unified data model that serves as the single source of truth for all PULSE calculations. The reconciliation step is critical: as we discovered in the Caribbean Industrial Holdings case study in Article 8, discrepancies between ERP and banking data are common and can distort forecast accuracy by 10 to 15 per cent if left undetected.
Layer 2: The Behavioural Models
The second layer is where the machine learning resides. The P-Layer uses three distinct model types, each designed to predict a specific dimension of cash-flow behaviour.
- Customer Payment-Behaviour Model: This is the core model and the one that delivers the most forecast-accuracy improvement. It is trained on the client’s historical receivables data – typically 18 to 36 months of invoice-level records – to learn the payment patterns of each customer. The model considers invoice amount, product line, day of week, month of year, historical payment variability, and – where available – the customer’s credit indicators. The output is a probabilistic payment forecast for each open invoice: a distribution of likely payment dates with associated confidence levels. For a typical receivables book of 200 to 500 active customers, the model generates meaningful individual-customer predictions for the top 50 to 100 accounts (which typically represent 80 to 90 per cent of total receivables) and applies segment-level averages for the long tail.
- Supplier Disbursement Model: The mirror-image model for the payables side. It predicts when the organisation will actually make payments to suppliers, accounting for early-payment-discount opportunities, payment-run schedules, approval-process delays, and the historical gap between invoice due date and actual payment date. This model is typically simpler than the customer model because the organisation controls its own payment timing, but it captures the systematic patterns that manual forecasting misses.
- Anomaly Detection Model: An unsupervised learning model that monitors the incoming data streams for unusual patterns that might indicate data errors, fraud, or significant behavioural shifts. Examples include a customer whose payment amount suddenly deviates from the invoice amount by more than 5 per cent (potential deduction or dispute), a supplier who invoices twice for the same delivery (potential duplicate), or a cluster of customers simultaneously extending payment terms (potential systemic stress signal that should trigger an S-Layer review).
The models are built using standard machine-learning frameworks – primarily gradient-boosted decision trees for the payment-behaviour models and isolation forests for anomaly detection. These are not cutting-edge, experimental algorithms. They are mature, well-understood, and highly interpretable techniques that have been proven in production environments across thousands of deployments. The choice is deliberate: in a treasury context, model interpretability is more important than marginal accuracy improvements from exotic architectures. The CFO must be able to understand why the model is predicting what it predicts, not just accept the output as a black-box number.
Layer 3: The Scenario Engine
The third layer takes the behavioural models’ probabilistic outputs and constructs the three scenarios described in Article 3: base case, downside case, and stress case. The scenario engine operates through a Monte Carlo simulation that runs thousands of possible payment-timing combinations for each open receivable and payable, weighted by the behavioural model’s probability distributions.
The base-case scenario represents the median outcome of the simulation – the most likely weekly cash position across the 13-week horizon. The downside case represents the 20th-percentile outcome – the cash position that would occur if collections were slower and disbursements were faster than the median by a statistically calibrated margin. The stress case represents the 5th-percentile outcome, incorporating correlated adverse events such as simultaneous customer delays and supplier payment accelerations.
The probability-weighted composite of these scenarios produces the Cash-Flow-at-Risk metric: the gap between the base-case outcome and the stress-case outcome at the chosen confidence level. This single number captures the uncertainty in the forecast in a form that maps directly onto the Trigger Zone Matrix. A rising CFaR signals increasing forecast uncertainty, which translates into a declining P-Layer score and, if sustained, a potential zone transition.
Layer 4: The Trigger-Integration Layer
The final layer connects the scenario engine’s output to the PULSE Dashboard and the Trigger Zone Matrix. This layer performs three functions: it calculates the P-Layer score from the scenario outputs, it evaluates the six P-Layer trigger signals described in Article 3 (forecast drift, CFaR spike, collections velocity decline, disbursement acceleration, scenario convergence, and surplus persistence), and it generates the automated alerts that notify the CFO and the Working Capital Council when a trigger threshold is breached.
The trigger-integration layer also manages the feedback loop that makes the system self-improving. After each weekly forecast cycle, it compares the previous week’s predictions with actual outcomes and feeds the variance data back to the behavioural models for continuous recalibration. Over time, this feedback loop reduces the forecast error rate as the models learn from their mistakes and adapt to changing customer and supplier behaviour. Organisations that have operated the P-Layer for 12 months or more typically see a further 10 to 15 per cent improvement in forecast accuracy beyond the initial implementation gains.
Build, Buy, or Partner: The Decision Matrix
Every CFO and CIO considering AI-powered cash forecasting faces a fundamental architectural decision: should we build this capability in-house, buy a packaged software solution, or partner with a firm that delivers the capability as a managed service? Each path has trade-offs.
| Approach | Advantages | Disadvantages | Best For |
| Build | Full customisation. Complete IP ownership. Deep integration with proprietary systems. No ongoing licence fees. | Requires data-science talent (expensive, scarce). 6–18 month build timeline. Ongoing maintenance burden. Risk of scope creep and project failure. | Large enterprises (US$500M+ revenue) with existing data-science teams and a strategic commitment to AI as a core capability. |
| Buy | Faster deployment (weeks, not months). Proven technology. Vendor-managed upgrades and support. Scalable. | Limited customisation. Ongoing licence costs (US$50K–200K/yr). Vendor lock-in risk. Generic models not calibrated to your specific business. | Mid-market companies wanting speed and simplicity. Works well when the vendor’s out-of-box models fit the business reasonably well. |
| Partner | Customised to your business. Delivered within the PULSE 90-day framework. Includes calibration, training, and knowledge transfer. No permanent headcount required. | Requires advisory engagement. Initial cost higher than buy (but lower than build). Ongoing recalibration recommended quarterly. | Mid-market companies wanting customised AI capability without building an internal data-science function. The Dawgen Global model. |
Dawgen Global’s approach is the Partner model. We build the P-Layer technology stack during the PULSE implementation, customise the behavioural models to the client’s specific data and business context, integrate the system with the client’s existing ERP and BI platforms, and transfer operational ownership to the client’s FP&A team within the 90-day engagement window. The client does not need data scientists on staff. They need an FP&A analyst who can interpret the Dashboard outputs and a Treasury team that can execute the trigger protocols. The models run on the client’s existing infrastructure – typically Power BI or Tableau with a Python back-end – and are maintained through the quarterly recalibration sessions that form part of the ongoing PULSE partnership.
Quick Wins: What You Can Do Without Any AI
While the full P-Layer technology stack delivers the most comprehensive results, there are immediate improvements that any organisation can implement with no AI investment whatsoever. These quick wins correspond to the Level 2 and Level 3 positions on the AI Readiness Spectrum and can be implemented in days rather than months.
- Automate data extraction: Stop manually pulling data from the ERP for the 13-week forecast. Configure scheduled exports that deliver receivables, payables, and cash-balance data to a central spreadsheet or BI dashboard every Monday morning. Time investment: one day of IT configuration. Impact: eliminates two to three days of manual data assembly per forecast cycle and ensures the forecast is built on current data rather than data that is already three days old.
- Segment your receivables forecast: Stop using a single DSO assumption for all customers. Divide your customer base into three to five segments based on historical payment behaviour (fast payers, on-time payers, slow payers, chronic late payers) and apply segment-specific payment assumptions. Time investment: half a day of analysis plus a spreadsheet adjustment. Impact: 10 to 20 per cent improvement in week-four-and-beyond forecast accuracy.
- Add a downside scenario: Stop forecasting a single outcome. Create a simple downside case by applying a 15-day delay to the top five customer payments and accelerating the top three supplier payments by 10 days. Time investment: one hour to set up the scenario template. Impact: the CFO can see, for the first time, what happens when things go wrong – and can begin pre-positioning responses before the downside materialises.
- Track forecast accuracy: Start measuring the gap between what you forecast and what actually happens. Every week, compare last week’s projection for “this week” with the actual outcome. Plot the variance over time. This single metric – forecast accuracy by week – will tell you more about the quality of your cash-flow management than any other number on your dashboard. Time investment: thirty minutes per week. Impact: creates the accountability and learning loop that makes every subsequent improvement possible.
These four actions can be completed within two weeks and will improve the organisation’s cash-flow forecasting capability more than most CFOs expect. They also prepare the data foundation and the organisational discipline required for a subsequent PULSE implementation, making the Level 4 upgrade faster and less disruptive when the organisation is ready.
You do not need AI to improve your cash forecast. You need AI to perfect it. Start with the fundamentals, and the technology upgrade will deliver maximum return when it arrives.
CURIOUS ABOUT AI-POWERED CASH FORECASTING?
Not sure where to start?
Request a PULSE Technology Readiness Assessment
Dawgen Global is a full-spectrum advisory firm delivering transformation across Strategy, Finance, Operations, Technology, and Governance. Our Working Capital Advisory practice is powered by the proprietary WC-PULSE Framework™, combining deep financial expertise with practical technology capability to deliver AI-powered working-capital intelligence without the complexity, cost, or risk of traditional enterprise AI deployments.
We’ll evaluate your data maturity, ERP ecosystem, and current forecast accuracy to create a pragmatic AI adoption roadmap. You’ll know exactly where you sit on the readiness spectrum, what quick wins are available today, and what the path to Level 4 looks like for your specific organisation. No jargon. No hype. Just a clear path forward.
| Request Your Assessment: [email protected]
The WC-PULSE Thought Leadership Series
Articles 1–9: CCC Blind Spots → Buffer vs. Reprice → 13-Week Crystal Ball → Supplier Ecosystem → Governance → Reprice Playbook → E-Layer → 90-Day Case Study → Caribbean CFO Guide
Article 10: “AI-Powered Cash Forecasting: The P-Layer Technology Stack Revealed” (You are here)
Coming Next – Article 11: “The Board-Ready Working Capital Report: What Directors Actually Need to See” – A practical template for transforming your working-capital board reporting from a static dashboard slide into a strategic narrative that directors will actually engage with and use to challenge and support management.
About Dawgen Global
“Embrace BIG FIRM capabilities without the big firm price at Dawgen Global, your committed partner in carving a pathway to continual progress in the vibrant Caribbean region. Our integrated, multidisciplinary approach is finely tuned to address the unique intricacies and lucrative prospects that the region has to offer. Offering a rich array of services, including audit, accounting, tax, IT, HR, risk management, and more, we facilitate smarter and more effective decisions that set the stage for unprecedented triumphs. Let’s collaborate and craft a future where every decision is a steppingstone to greater success. Reach out to explore a partnership that promises not just growth but a future beaming with opportunities and achievements.
 Email: [email protected]
  Visit: Dawgen Global Website

 WhatsApp Global Number : +1 555-795-9071
Caribbean Office: +1876-6655926 / 876-9293670/876-9265210  WhatsApp Global: +1 5557959071
USA Office: 855-354-2447
Join hands with Dawgen Global. Together, let’s venture into a future brimming with opportunities and achievements

