
The Most Important Spreadsheet in Corporate Finance
There is a document that lives on the desktop of nearly every Treasurer, FP&A Director, and Chief Financial Officer in the world. It is a spreadsheet. It has thirteen columns, one for each week of the coming quarter. Its rows list every expected cash inflow and every anticipated cash outflow, week by week, culminating in a projected closing balance that is supposed to tell the finance team whether the company will have enough money to operate.
This is the 13-week cash-flow forecast. It is, by common consensus, the single most important short-term planning tool in corporate finance. And in the vast majority of organisations, it is fundamentally broken.
Not broken in the dramatic sense – it still produces numbers, it still gets reviewed in weekly treasury meetings, and it still gets presented to the board as evidence that management has a handle on liquidity. Broken in the sense that it fails at its primary purpose: predicting the future with sufficient accuracy and granularity to drive proactive decision-making. It is a rearview mirror dressed up as a windshield.
In the first two articles of this series, we introduced the WC-PULSE Framework™ and the Trigger Zone Matrix. In this third instalment, we examine the P-Layer – Predictive Cash-Flow Velocity – in detail. This is the layer that transforms the 13-week forecast from a compliance exercise into a genuine strategic weapon, and it is the layer that most directly determines whether your organisation is heading towards the Red Zone, the Amber Zone, or the Green Zone.
Why Most 13-Week Forecasts Fail
Before we can build a better forecast, we need to understand why the current approach fails. In our advisory work at Dawgen Global, we have audited the forecasting practices of more than a hundred organisations across manufacturing, financial services, distribution, professional services, and technology. The failure patterns are remarkably consistent, regardless of industry or geography.
Failure Mode 1: The Static-Assumption Trap
The most common failure is the static-assumption trap. The forecast is built at the beginning of the quarter using assumptions about customer payment behaviour, supplier terms, revenue timing, and operating expenditure that are treated as fixed for the entire 13-week horizon. In reality, these assumptions begin degrading from the moment they are entered into the model.
A customer who has been paying in 35 days starts stretching to 50 because of their own cash-flow pressure. A supplier who traditionally invoiced on the 15th of each month shifts to the 1st, accelerating a payable by two weeks. A revenue milestone that was expected in week six slips to week nine because of a project delay. Each of these changes is individually small. Collectively, they can shift the week-13 closing balance by 15 to 25 per cent from the original projection – a deviation large enough to trigger a zone transition in the PULSE Framework but invisible to a static model until it materialises.
Failure Mode 2: The Single-Scenario Delusion
The second failure mode is the single-scenario delusion. Most forecasts present a single projection: “This is what we expect to happen.” No downside case. No stress test. No probability weighting. This approach is roughly equivalent to a weather service that only ever forecasts sunshine – useful on clear days, catastrophically misleading when storms approach.
The absence of scenario modelling means the forecast cannot answer the questions that matter most to the CFO: “What happens if our largest customer pays 30 days late?” “What happens if the central bank raises rates by 75 basis points?” “What happens if both of those things occur simultaneously?” Without answers to these questions, the forecast provides comfort but not insight. It describes the expected case while remaining silent about the cases that will actually test the organisation’s resilience.
Failure Mode 3: The Manual-Input Bottleneck
The third failure mode is operational rather than methodological. In most organisations, the 13-week forecast is assembled manually. An analyst collects data from the accounts-receivable ledger, the accounts-payable system, the payroll schedule, the capex approval log, and half a dozen other sources. This data is entered into a spreadsheet, reconciled against the general ledger, and reviewed by the Treasurer or FP&A Director before being circulated.
This process typically takes two to three business days. By the time the forecast is finalised, it is already out of date. Transactions have been processed, invoices have been issued, payments have been received, and the underlying reality has moved on. The forecast captures a snapshot of a world that no longer exists – and the longer the update cycle, the wider the gap between the forecast and reality becomes.
A forecast that takes three days to build and describes a world that existed three days ago is not a forecast. It is a retrospective with aspirational week numbers.
Failure Mode 4: The Disconnected Forecast
The fourth and perhaps most consequential failure mode is disconnection. The 13-week forecast exists as a standalone document, disconnected from the decision systems that should consume its output. It tells you the projected cash balance in week eight, but it does not tell you what to do about it. It does not trigger an alert when the projected balance breaches a threshold. It does not link to the credit-facility drawdown protocol. It does not automatically update the working-capital dashboard. It sits in a spreadsheet, reviewed by a small group, and filed until next week’s update.
This disconnection is the fundamental reason why most organisations manage working capital reactively. The forecast produces information, but that information is not wired into the decision architecture. By the time the data flows from the forecast through the reporting chain to the decision-maker, the window for proactive action has often closed.
The P-Layer: Predictive Cash-Flow Velocity
The P-Layer of the WC-PULSE Framework™ is designed to solve all four failure modes simultaneously. It does this not by replacing the 13-week forecast but by transforming it – upgrading it from a static, single-scenario, manually assembled, disconnected spreadsheet into a dynamic, multi-scenario, data-integrated, action-triggering prediction engine.
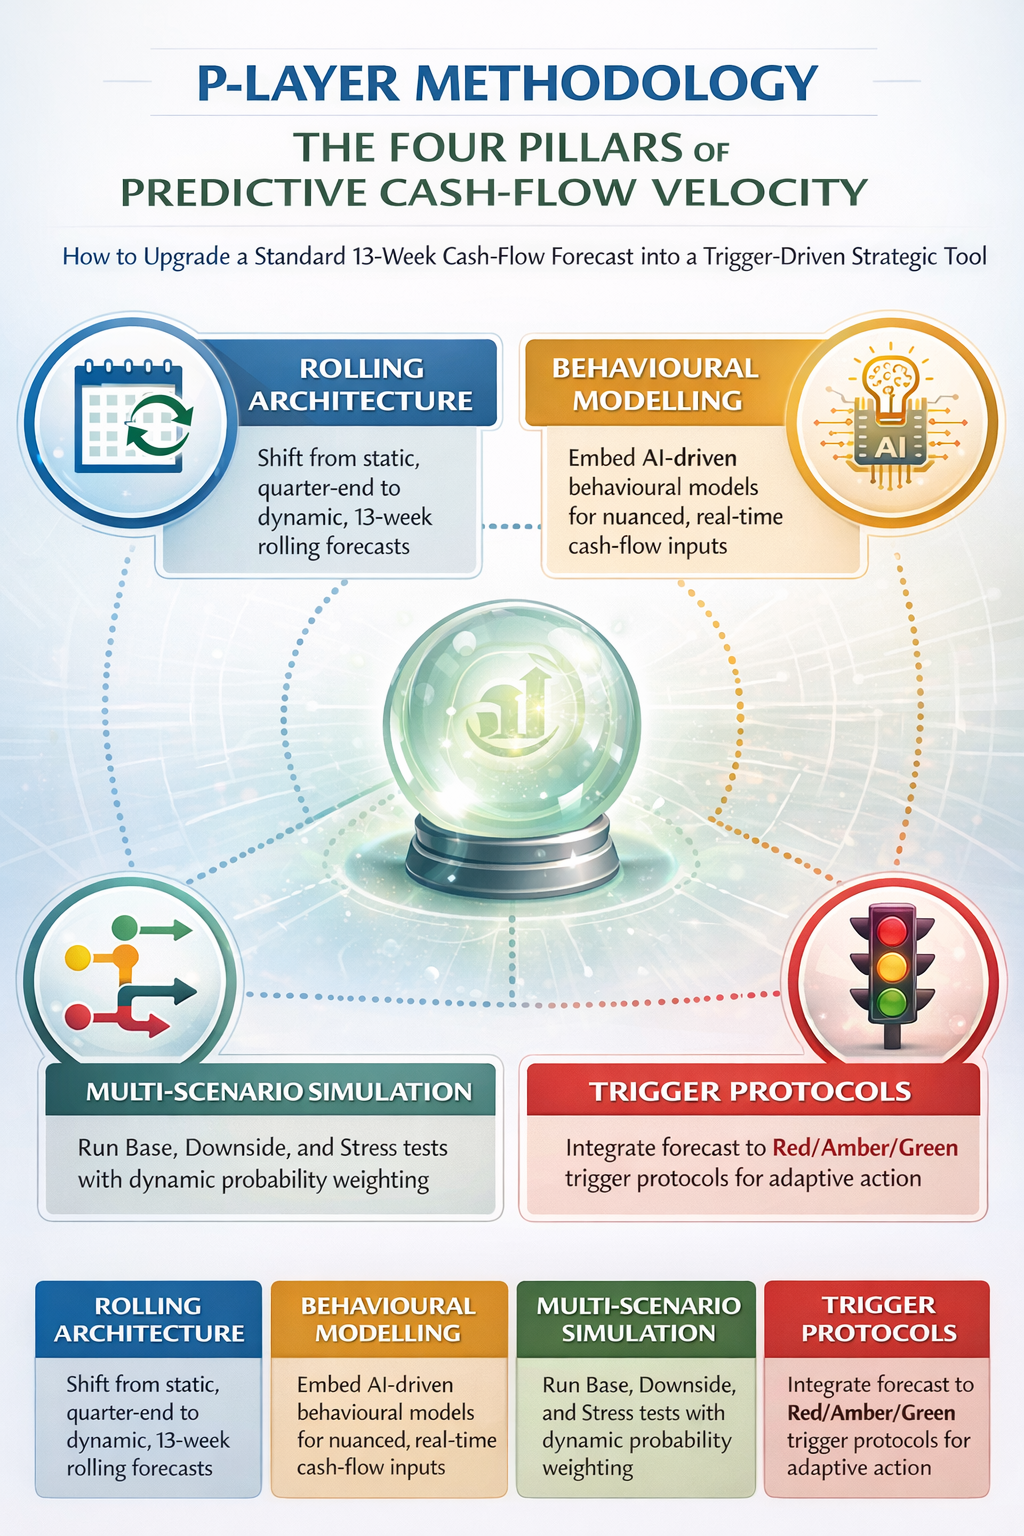
The P-Layer methodology rests on four pillars:
Pillar 1: Rolling Forecast Architecture
The first transformation is structural. The P-Layer replaces the fixed-quarter forecast with a rolling 13-week window that advances one week with each update cycle. This means the organisation always has a 13-week forward view, regardless of where it sits within the fiscal quarter or year. The rolling architecture eliminates the cliff-edge problem that occurs when a quarterly forecast reaches its final weeks and the organisation is suddenly operating without forward visibility.
More importantly, the rolling architecture enables trend analysis across forecast vintages. By comparing this week’s 13-week projection with last week’s, the system can detect forecast drift – the systematic tendency for projections to deteriorate or improve over successive updates. Forecast drift is one of the most powerful leading indicators in the PULSE Framework: consistent downward drift across three or more updates is an early signal of an approaching Red Zone, often visible weeks before the underlying metrics confirm the deterioration.
Pillar 2: AI-Driven Behavioural Modelling
The second transformation addresses the static-assumption trap. Rather than relying on fixed assumptions about customer payment behaviour, supplier timing, and revenue recognition, the P-Layer uses machine-learning models trained on the organisation’s own historical data to predict these variables dynamically.
Consider customer payment behaviour. A traditional forecast assumes that Customer A will pay in 35 days because that is their average. The P-Layer model examines Customer A’s actual payment history – not just the average, but the distribution. It considers the day of the week, the month of the year, the invoice size, the product line, and even the customer’s own financial health indicators where available. From this analysis, it generates a probabilistic payment forecast: a 70 per cent chance of payment in week four, a 20 per cent chance in week five, and a 10 per cent chance of payment beyond week six.
This probabilistic approach transforms the forecast from a single-point projection into a confidence-weighted distribution. The CFO no longer sees “we expect US$4.2 million in collections in week four.” Instead, they see “we expect US$4.2 million in collections in week four with 70 per cent confidence, with a downside case of US$3.1 million and a stress case of US$2.4 million.” This is the difference between a guess and a forecast.
Pillar 3: Scenario Stress-Testing
The third pillar directly addresses the single-scenario delusion. The P-Layer generates three standard scenarios for every forecast update:
- Base Case (60% probability weight): The most likely outcome given current data, trends, and confirmed commitments. This is the scenario that most closely resembles the traditional forecast, but it is built on dynamic behavioural models rather than static assumptions.
- Downside Case (30% probability weight): The plausible adverse scenario. This is not the worst case – it is the realistic bad case. It models what happens when the top-three customers each pay 15 days later than expected, when a seasonal revenue trough is 20 per cent deeper than historical average, or when a planned capex payment accelerates by two weeks. The downside case is calibrated to represent approximately a one-in-three probability event.
- Stress Case (10% probability weight): The severe but survivable scenario. This models a compound adverse event: a major customer default combined with a supplier demanding prepayment combined with a credit-facility reduction. The stress case is not designed to be likely. It is designed to answer the question: “If the worst plausible combination of events occurs, do we survive? And if so, for how many weeks?”
The probability-weighted composite of these three scenarios produces the Cash-Flow-at-Risk metric – the P-Layer’s primary output and one of the most important inputs to the composite PULSE Score. Cash-Flow-at-Risk tells the CFO, in a single number, how much cash the organisation could lose relative to the base case at a given confidence level. A rising CFaR is the clearest possible signal that the organisation is drifting towards the Red Zone, even if the base-case forecast still looks acceptable.
From Forecast to Action: Connecting the P-Layer to Zone Triggers
A better forecast is only valuable if it drives better decisions. This is where the P-Layer’s integration with the Trigger Zone Matrix becomes critical. The P-Layer does not simply produce a projection and leave the CFO to interpret it. It generates explicit trigger signals that map directly onto the Red, Amber, and Green zone protocols described in Articles 1 and 2.
Trigger Signal Architecture
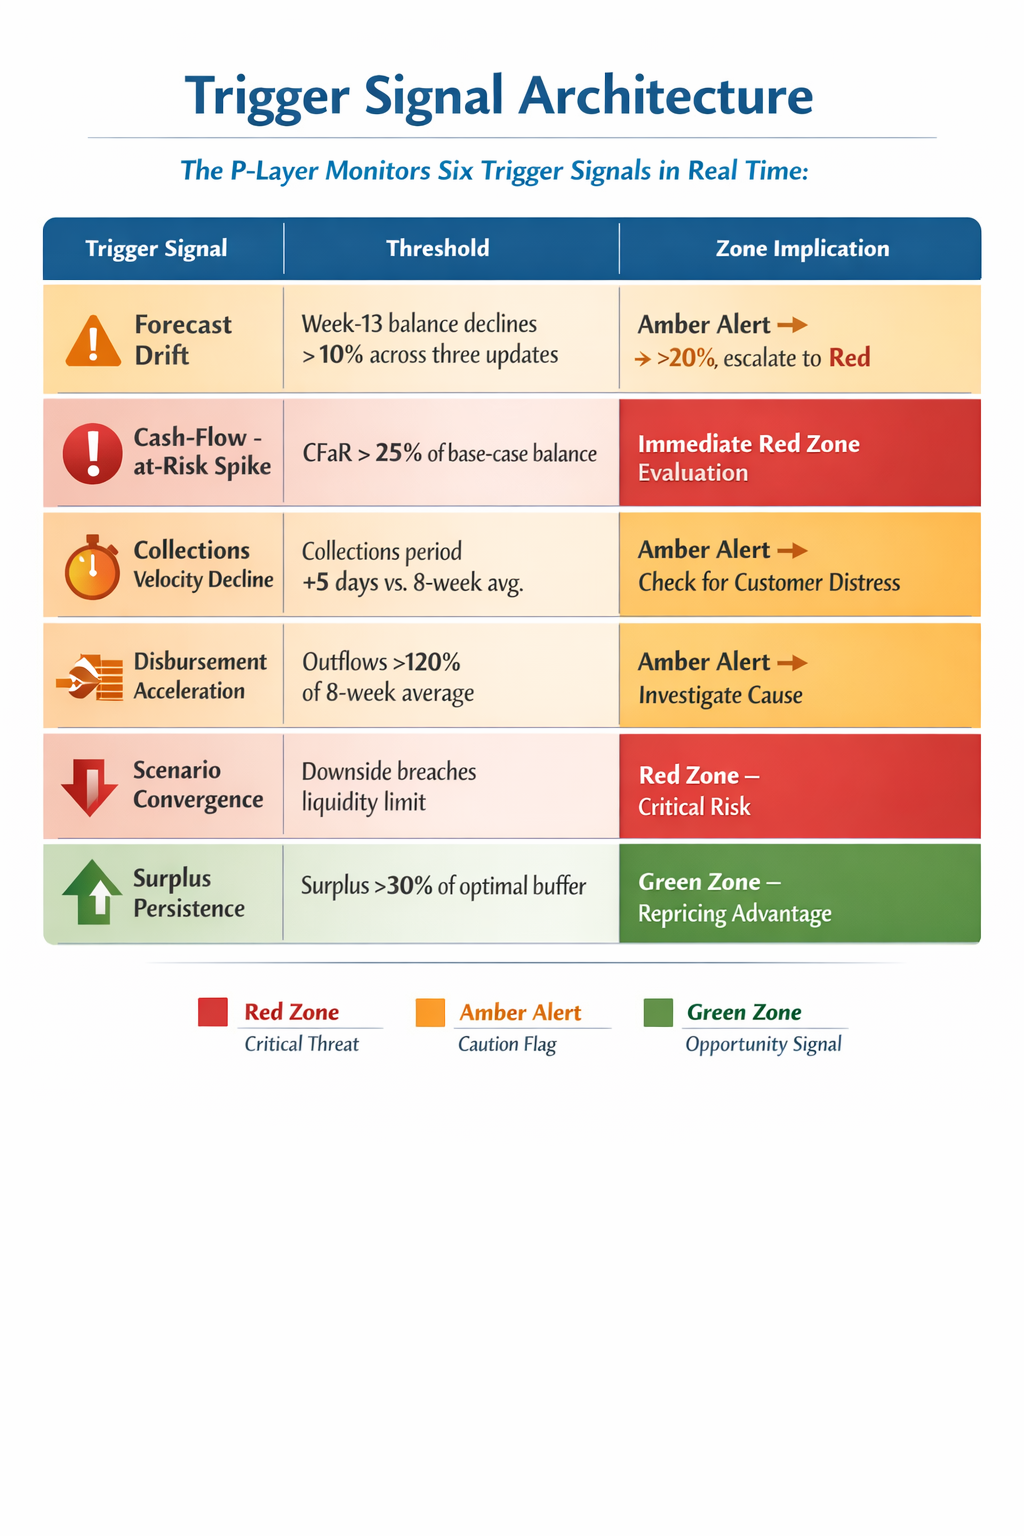
The P-Layer monitors six trigger signals in real time:
| Trigger Signal | Threshold | Zone Implication |
| Forecast Drift | Week-13 closing balance declines by more than 10% across three consecutive forecast updates | Amber Alert → if decline exceeds 20%, escalate to Red |
| Cash-Flow-at-Risk Spike | CFaR at 90% confidence exceeds 25% of the base-case closing balance | Immediate Red Zone evaluation regardless of composite PULSE Score |
| Collections Velocity Decline | Weighted-average collection period increases by more than 5 days versus the 8-week trailing average | Amber Alert → triggers S-Layer cross-check for customer distress |
| Disbursement Acceleration | Net cash outflows in any single week exceed 120% of the 8-week average | Amber Alert → investigate root cause (capex, payroll, supplier demand) |
| Scenario Convergence | The downside case closing balance breaches the minimum liquidity threshold | Red Zone – even if base case remains healthy, the downside is unacceptable |
| Surplus Persistence | Base-case closing balance exceeds optimal buffer by more than 30% for four consecutive weeks | Green Zone signal – repricing opportunity confirmed by sustained surplus |
These six signals create a continuous monitoring fabric that wraps around the 13-week forecast and converts its output into actionable intelligence. When Trigger Signal 2 fires – a Cash-Flow-at-Risk spike – the PULSE Dashboard automatically alerts the CFO, updates the zone classification, and presents the Red Zone protocol with pre-populated action items. The CFO does not need to interpret the forecast, assess its implications, and determine the appropriate response. The system does this for them, in real time, with the calibrated precision that the framework’s implementation phase establishes.
The Forecast Maturity Model: Where Are You Today?
At Dawgen Global, we assess every client’s forecasting capability against our five-level Forecast Maturity Model. Understanding your current level is the first step towards upgrading your P-Layer capability.
| Level | Classification | Characteristics |
| 1 | Reactive | No formal 13-week forecast. Cash management is based on daily bank balances and ad hoc estimates. Surprises are the norm. The organisation discovers cash shortfalls when they materialise, not before. |
| 2 | Basic | A 13-week forecast exists but is updated monthly or bi-weekly. It uses static assumptions, a single scenario, and manual data assembly. Accuracy degrades significantly beyond week four. The forecast is a reporting tool, not a decision tool. |
| 3 | Structured | Weekly updates with semi-automated data feeds from the ERP and banking systems. Two scenarios (base and downside) are modelled. Forecast accuracy is reasonable through week eight. The forecast influences decisions but does not trigger them automatically. |
| 4 | Predictive | Rolling weekly updates with fully automated data integration. Three scenarios with probability weighting. AI-driven behavioural models for customer payments and supplier timing. CFaR calculated weekly. Forecast is connected to the PULSE Dashboard and generates trigger alerts. |
| 5 | Autonomous | Continuous, real-time forecast updates driven by live transaction feeds, banking APIs, and market-data integrations. Self-correcting models that learn from forecast errors. Fully integrated with the Trigger Zone Matrix, PULSE Dashboard, and automated escalation protocols. The forecast is a living organism, not a document. |
In our experience, approximately 60 per cent of mid-market organisations operate at Level 2, 25 per cent at Level 3, 10 per cent at Level 1, and fewer than 5 per cent at Level 4 or above. The transition from Level 2 to Level 4 is the highest-impact upgrade available to most finance functions, and it is achievable within 90 days using the PULSE implementation methodology described in our framework documentation.
The journey from Level 2 to Level 4 does not require a massive technology investment. It requires three things: a structured methodology (which the WC-PULSE Framework provides), disciplined data integration (connecting the ERP, banking, and payables systems into a single data pipeline), and the analytical capability to build and maintain behavioural models (which Dawgen Global provides through our implementation partnership and can transfer to internal teams within the 90-day engagement window).
The Strategic Payoff: What a Level 4 Forecast Delivers
The return on investment in forecasting maturity is substantial and measurable. Based on our client engagements, organisations that upgrade from Level 2 to Level 4 typically realise the following outcomes within six months of full operationalisation:
- Forecast accuracy improvement of 30 to 45 per cent: Measured by comparing the week-13 projected closing balance at the time of initial forecast with the actual closing balance. This improvement translates directly into better capital-allocation decisions, reduced emergency borrowing, and more precise buffer sizing.
- Working-capital release of 8 to 15 per cent: Better forecasting reveals over-buffered positions that can be safely released for redeployment. For a company with US$100 million in total working capital, an 8 per cent release represents US$8 million in freed capital.
- Reduction in emergency borrowing costs of 40 to 60 per cent: Predictive alerts surface approaching shortfalls early enough to arrange funding on standard terms rather than emergency terms. The spread between standard and emergency facility pricing typically ranges from 300 to 800 basis points.
- CFO and Treasury time savings of 10 to 15 hours per week: Automated data integration and trigger-based alerting eliminate the manual data assembly, reconciliation, and exception-chasing that consume senior finance leaders’ time. This time is redeployed from data processing to strategic decision-making.
The 13-week forecast should be the CFO’s most powerful strategic instrument. If yours is still a spreadsheet that someone updates on Tuesday afternoons, you are competing with a blindfold on.
Getting Started: The PULSE Forecast Maturity Assessment
The transformation of your 13-week forecast begins with an honest assessment of where you are today. Dawgen Global’s PULSE Forecast Maturity Assessment is a rapid, structured evaluation that determines your current maturity level, identifies the specific gaps and constraints holding you back, and produces a tailored roadmap to Level 4 maturity with clear milestones, resource requirements, and expected outcomes.
The assessment is conducted remotely over two focused sessions totalling approximately three hours. It covers five dimensions: data availability and integration, forecast methodology and assumptions, scenario modelling capability, technology and tooling, and governance and decision-linkage. The output is a written report with a maturity score, a gap analysis, and a 90-day upgrade plan.
There is no charge for this assessment. We offer it because we have found that the single biggest barrier to better cash-flow forecasting is not technology, not budget, and not talent. It is the absence of a clear picture of the current state and a credible pathway to a better one. The Forecast Maturity Assessment provides both.
YOUR 13-WEEK FORECAST SHOULD BE A STRATEGIC WEAPON
Not a compliance exercise.
Request Your Free PULSE Forecast Maturity Assessment
A rapid evaluation of your current forecasting capability with a tailored roadmap to Level 4 maturity. Two focused sessions. No charge. No obligation. Just a clear path forward.
Dawgen Global is a full-spectrum advisory firm delivering transformation across Strategy, Finance, Operations, Technology, and Governance. Our Working Capital Advisory practice is powered by the proprietary WC-PULSE Framework™, designed to convert working-capital management from a reactive function into a strategic capability that drives shareholder value. We serve mid-market and large enterprises across the Caribbean, North America, and international markets.
 Email: [email protected]
 WhatsApp Global Number : +1 555-795-9071
“Embrace BIG FIRM capabilities without the big firm price at Dawgen Global, your committed partner in carving a pathway to continual progress in the vibrant Caribbean region. Our integrated, multidisciplinary approach is finely tuned to address the unique intricacies and lucrative prospects that the region has to offer. Offering a rich array of services, including audit, accounting, tax, IT, HR, risk management, and more, we facilitate smarter and more effective decisions that set the stage for unprecedented triumphs. Let’s collaborate and craft a future where every decision is a steppingstone to greater success. Reach out to explore a partnership that promises not just growth but a future beaming with opportunities and achievements.
Email: [email protected]  Visit: Dawgen Global Website
WhatsApp Global Number : +1 555-795-9071
Caribbean Office: +1876-6655926 / 876-9293670/876-9265210  WhatsApp Global: +1 5557959071
USA Office: 855-354-2447
Join hands with Dawgen Global. Together, let’s venture into a future brimming with opportunities and achievements

