
The Metric Every CFO Trusts – And Shouldn’t
There is a number that sits at the heart of every working-capital discussion in every boardroom, every quarterly earnings call, and every CFO’s monthly reporting deck. That number is the Cash Conversion Cycle. It is elegant in its simplicity: Days Sales Outstanding plus Days Inventory Outstanding minus Days Payable Outstanding. Three inputs, one output, and the comforting illusion that you understand the health of your working capital.
It is, in many respects, the vital sign of corporate liquidity – the equivalent of checking a patient’s pulse. But here is the problem: if you walked into an emergency room and the doctor checked only your pulse and declared you healthy, you would rightly question their competence. A pulse tells you the heart is beating. It tells you nothing about blood pressure, organ function, neurological health, or the tumour growing silently in the background.
The Cash Conversion Cycle is your corporate pulse – necessary, but nowhere near sufficient. And for a growing number of organisations, it is actively misleading. It is a backward-looking, single-dimensional metric that can show green even as the liquidity crisis accelerates towards you. It averages when it should differentiate. It summarises when it should signal. It comforts when it should alarm.
This is the central argument of this article, and it is the founding premise of the Dawgen Global WC-PULSE Framework™: that modern working-capital management demands a multi-dimensional, forward-looking, trigger-based decision system that goes far beyond the CCC. A system that tells CFOs not only where they stand today, but where they are heading tomorrow – and precisely what to do about it.
The CCC Illusion: Five Blind Spots That Can Sink Your Business
Let us be clear: the Cash Conversion Cycle is not a bad metric. It is an incomplete one. And in the hands of executives who treat it as the definitive measure of working-capital health, it becomes a dangerous one. Here are the five blind spots that the CCC cannot see.
Blind Spot 1: The Averaging Problem
The CCC is an average. DSO is calculated across your entire receivables book. DIO is calculated across your full inventory. DPO is calculated across all payables. This means that a company with one customer paying in 15 days and another paying in 120 days will show a DSO of 67.5 days – a number that describes neither reality. The fast-paying customer is subsidising the slow one in your metric, and you cannot see the concentration risk lurking beneath the surface.
We have seen organisations with a “healthy” DSO of 42 days where the top three customers – representing 60 per cent of revenue – were actually paying at 75 to 90 days. The remaining customers were paying so quickly that they dragged the average down. When one of those top-three customers entered financial distress, the CCC gave no warning. The average looked fine until the day it did not.
Blind Spot 2: The Backward-Looking Bias
The CCC is calculated from historical data. It tells you what happened last quarter, not what is about to happen next quarter. It cannot incorporate the fact that your largest supplier has just been acquired by a competitor who may change payment terms. It cannot account for the interest-rate hike that will increase your cost of carrying inventory by 200 basis points next month. It cannot model the seasonal cash-flow trough that is six weeks away.
In a world of accelerating disruption, a backward-looking metric is like driving by staring into the rear-view mirror. It will confirm where you have been. It will not prevent you from driving off the cliff ahead.
Blind Spot 3: The Missing Macro Layer
The CCC operates in a vacuum. It measures internal operational efficiency – how fast you collect, how long you hold inventory, how slowly you pay – without any reference to the external environment in which you operate. It does not incorporate interest rates, exchange rates, commodity-price volatility, regulatory changes, or credit-market conditions.
For a Caribbean manufacturer importing raw materials priced in US dollars and selling finished goods in local currency, the CCC is almost meaningless without a foreign-exchange overlay. A “good” 45-day CCC can be destroyed overnight by a 10 per cent currency depreciation that increases the cost of imported inputs before you can collect on the goods you have already shipped. The CCC will not tell you this is coming. It will only tell you, after the fact, that it happened.
Blind Spot 4: The Liquidity Depth Gap
The CCC measures cycle speed, not liquidity depth. A company can have a 30-day CCC – best in class by any industry benchmark – and still be one missed receivable away from a cash crisis. Why? Because cycle speed and liquidity reserves are different things. A sports car can go fast, but if it has an empty fuel tank, speed is irrelevant.
The CCC tells you nothing about how many layers of liquidity you have: operational cash, committed credit facilities, contingent credit, and strategic reserves. It does not tell you how many days you can survive if collections stop entirely. It does not distinguish between a company with US$50 million in undrawn credit lines and one that has fully drawn its facilities. Both can have identical CCCs.
Blind Spot 5: The Supplier Ecosystem Blind Spot
A metric that ignores the health of your counterparties is a metric that will fail you precisely when you need it most.
The CCC treats suppliers and customers as abstractions – line items in a formula. It does not measure the health of your supplier ecosystem. It does not flag that your top supplier’s credit rating was just downgraded. It does not alert you that three of your ten largest customers have stretched their payment terms by 15 days over the past two quarters, signalling their own cash-flow stress that may eventually become your bad-debt write-off.
A metric that ignores the health of your counterparties is a metric that will fail you precisely when you need it most – during systemic stress, when the entire ecosystem is under pressure simultaneously.
Introducing the WC-PULSE Framework™: A Multi-Dimensional Alternative
At Dawgen Global, we have spent the better part of a decade advising CFOs, Treasurers, and Finance Directors across the Caribbean, North America, and international markets. In that time, we have observed a consistent pattern: the organisations that manage working capital most effectively are not the ones with the best CCC. They are the ones with the best decision systems – frameworks that integrate multiple signals, anticipate rather than react, and provide explicit triggers for action.
This insight led us to develop the WC-PULSE Framework™, a proprietary five-layer diagnostic and decision-intelligence model. PULSE stands for Predictive Utilisation, Liquidity & Strategic Efficiency, and it is designed to do what the CCC cannot: give finance leaders a real-time, forward-looking, multi-dimensional view of working-capital health with explicit action triggers.
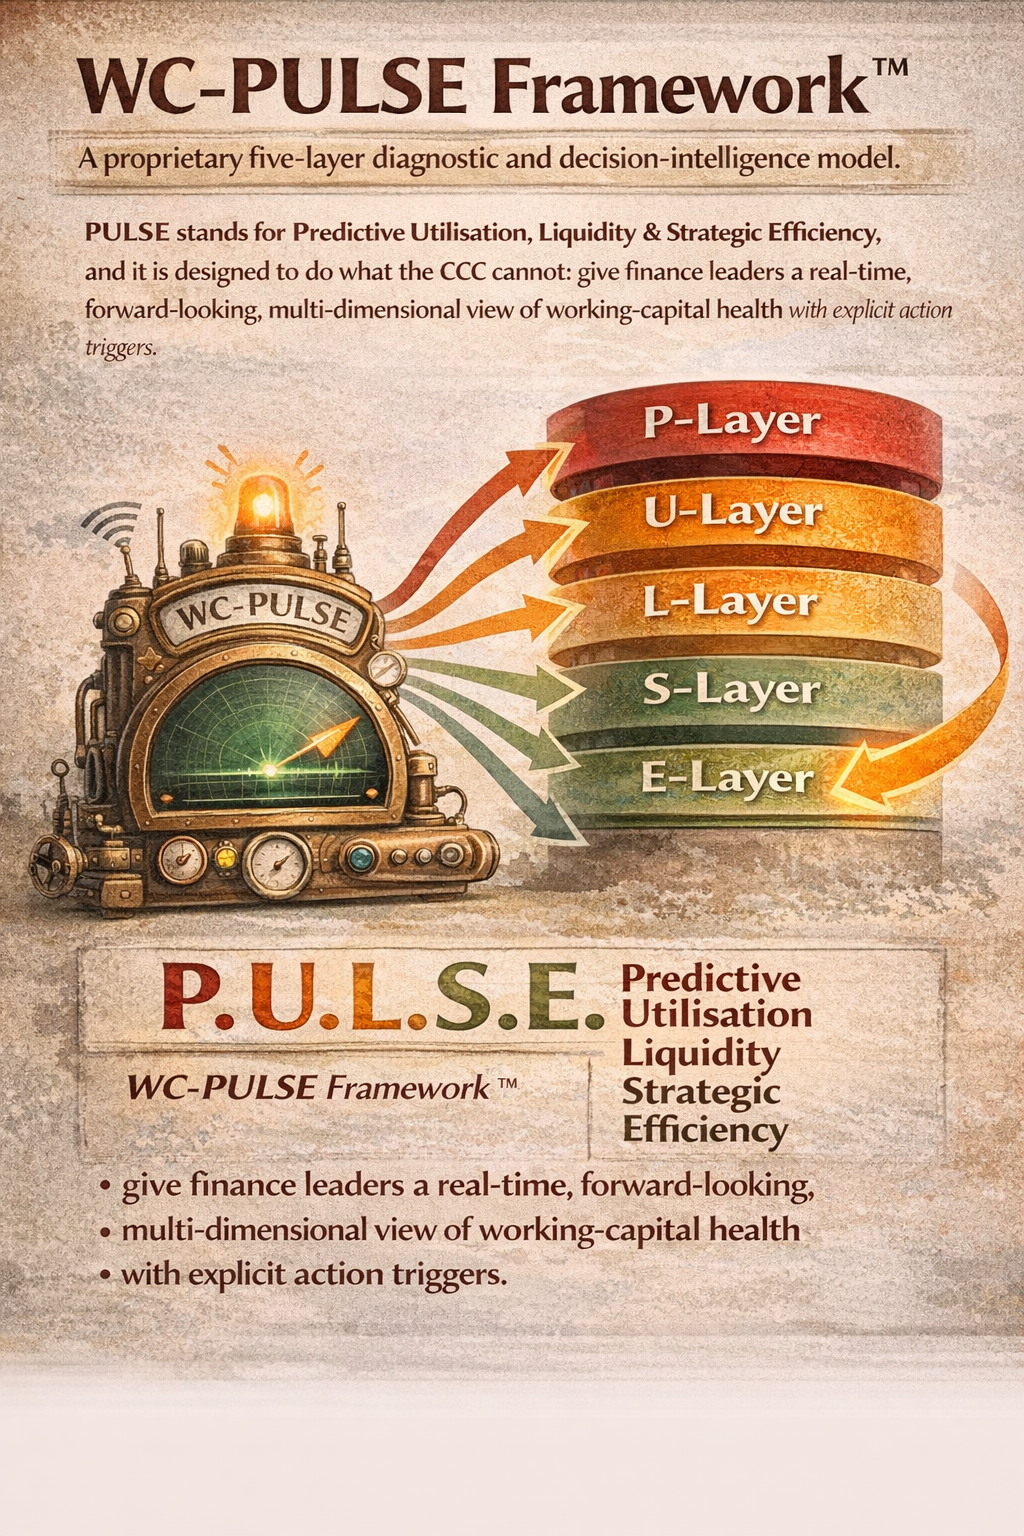
The Five PULSE Layers
Each layer captures a dimension of working-capital reality that the CCC misses:
- P – Predictive Cash-Flow Velocity: This layer replaces backward-looking CCC calculations with a forward-looking 13-week cash-flow trajectory. It uses rolling forecasts, AI-driven seasonality models, and scenario stress-testing to answer the question: “Where is our cash heading, and how fast?” The primary metrics are Cash-Flow-at-Risk, Free Cash Flow Yield, and a forward-projected CCC.
- U – Utilisation and Asset Intensity: This layer measures how effectively your current assets are being deployed relative to the revenue they generate and the cost of capital they consume. A company can have a tight CCC but still be over-capitalised in working assets relative to revenue. Key metrics include Working Capital Turnover, Return on Net Operating Assets, and Asset Utilisation Ratio.
- L – Liquidity Depth and Duration: This is the layer the CCC ignores entirely. It measures not how fast your cash cycles, but how deep your liquidity reserves run and how long you can survive under stress. It distinguishes between operational liquidity (cash on hand), tactical liquidity (committed credit facilities), and strategic liquidity (contingent facilities and asset disposals). Key metrics include the Defensive Interval, Liquidity Coverage Ratio, and a custom Survival Duration Score.
- S – Supplier and Receivables Ecosystem Health: This layer looks beyond your own balance sheet to assess the health, behaviour, and risk profile of your counterparties. It monitors payment-behaviour trends, concentration risk, credit deterioration, and supply-chain fragility. Key metrics include the Supplier Concentration Index, Ageing Waterfall Velocity, and a composite Ecosystem Health Score.
- E – External and Macro Environment Sensitivity: The final layer connects your working capital to the world outside your organisation. Interest rates, foreign-exchange movements, commodity-price cycles, regulatory changes, and credit-market conditions all affect working-capital health in ways the CCC cannot capture. Key metrics include the Weighted Cost of Debt, FX Exposure Ratio, Commodity Beta, and a Regulatory Impact Score.
Each PULSE layer is scored on a standardised 0–100 scale. The scores are then combined using industry-specific weights into a composite PULSE Score that maps directly onto a three-zone decision framework.
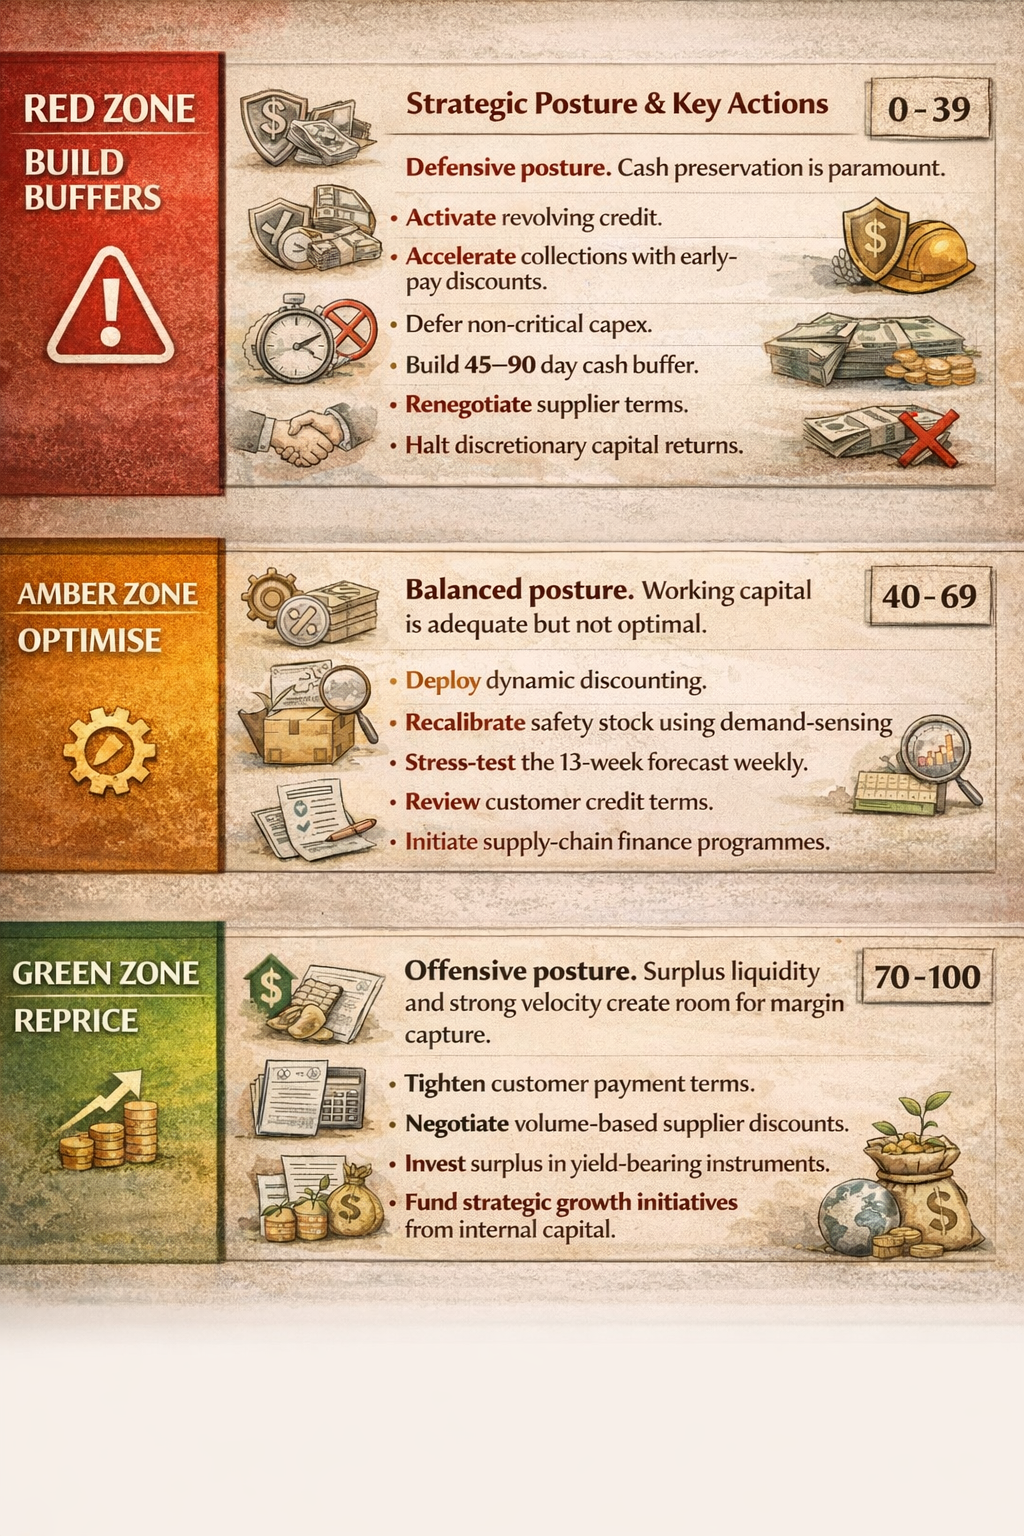
The Trigger Zone Matrix: When to Buffer, When to Reprice
The composite PULSE Score translates into one of three operational zones, each with a distinct strategic posture and explicit action triggers. This is the operational heart of the framework – the mechanism that converts data into decisions.
The power of this system lies not in classification but in anticipation. Zone transitions are triggered by leading indicators – not by the lagging realisation that you are already in trouble. When the P-Layer detects a deteriorating cash-flow trajectory three weeks before it materialises, the system fires an alert. When the S-Layer detects that two of your top-five customers have stretched payments by more than ten days, the system recalculates your zone status in real time.
This is the fundamental difference between the CCC and the WC-PULSE Framework. The CCC tells you where you were. PULSE tells you where you are going and what to do about it.
Case in Point: A Caribbean Manufacturer’s Near Miss
Consider the experience of a mid-market Caribbean manufacturer – a client of Dawgen Global whose identity we will protect, but whose story illustrates why the CCC alone is insufficient.
In the third quarter of 2024, this company reported a Cash Conversion Cycle of 38 days. By any standard, this was excellent – well below the industry median of 52 days. The CFO reported to the board that working-capital management was “on track.” The current ratio was 1.8. The quick ratio was 1.2. Every traditional metric pointed to health.
Beneath the surface, however, the picture was very different. Had the WC-PULSE Framework been in place, the following signals would have been visible:
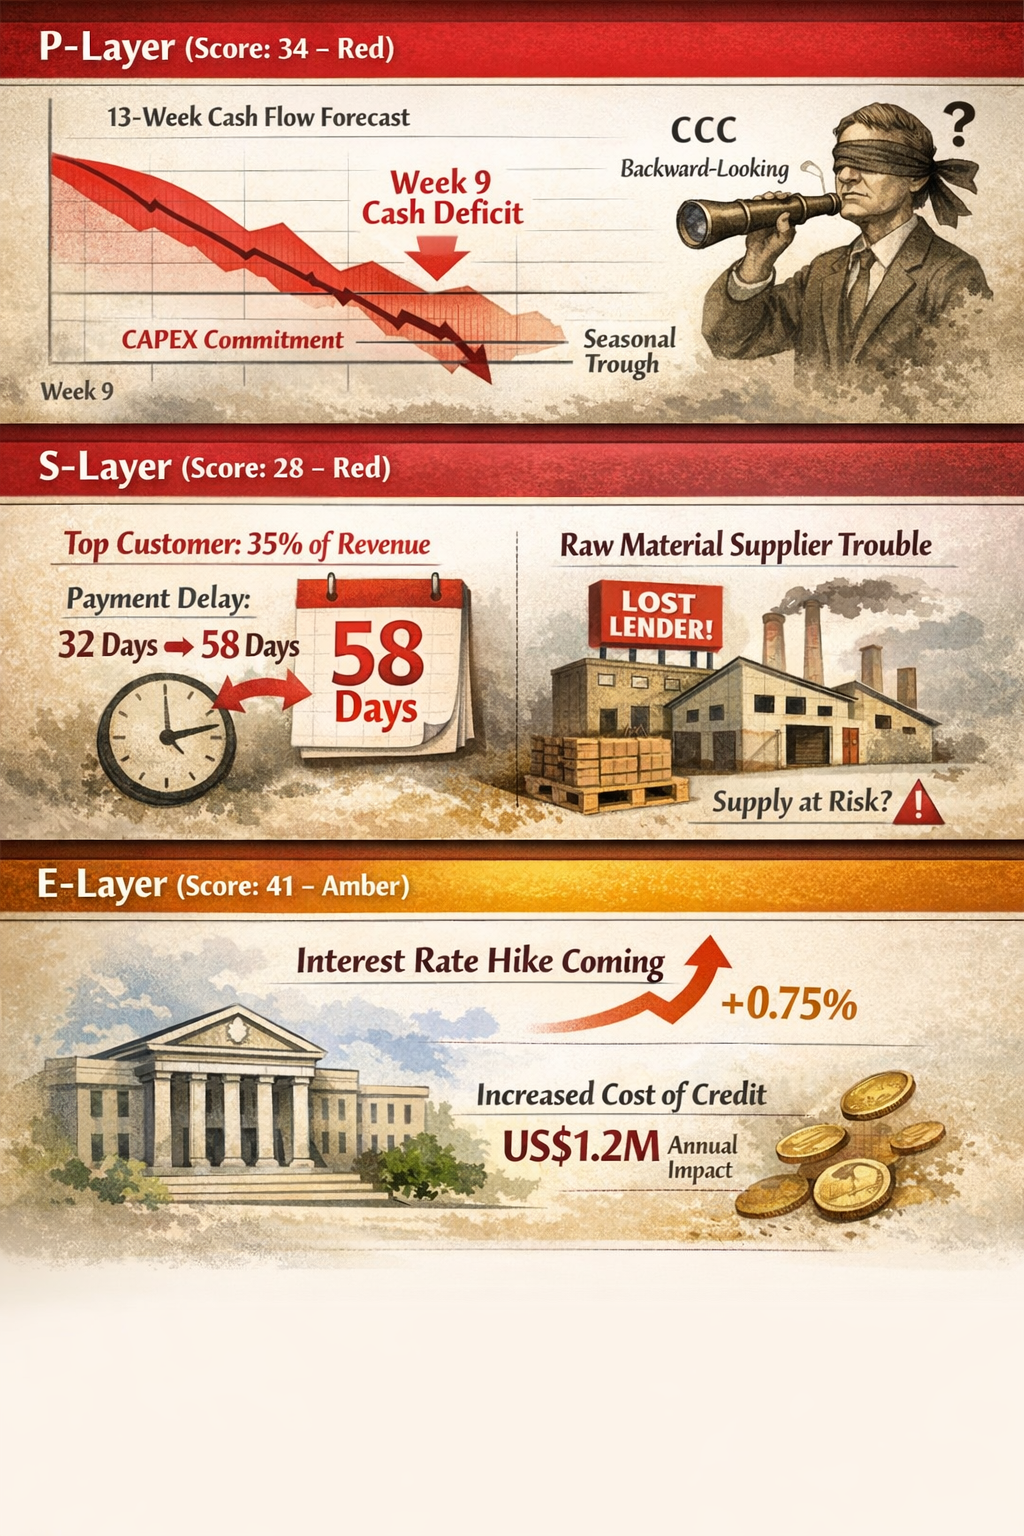
- P-Layer (Score: 34 – Red): The 13-week cash-flow forecast, when adjusted for a known seasonal trough and a pending capex commitment, showed a cash deficit in week nine. The CCC, being backward-looking, could not see this coming.
- S-Layer (Score: 28 – Red): The company’s top customer, representing 35 per cent of revenue, had quietly extended its payment behaviour from 32 days to 58 days over the prior two quarters. The DSO average was masked by faster-paying smaller customers. Additionally, a key raw-material supplier had just lost its primary lender and was at risk of supply interruption.
- E-Layer (Score: 41 – Amber): A pending 75-basis-point interest-rate increase by the central bank was about to raise the cost of the company’s floating-rate revolving credit facility, compressing available liquidity by an estimated US$1.2 million annually.
The composite PULSE Score, had it been calculated, would have been approximately 37 – firmly in the Red Zone. The system would have triggered an immediate Buffer Protocol: activate standby credit facilities, launch a targeted collections campaign on the delinquent top customer, defer the non-critical capex commitment, and engage the at-risk supplier to secure alternative sourcing.
Instead, without PULSE, the company continued operating as though the 38-day CCC told the full story. Eight weeks later, the top customer defaulted on a US$4.7 million receivable. The supplier suffered a production halt. The interest-rate increase landed. The company found itself in a cash crisis that required emergency bridge financing at punitive rates and a painful round of cost-cutting that included staff reductions.
The CCC said 38 days. Reality said crisis. The gap between those two readings is the gap that the WC-PULSE Framework is designed to close.
The CCC said 38 days. Reality said crisis. The gap between those two readings – the gap between the comforting metric and the complex reality – is precisely the gap that the WC-PULSE Framework is designed to close.
Why Every CFO Needs a PULSE Check – Now
The case for moving beyond the CCC has never been more compelling. The operating environment facing finance leaders in 2026 is characterized by persistent interest-rate uncertainty, supply-chain reconfiguration, geopolitical disruption, accelerating technology change, and intensifying competitive pressure. In this environment, the margin for error in working-capital management has narrowed dramatically.
Consider the convergence of forces: elevated borrowing costs mean that excess working capital is more expensive to carry than at any point in the past fifteen years. Simultaneously, lean operations and just-in-time supply chains have reduced the buffers that previously absorbed shocks. The result is a paradox: companies need more liquidity resilience at precisely the moment when carrying that resilience has become more costly.
The WC-PULSE Framework resolves this paradox by providing the precision to calibrate buffers accurately – building them when the data demands protection and releasing them when the data signals opportunity. It replaces the binary choice of “hold more cash” or “deploy more cash” with a nuanced, trigger-based system that optimises the trade-off in real time.
For the CFO, this means three things. First, fewer surprises: the predictive layers surface risk before it materialises. Second, better capital allocation: resources move to their highest-value use based on data, not intuition. Third, stronger board confidence: the PULSE Dashboard provides a governance-ready view of working-capital health that directors can actually use to challenge and support management.
Getting Started: The PULSE Diagnostic Briefing
The transition from CCC-centric management to the WC-PULSE Framework does not require a multi-year transformation programme. Dawgen Global has designed a rapid onboarding process that delivers the first PULSE Baseline Scorecard within two weeks and full framework operationalization within 90 days.
The journey begins with a complimentary 30-minute PULSE Diagnostic Briefing – a focused conversation with a Dawgen Global Working Capital Advisor who will assess your current working-capital posture, identify the PULSE layers most relevant to your industry and operating context, and outline the three highest-impact improvement levers available to your organisation.
Dawgen Global is a full-spectrum advisory firm delivering transformation across Strategy, Finance, Operations, Technology, and Governance. Our Working Capital Advisory practice is powered by the proprietary WC-PULSE Framework™, designed to convert working-capital management from a reactive function into a strategic capability that drives shareholder value. We serve mid-market and large enterprises across the Caribbean, North America, and international markets.
READY TO SEE WHAT YOUR CCC IS HIDING?
Book a Complimentary 30-Minute PULSE Diagnostic Briefing
with a Dawgen Global Working Capital Advisor
We’ll assess your current PULSE Score, identify your top three working-capital improvement levers, and give you a clear view of where your cash is really heading – in one conversation.
This is not a sales pitch. It is a diagnostic conversation designed to give you immediate, actionable insight – the kind of insight that the CCC, for all its familiarity, simply cannot provide.
Contact us :
 Email: [email protected]
 WhatsApp Global Number : +1 555-795-9071
About Dawgen Global
“Embrace BIG FIRM capabilities without the big firm price at Dawgen Global, your committed partner in carving a pathway to continual progress in the vibrant Caribbean region. Our integrated, multidisciplinary approach is finely tuned to address the unique intricacies and lucrative prospects that the region has to offer. Offering a rich array of services, including audit, accounting, tax, IT, HR, risk management, and more, we facilitate smarter and more effective decisions that set the stage for unprecedented triumphs. Let’s collaborate and craft a future where every decision is a steppingstone to greater success. Reach out to explore a partnership that promises not just growth but a future beaming with opportunities and achievements.
Email: [email protected]  Visit: Dawgen Global Website
WhatsApp Global Number : +1 555-795-9071
Caribbean Office: +1876-6655926 / 876-9293670/876-9265210  WhatsApp Global: +1 5557959071
USA Office: 855-354-2447
Join hands with Dawgen Global. Together, let’s venture into a future brimming with opportunities and achievements

