The Cost-to-Serve Truth
Executive Summary
Many organisations think they have a margin problem when they actually have a cost-to-serve problem.
Two customers can buy the same product at the same price—yet one is highly profitable while the other quietly destroys value. The difference is not always revenue. It is how much it costs to serve them across ordering, picking, delivery, returns, credit, support, and exceptions.
In the Caribbean and wider region, cost-to-serve issues are amplified by:
-
dispersed geographies and multi-island logistics
-
volatile fuel and freight costs
-
fragmented trade channels (retail, wholesale, modern trade, e-commerce, tourism/hospitality)
-
small order sizes, frequent deliveries, and high exception handling
-
weak data discipline and manual workflows
This article introduces a practical way to diagnose and fix cost-to-serve leakage using the Cost-to-Serve Profit Cube™ (Customer Segment × Channel × Product Family), and shows how Dawgen’s V.A.L.U.E.-Chain Cost Advantage Framework™ converts insights into validated, sustainable savings—while protecting customer value and strategic growth.
Why “Gross Margin” Isn’t the Full Story
Gross margin tells you what you earn after direct cost of goods sold. It does not tell you what you keep after serving the customer.
In many businesses, cost-to-serve (CTS) includes:
-
order processing and customer service
-
warehousing: picking, packing, staging
-
distribution: deliveries, fuel, third-party logistics, failed drops
-
returns, credits, and claims
-
sales effort, merchandising, promotions execution
-
trade terms, rebates, and discounts
-
collections, credit reviews, disputes
-
service exceptions (rush orders, special packaging, mixed pallets, split shipments)
When you ignore CTS, you treat “revenue” as equal quality. It isn’t.
The Most Common Cost-to-Serve Profit Killers
1) Small orders and high delivery frequency
Multiple drops per week, low drop size, partial pallets, and urgent top-ups multiply transport and handling cost.
2) Exception-heavy customers
Special packaging, non-standard documentation, custom delivery windows, and frequent order changes add hidden workload.
3) Returns and credits that are “normalised”
Returns become routine rather than treated as failure demand. This creates repeated cost and weak accountability.
4) Discount leakage and poorly governed trade spend
Discounts given without clear rules often fund unprofitable volume.
5) Unprofitable channels masked by top-line growth
A channel can grow revenue while destroying cash and service capacity.
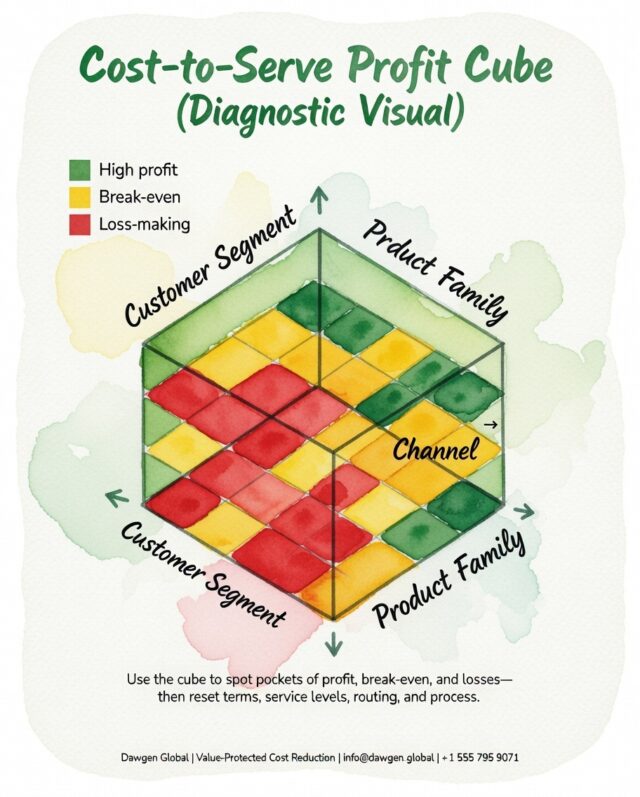
Cost-to-Serve Profit Cube™: The Diagnostic That Changes the Conversation
To diagnose properly, you need to see profitability through three lenses:
Customer Segment × Channel × Product Family
That is the Cost-to-Serve Profit Cube™.
What the cube reveals
-
Which customer segments are profitable only because others subsidise them
-
Which channels have high service demands but insufficient margin to pay for it
-
Which product families create excessive handling cost relative to margin
-
Where operational complexity is concentrated (exceptions, small orders, returns)
Colour band logic (simple and powerful)
-
High profit (green): strong net margin after CTS
-
Break-even (amber): value-neutral—needs correction
-
Loss-making (red): destroying profit—requires action
This cube creates a fact base that leaders can act on without politics or assumptions.
Step-by-Step: Building a Cost-to-Serve Model That Works
You do not need perfect data to start. You need good enough data and strong logic.
Step 1: Define cost pools
Typical CTS cost pools include:
-
order processing (per order)
-
warehouse handling (per line, per case, per pallet)
-
transport (per drop, per km, per weight, per route)
-
returns/credits (per return, per claim)
-
collections (per invoice, per dispute)
-
sales/service effort (per visit, per account)
Step 2: Identify cost drivers
Use drivers that reflect workload, not theory:
-
number of orders
-
number of order lines
-
delivery drops
-
kilometres / route time
-
returns count and value
-
dispute volumes
-
frequency of visits
-
urgency/rush incidents
Step 3: Allocate costs using activity logic
You’re not doing academic ABC costing. You’re building a decision tool:
-
accurate enough to show patterns
-
simple enough to update
-
credible enough to be accepted
Step 4: Link revenue quality to service demand
The cube becomes a management system:
-
price and service terms aligned
-
operational capacity protected
-
growth redirected to profitable segments
What To Do When You Find Loss-Making Customers or Channels
The goal is not to “fire customers” first. The goal is to stop paying the urgency tax and stop subsidising poor economics.
Option A: Reset terms and service levels
-
minimum order quantities (MOQs)
-
delivery frequency caps
-
delivery windows and route discipline
-
charges for rush orders or special handling
-
stricter returns policy and root cause fixes
Option B: Improve route-to-market design
-
consolidate drops by geography
-
shift low-volume customers to pickup points or partner distribution
-
redesign channel roles (who gets what service level)
Option C: Fix commercial leakage
-
reduce discounting without justification
-
tighten trade spend governance
-
improve price realisation by segment
Option D: Reduce operational cost-to-serve
-
automate ordering and invoicing
-
reduce picking complexity
-
standardise packaging and pallet rules
-
improve OTIF and reduce returns
Option E: Exit strategically (only when necessary)
Sometimes the right answer is to exit or restructure the relationship. But that should be the last step—after rational adjustments.
Quick Wins vs Structural Reshape
Quick Wins (0–90 days)
-
implement MOQ and delivery frequency rules for selected segments
-
identify top 20 loss-making accounts and create corrective action plans
-
tighten credit/returns discipline for repeat offenders
-
remove “rush” as a default—require approval and chargeback
-
enforce standard pallet, case, and documentation rules
Structural Reshape (3–18 months)
-
build a full CTS dashboard and cube by month
-
redesign route-to-market and distribution footprint
-
automate order capture and invoicing
-
implement differentiated service levels by segment
-
refresh pricing architecture to reflect true service cost
Sustained Advantage (18+ months)
-
embed CTS into pricing and sales governance
-
maintain a quarterly “profitability cleansing” cycle
-
link service levels to profitability bands
How V.A.L.U.E.™ Makes Cost-to-Serve Savings Real
V — Validate the Profitability Challenge
Confirm the gap: is profit pressure due to cost-to-serve inflation, discount leakage, or channel design?
A — Analyse the Value Chain and Cost-to-Serve
Build the cube and identify drivers of losses.
L — Locate Levers and Build the Opportunity Portfolio
Convert insights into initiatives: pricing, service levels, routing, automation, returns reduction.
U — Uplift & Prioritise
Create business cases with:
-
expected net savings
-
implementation effort
-
risk to customer value
-
timeline to capture
E — Execute with Governance and Controls
Use cadence, owners, and finance validation to ensure savings are captured, not just “identified.”
™ — Transform for Sustainability
Hardwire: CTS governance in commercial decisions, channel strategy, and service policy.
A Composite Example (Anonymised)
A regional distributor discovered:
-
15% of customers generated 55% of service workload
-
one channel had high returns and frequent rush deliveries
-
small orders were creating disproportionate transport cost
Actions taken:
-
introduced MOQs and delivery schedules by segment
-
shifted low-volume accounts to pickup / weekly routes
-
tightened returns policy and fixed root causes
-
improved pricing discipline for high-exception accounts
Result: improved net profitability, reduced operational strain, and better service reliability for priority customers.
Summary
Cost-to-serve is where profit quietly leaks.
The winners will be organisations that:
-
know what it costs to serve each segment
-
align service levels to economics
-
stop paying the urgency tax
-
redesign channels and operations to protect profit
Next Step!
Want a Cost-to-Serve Profit Cube™ for your organisation—so you can target savings without harming growth?
Email [email protected] with the subject line “V.A.L.U.E. – Cost-to-Serve Diagnostic” to request an initial discussion and our data intake checklist.
WhatsApp Global: +1 555 795 9071 | Contact form: https://www.dawgen.global/contact-us/
About Dawgen Global
“Embrace BIG FIRM capabilities without the big firm price at Dawgen Global, your committed partner in carving a pathway to continual progress in the vibrant Caribbean region. Our integrated, multidisciplinary approach is finely tuned to address the unique intricacies and lucrative prospects that the region has to offer. Offering a rich array of services, including audit, accounting, tax, IT, HR, risk management, and more, we facilitate smarter and more effective decisions that set the stage for unprecedented triumphs. Let’s collaborate and craft a future where every decision is a steppingstone to greater success. Reach out to explore a partnership that promises not just growth but a future beaming with opportunities and achievements.
 Email: [email protected]
  Visit: Dawgen Global Website

 WhatsApp Global Number : +1 555-795-9071
Caribbean Office: +1876-6655926 / 876-9293670/876-9265210  WhatsApp Global: +1 5557959071
USA Office: 855-354-2447
Join hands with Dawgen Global. Together, let’s venture into a future brimming with opportunities and achievements

