
1. Why Strategy Must Come Before Ratios
Most readers approach financial statements from the inside out.
They start with the income statement, scan revenue and profit, look at a few ratios, and then form a view.
At Dawgen Global, we deliberately work the other way around.
Before we touch a spreadsheet, we ask a different question:
“What is this business trying to do, and how should that shape the way we read these numbers?”
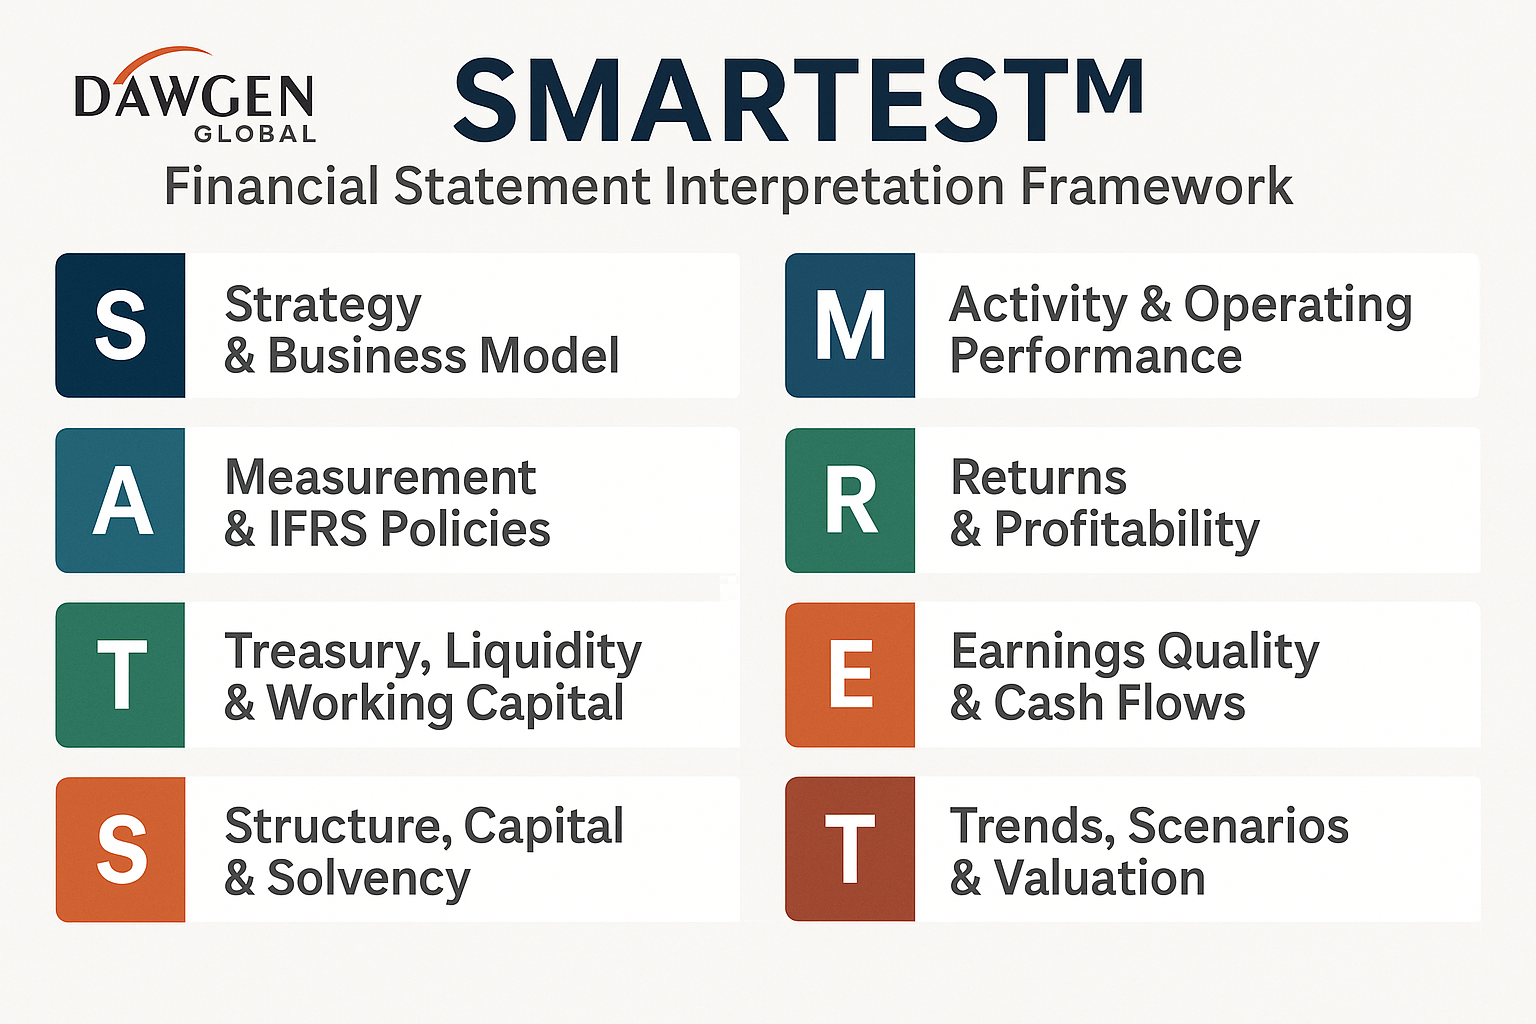
This is the first lens in our SMARTEST™ Financial Statement Interpretation Framework – S for Strategy & Business Model.
Without this lens, financial analysis becomes a mechanical exercise. With it, every line item sits in a meaningful context:
-
Revenue growth is evaluated against clearly defined strategic goals.
-
Cost movements are judged in light of deliberate investment choices.
-
Balance sheet structure is compared to the capital needs of the chosen business model.
For boards, lenders, investors, and entrepreneurs—especially in the dynamic Caribbean environment—this is not an academic detail. It is the difference between seeing a set of numbers and understanding a living business.
2. What We Mean by “Strategy & Business Model”
In the SMARTEST™ framework, Strategy is not a 50-page document sitting in a board portal; it is the real-world pattern of choices that drives how the entity earns revenue, incurs costs, and takes risk.
We break it into four practical components:
-
Value Proposition
-
What problem does the entity solve?
-
For whom?
-
Why do customers choose this business over alternatives?
-
-
Revenue Model
-
How does the entity get paid? (transactions, subscriptions, contracts, interest spreads, fees, commissions, etc.)
-
What drives revenue: volume, price, mix, or a combination?
-
-
Cost & Asset Model
-
What are the major cost buckets (people, technology, logistics, raw materials, branches, plants)?
-
How asset-intensive is the business (heavy PPE vs light, digital vs bricks-and-mortar)?
-
What level of fixed vs variable cost does the model imply?
-
-
Risk & Growth Model
-
What risks must the entity accept to execute its strategy (credit risk, inventory risk, regulatory risk, FX risk, climate risk, etc.)?
-
How does it plan to grow (geographic expansion, product innovation, acquisitions, digital channels)?
-
Together, these elements define the business model—and that business model should leave a clear “financial signature” in the IFRS financial statements.
Our task under the S lens is to decode that signature.
3. Translating Strategy into a Financial Signature
Every strategy shapes the three primary financial statements in recognisable ways. In our work across the Caribbean and beyond, Dawgen Global often starts by asking:
“If this strategy is truly being executed, what would we expect to see in the income statement, balance sheet, and cash flow statement?”
3.1 Income Statement: How Strategy Shows Up in Performance
-
Growth profile
-
A high-growth digital platform should show strong top-line expansion, potentially with negative short-term profits as it invests in scale.
-
A mature utility might show stable, modest revenue growth with steady margins.
-
-
Gross and operating margins
-
A differentiation strategy (premium pricing, strong brand) often supports higher margins.
-
A cost-leadership strategy may show lower margins but superior efficiency and scale.
-
-
Expense patterns
-
A fintech or BPO provider will show higher people and technology costs.
-
An asset-heavy manufacturer shows higher depreciation and maintenance costs.
-
When actual results diverge from the expected signature, the S lens prompts us to ask why. Is the strategy failing, or are we mis-understanding the business model?
3.2 Balance Sheet: How Strategy Shapes Position
-
Asset mix
-
Capital-intensive strategies create large property, plant and equipment balances and often significant lease liabilities under IFRS 16.
-
Asset-light models tilt towards intangibles (software, customer relationships), receivables, and working capital.
-
-
Capital structure
-
Aggressive expansion often correlates with higher leverage, especially if growth is funded through debt or project finance.
-
Conservative, dividend-oriented strategies favour stronger equity buffers and moderate leverage.
-
-
Working capital profile
-
A retailer or distributor carries significant inventory and trade payables.
-
A service firm, such as a professional services or outsourcing business, is more likely to be receivables-heavy, with limited inventory.
-
Again, mismatches between the stated strategy and the balance sheet raise valuable questions. For example, a “capital-light” services business with a balance sheet dominated by long-term borrowings and heavy fixed assets might be out of alignment.
3.3 Cash Flow Statement: Strategy in Motion
-
Operating cash flows
-
A robust, established business should generate strong and relatively stable operating cash flows.
-
A business in a deliberate investment phase may show weak operating cash flows as it builds scale or absorbs restructuring cost.
-
-
Investing cash flows
-
Expansion strategies are visible in capital expenditure, acquisitions, and technology investment.
-
Asset-light digital strategies may show lower capex but higher spend on intangible assets and R&D-type activities where capitalisation criteria are met.
-
-
Financing cash flows
-
Growth through debt issuance or equity raises will be clear in financing flows.
-
A cash-generative, mature business might show net repayments and dividend distributions.
-
Viewing the cash flow statement through S helps us distinguish between temporary mismatches (investing for growth) and structural weaknesses (chronic cash shortfalls inconsistent with the business model).
4. A Practical “Strategy Snapshot” for Financial Interpretation
In our SMARTEST™ engagements, Dawgen Global condenses the Strategy & Business Model lens into a simple, one-page Strategy Snapshot. This becomes the reference point for all later analysis.
A Strategy Snapshot typically includes:
-
Business Overview
-
Sector, geography, life-cycle stage (start-up, growth, mature, turnaround)
-
-
Strategic Goal
-
Dominant objective over the next 3–5 years (growth, margin improvement, cash generation, deleveraging, regional expansion, digital transformation, etc.)
-
-
Revenue Model Summary
-
Key revenue streams
-
Proportion of recurring vs one-off revenue
-
Main pricing levers
-
-
Cost & Asset Model Summary
-
Key cost drivers
-
Capital intensity
-
Major leases, long-term contracts, or funding arrangements
-
-
Risk & Growth Themes
-
Top 4–5 strategic risks
-
Planned growth avenues (new markets, products, acquisitions, partnerships)
-
-
Expected Financial Signature
-
3–5 bullet points on what we expect to see in the financial statements if the strategy is being executed successfully (e.g., “moderate revenue growth with improving EBITDA margins and rising capex-to-sales ratio as we digitise operations”).
-
Before we run ratios or build models, we test the actual IFRS financial statements against this expected signature. Where reality diverges, we have a powerful starting point for deeper questions.
5. Applying the S Lens: Illustrative Examples
To make the Strategy lens concrete, consider two simplified scenarios that often arise in the Caribbean context.
Example 1: A Regional Retail Group
Stated strategy:
Expand across CARICOM markets through new store openings and e-commerce, while positioning as a value retailer.
Expected financial signature:
-
Strong revenue growth, especially in new markets.
-
Moderate gross margins (competitive pricing) but improving operating margins as scale benefits kick in.
-
Rising inventory and right-of-use assets (IFRS 16 leases), plus higher store-related capex.
-
Operating cash flows under pressure during rollout, with significant investing cash flows and increased borrowings.
When we review the IFRS statements:
-
If we see flat revenue, shrinking margins, high inventory write-downs, and increasing short-term bank overdrafts, the S lens flags a serious misalignment.
-
We would ask: Is the expansion truly happening? Are new stores cannibalising existing ones? Is pricing too aggressive for the cost base?
Without the Strategy lens, we might just conclude “profitability is down and debt is up.” With it, we recognise a deeper issue: the executed business model may not match the declared strategy.
Example 2: A Financial Services Provider Going Digital
Stated strategy:
Shift from branch-centric operations to a digital-first model, improving customer experience and lowering unit operating cost.
Expected financial signature:
-
Stable or gradually declining staff and branch operating costs relative to revenue.
-
Higher software and technology expenses, with capitalised development costs where appropriate under IFRS.
-
Lower growth in physical assets, with increased intangible assets and IT-related capex.
-
Meaningful investment cash outflows and potentially restructuring provisions in the short term.
On review, if we see:
-
Branch network and related costs still rising,
-
Limited IT capex or intangible assets, and
-
Minimal restructuring provisions,
the S lens suggests that the digital transformation strategy is not yet embedded in the financial reality—a crucial insight for boards and investors making funding decisions.
6. Key Questions for Stakeholders Using the S Lens
When Dawgen Global facilitates board or lender discussions, we often anchor the conversation in a set of Strategy & Business Model questions:
-
Alignment Questions
-
Do the financial statements reflect the strategy we agreed in the boardroom?
-
Where do we see inconsistencies between strategic intent and financial outcomes?
-
-
Feasibility Questions
-
Does the current capital structure support the growth plans?
-
Is the cost base adaptable enough to deliver the required margins?
-
-
Resilience Questions
-
What strategic risks are visible in the numbers (customer concentration, FX exposures, reliance on a single product or market)?
-
How exposed is the business model to regulatory, technological, or climate-related shocks?
-
-
Execution Questions
-
Which metrics best capture whether the strategy is working (unit economics, active users, same-store sales, net interest margin, etc.)?
-
Are these metrics visible, either directly or indirectly, in the financial statements or notes?
-
By systematically asking these questions under the S lens, stakeholders move beyond surface-level commentary and into strategy-aware financial interrogation.
7. Strategy Red Flags Revealed by the S Lens
Certain patterns in the financial statements can signal strategic stress or misalignment:
-
High revenue growth with consistently negative operating cash flows
May indicate a strategy overly dependent on extended credit terms, unrealistic pricing, or a failure to monetise growth sustainably. -
Rising leverage without corresponding growth in productive assets or earnings
Suggests that debt is funding losses or non-productive expenditure, not the strategic investments claimed. -
Significant capex with no clear link to revenue or margin improvement
Could point to poorly prioritised capital projects, or expansion that is failing to produce strategic benefits. -
Frequent changes in revenue recognition policies or segment reporting
Might be legitimate responses to new standards or business evolution—but could also mask deeper strategic instability.
The Strategy & Business Model lens does not assume bad faith; instead, it prompts careful, structured questioning. For lenders and investors, this can be the difference between identifying risk early and discovering problems too late.
8. Connecting S to the Rest of SMARTEST™
Although Strategy & Business Model is the first lens, it is not a standalone exercise. It connects directly to the other elements of the SMARTEST™ framework:
-
Measurement (M): Strategy influences the choice of IFRS policies and estimates—for example, determining whether revenue is recognised over time or at a point in time.
-
Activity (A): Operating performance is meaningful only relative to the strategic expectations for growth, margin, and efficiency.
-
Returns (R): We assess value creation by asking whether the returns generated are appropriate for the chosen strategy and risk level.
-
Treasury (T), Earnings Quality (E), Structure (S), Trends (T): All depend on first understanding what the entity is trying to achieve.
In Dawgen Global engagements, the Strategy Snapshot created at the beginning is revisited at each stage of the SMARTEST™ review. It serves as the compass ensuring that our interpretation remains anchored, coherent, and decision-oriented.
9. How Dawgen Global Can Help
Dawgen Global uses the SMARTEST™ Financial Statement Interpretation Framework to support clients across the Caribbean and beyond in:
-
Audit and assurance debriefs that translate IFRS financial statements into strategic insights.
-
Board and audit committee training, building confidence in reading financial statements through a strategy-first lens.
-
Bank and lender reviews, helping credit teams link borrower financials to underlying business models.
-
Valuation, M&A, and restructuring engagements, where understanding strategic intent and business model resilience is critical to pricing and risk assessment.
-
Business coaching and performance improvement, guiding entrepreneurs to align their numbers with their growth ambitions.
In every case, our goal remains constant:
To help you make Smarter and More Effective Decisions.
10. Looking Ahead in the Dawgen Decodes Series
This article has focused on the first lens in the SMARTEST™ framework: S for Strategy & Business Model—the essential starting point for any serious interpretation of IFRS financial statements.
In the next article in the Dawgen Decodes series, we will turn to the second lens:
“M is for Measurement: Why IFRS Policies and Estimates Can Change the Whole Story.”
There, we will explore how judgement, estimation, and policy choices translate economic activity into reported numbers—and how users can identify where those judgements matter most.
Until then, we invite you to look at your organisation’s financial statements with a fresh question in mind:
“Do these numbers truly reflect our strategy—and if not, what do they tell us?”
About Dawgen Global
“Embrace BIG FIRM capabilities without the big firm price at Dawgen Global, your committed partner in carving a pathway to continual progress in the vibrant Caribbean region. Our integrated, multidisciplinary approach is finely tuned to address the unique intricacies and lucrative prospects that the region has to offer. Offering a rich array of services, including audit, accounting, tax, IT, HR, risk management, and more, we facilitate smarter and more effective decisions that set the stage for unprecedented triumphs. Let’s collaborate and craft a future where every decision is a steppingstone to greater success. Reach out to explore a partnership that promises not just growth but a future beaming with opportunities and achievements.
 Email: [email protected]
  Visit: Dawgen Global Website

 WhatsApp Global Number : +1 555-795-9071
Caribbean Office: +1876-6655926 / 876-9293670/876-9265210  WhatsApp Global: +1 5557959071
USA Office: 855-354-2447
Join hands with Dawgen Global. Together, let’s venture into a future brimming with opportunities and achievements

