Executive Summary
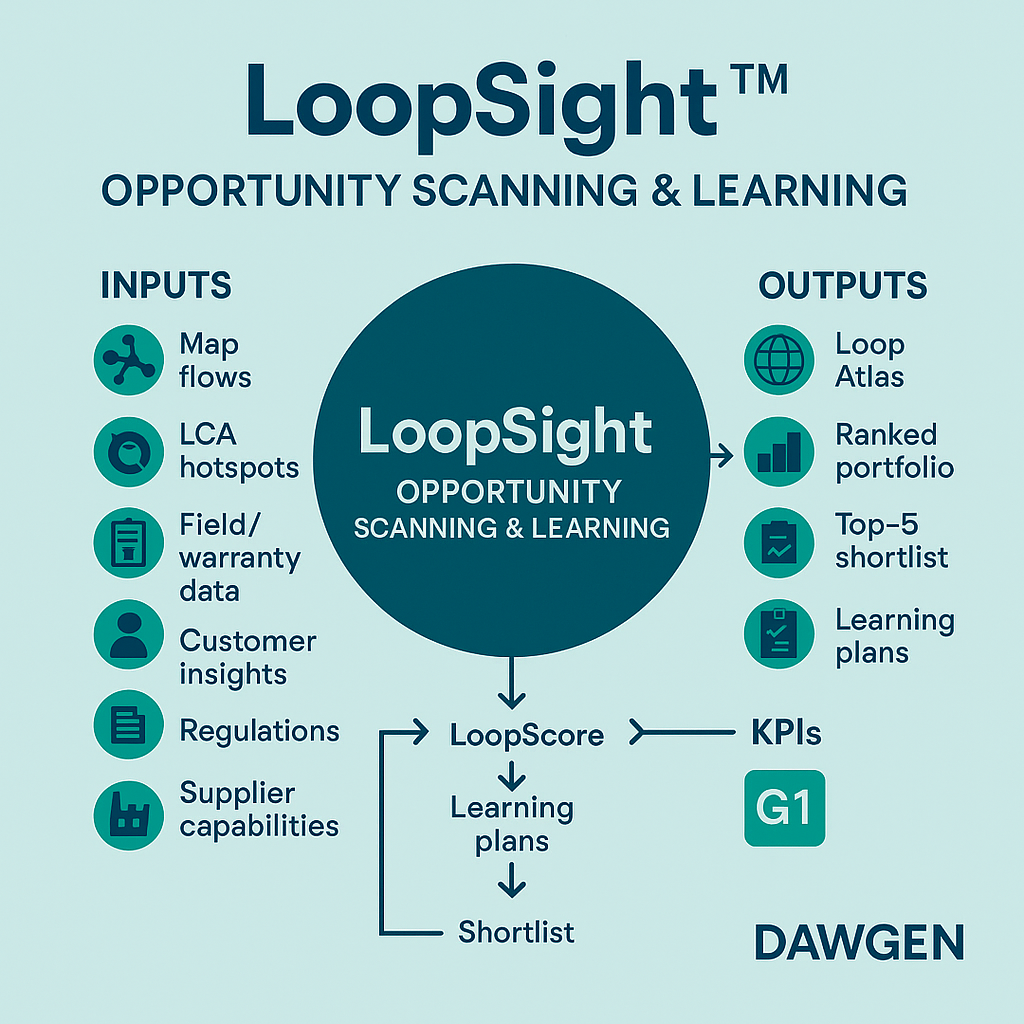
Business leaders agree that circular economy principles are strategically important—but many still struggle to identify where to start and how to fund initiatives with confidence. LoopSight™ is Dawgen Global’s structured discovery system that turns scattered ideas into a ranked pipeline of investable opportunities. It blends material flow analytics, customer and field insights, and a transparent scoring rubric (LoopScore™) to surface the few bets that matter, fast. This article details the LoopSight™ approach, the artifacts it produces, how it reduces risk, and what executives should expect in the first 90 days. We also provide practical guidance on metrics, governance, and common pitfalls—so your circular ambition becomes a reliable source of margin, resilience, and brand trust.
Core promise: LoopSight™ converts end‑of‑use from a cost centre into a value engine—revealing where repair, reuse, refurbishment, remanufacture, recycling, and composting can create measurable returns in both technical and biological cycles.
Why Discovery Fails—and How LoopSight™ Fixes It
Most circular discovery efforts fall into three traps:
- Idea overload without evidence. Teams brainstorm dozens of initiatives but lack data on addressable volumes, recovery yields, or customer participation. Effort spreads thin; nothing gets proven.
- Impact without economics. Ambitions are framed as sustainability projects, not business cases. Without unit‑level margins, hurdle rates, or payback windows, investments stall.
- Pilots that don’t decide. Pilots run without clear hypotheses or exit criteria, consuming time and capital without producing “scale/no‑go” evidence.
LoopSight™ is designed to avoid these traps through a disciplined sequence: map the system, create Opportunity Cards, attach Learning Plans, and rank them with LoopScore™. Each step creates a tangible artifact that senior leaders can scrutinize and approve, moving circularity from aspiration to accountable action.
The LoopSight™ Workflow
LoopSight™ organizes discovery into five tightly linked activities. Each activity produces named outputs that become the spine of governance.
1) Build the Loop Atlas (See the System)
We begin by visualizing how value currently flows and leaks. The Loop Atlas integrates:
- Material Flow Analysis (MFA): mass balance across your supply chain showing where materials are consumed, recovered, or wasted.
- Lifecycle Assessment (LCA) hot‑spots: emissions and impact at each lifecycle stage to find high‑leverage intervention points.
- Field and warranty data: failure modes, return rates, repair logs, and service times, which often reveal hidden value in parts harvesting and design improvements.
- Customer and channel insights: return convenience, incentives, attitudes toward certified pre‑owned, willingness to subscribe to Product‑as‑a‑Service (PaaS).
Output: An annotated Sankey/heatmap that illuminates losses and bottlenecks across technical and biological cycles. Executives can now see where circular value is plausible and worth testing.
2) Generate Opportunity Cards (Frame the Bets)
For each product line or material stream, we draft an Opportunity Card that fits on one or two pages. It includes:
- Loop hypothesis: e.g., “Remanufacture 40% of returned units using recovered components; sell certified pre‑owned with updated warranty.”
- Addressable volumes: how many units/materials could realistically be captured, by channel and geography.
- Recovery and yield assumptions: triage grades, parts salvage rates, material purity bands.
- Unit economics (ranges): cost to collect/triage, refurbishment/processing costs, expected selling price, and margin bands.
- Impact lens: virgin material displacement, landfill diversion, carbon intensity change per functional unit.
- Top unknowns: the 3–5 variables that could swing the economics or feasibility.
Output: A portfolio of cards—often 15–40 for a diversified manufacturer or service provider—that create a common language for options.
3) Attach Learning Plans (Reduce the Unknowns)
Unlike pilots that “try something and see,” LoopSight™ treats testing as an investment in knowledge. Each card gets a Learning Plan that specifies:
- Unknowns to resolve (e.g., “real return rate from business customers,” “grade distribution on intake,” “warranty cost tail risks”).
- Tests/MVPs to close those unknowns (e.g., 6‑week targeted take‑back in two stores; pop‑up refurbishment cell; remote diagnostics trial).
- Success criteria defined before the test (e.g., “≥55% capture rate at incentive of $X,” “first‑pass yield ≥80%,” “turnaround ≤5 days”).
- Owners, budgets, and timelines (usually 4–8 weeks per cycle).
Output: Time‑boxed experiments that convert uncertainty into decision‑ready information, improving investment confidence.
4) Rank with LoopScore™ (Make Choices Visible)
LoopScore™ is Dawgen Global’s transparent scoring rubric that weights eight dimensions out of 100 total points:
- Economic Value (25) – projected NPV, margin uplift, payback range.
- Material Impact (20) – virgin displacement, recovery yield, landfill diversion.
- Feasibility (15) – capability fit, complexity, time‑to‑pilot.
- Customer Fit (10) – demand indicators, NPS potential, brand lift.
- Regulatory & Risk (10) – EPR alignment, warranty/quality risks, compliance.
- Ecosystem Leverage (10) – partner readiness, by‑product markets.
- Data Readiness (5) – traceability, data quality, gaps.
- Learning Potential (5) – how quickly unknowns can be closed.
Every sub‑score includes a confidence band (High/Medium/Low) so decision‑makers grasp the uncertainty—not just the point estimate.
Output: A ranked Opportunity Portfolio with a Top‑5 shortlist that moves into funding dialogue.
5) Gate G1: Portfolio Commit
The LoopSight™ phase ends with a formal gate review. Short‑listed options that meet threshold scores and possess credible learning plans are allocated seed budgets and executive sponsors. Those that do not are parked rather than half‑pursued.
Output: A senior‑approved shortlist with budgets, owners, and learning timelines—ready to transition to BetForge™.
What Good Looks Like: The LoopSight™ Artifacts
Leaders should expect three high‑value deliverables at the end of LoopSight™:
- Loop Atlas – a clear visual of flows, leakages, and hot‑spots that makes circular value intuitive to non‑experts.
- Opportunity Cards + Learning Plans – concise, comparable summaries that turn abstract ideas into testable, fundable options.
- Ranked Portfolio with LoopScore™ – a defensible method for choosing which opportunities to back now, later, or not at all.
These artifacts become the basis for capital allocation, board updates, and cross‑functional alignment in the next phase.
Metrics that Matter in Discovery
Even in discovery, measurement matters. We recommend tracking:
- Learning velocity: hypotheses closed per quarter; average time to learn.
- Portfolio yield: % of opportunities that graduate to BetForge™ after tests.
- Evidence quality: % of decisions supported by controlled tests vs. anecdotes.
- Cost to learn: discovery spend per hypothesis closed.
- Early impact indicators: preliminary capture rate, triage yield, repair turnaround, refurbished unit margin bands.
These metrics incentivize teams to discover efficiently, not endlessly.
A 90‑Day LoopSight™ Plan (Practical Timeline)
Weeks 1–2: Mobilize & Map
- Kick‑off with executive sponsor; define scope and governance.
- Collect BoMs, service logs, return data, and LCA studies; run rapid data health checks.
- Draft the first version of the Loop Atlas; validate with cross‑functional teams.
Weeks 3–5: Generate & Quantify
- Create 20–30 Opportunity Cards across priority product lines/material streams.
- Estimate addressable volumes, capture/return rates, grade distributions, and margin bands; identify top unknowns.
Weeks 6–7: Score & Shortlist
- Apply LoopScore™ with cross‑functional scoring workshops.
- Produce a ranked portfolio; select the Top 5 for learning plans.
Weeks 8–10: Plan to Learn
- Write Learning Plans with specific tests, success criteria, owners, and budgets.
- Prepare the G1 gate pack.
Weeks 11–13: Gate G1
- Conduct the executive review; approve seed budgets and sponsors.
- Transition short‑listed bets into BetForge™ for chartering and pilot design.
By Day 90, leadership has a defensible shortlist, an agreed learning roadmap, and line of sight to the pilots that matter.
The Human Side: Building Alignment and Momentum
LoopSight™ works best when it is socialized as a shared discovery process, not a sustainability side‑project. We recommend:
- Co‑creation workshops with Product, Supply Chain, Service, Finance, and Legal to enrich assumptions and build ownership.
- Frontline interviews with service technicians, store managers, and recyclers—often the fastest way to surface pragmatic opportunities.
- Sales enablement briefings to address cannibalization fears early and position refurbished or PaaS as complementary revenue.
- Supplier and partner dialogues to gauge capability, quality variance, and service‑level realities.
This creates the cultural conditions for speed in BetForge™ and ScaleGrid™.
Common Pitfalls in Discovery—and How to Avoid Them
- False precision. Over‑engineered spreadsheets hide uncertainty and encourage premature commitment.
- Countermeasure: publish ranges and confidence bands; fund learning, not conclusions.
- Cherrypicked wins. Teams highlight small victories while ignoring systemic constraints (e.g., limited return capture).
- Countermeasure: require end‑to‑end metrics: capture rate → triage yield → refurbishment yield → margin.
- Siloed scoring. Functions score opportunities in isolation, producing political rather than economic selections.
- Countermeasure: cross‑functional scoring sessions with a neutral facilitator and pre‑agreed weights.
- Ignoring channel dynamics. Pilots launch without revisiting incentives or messaging for sales and service teams.
- Countermeasure: include channel readiness and incentive design in Opportunity Cards.
- Underinvesting in data plumbing. Without material passports or return‑intake data, yields remain cloudy.
- Countermeasure: add minimal viable traceability (QR/RFID + intake grading) to early tests; define the target data model.
Illustrative Vignette: Turning Field Failures into Margin
A regional equipment maker faced rising warranty costs and spare‑parts shortages. LoopSight™ revealed a pattern: three components accounted for 60% of returns, yet 70% of the returned assemblies were reusable after minor refurbishment. Opportunity Cards quantified a remanufacture loop that would:
- Harvest reusable components at intake with standardized grading.
- Refurbish assemblies in a small “triage cell” near the service depot.
- Offer certified pre‑owned units with adjusted warranties.
Learning Plans tested two variables: achievable capture rate with a deposit‑back incentive, and first‑pass yield with upgraded inspection jigs. Within eight weeks, the pilot achieved:
- Capture rate: 58% of eligible returns.
- First‑pass yield: 82% refurbishment success.
- Unit margin: +9 percentage points vs. new build.
The opportunity cleared the G1 threshold and proceeded to BetForge™ with high executive confidence—not because the numbers were perfect, but because the unknowns were measurably reduced.
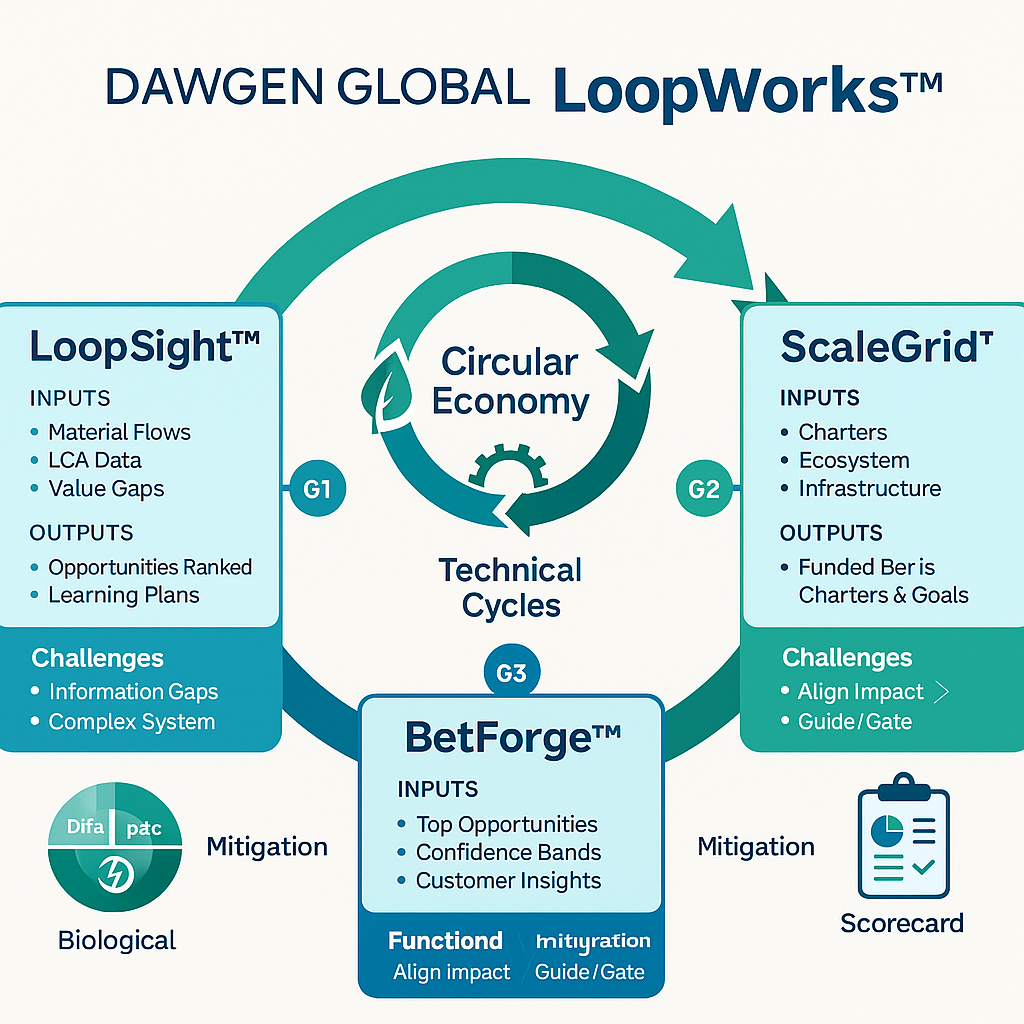
How LoopSight™ Connects to BetForge™ and ScaleGrid™
LoopSight™ is the feeder system for the rest of the LoopWorks™ model:
- The Top‑5 shortlist becomes the raw material for Bet Charters—formal investment cases with OKRs, budgets, and exit rules.
- Learning data informs pilot design (cohort sizes, geographies, channels) and M&V protocols in BetForge™.
- Early data plumbing (passports, intake grading) becomes the backbone for ScaleGrid™ dashboards and governance.
In short: LoopSight™ solves “where to play” and “what to learn,” so the next phases can solve “how to win” and “how to scale.”
FAQs for Executives
Q1: How much data do we need to start?
Enough to estimate volumes, yields, and economics in ranges. LoopSight™ is designed to work with imperfect data and to fund the tests that improve it.
Q2: How do we avoid greenwishing?
Every Opportunity Card includes unit‑level economics, material impact, and confidence bands. Gate criteria require credible learning plans before funding.
Q3: Where does the capital come from?
We help set stage‑gated budgets. Early capex is often minimized through leasing options, shared facilities, or partner arrangements until volume justifies ownership.
Q4: What’s different about Dawgen Global?
We are builders, not just advisors. Our Caribbean‑honed resilience meets global standards, and our LoopWorks™ toolkit (Loop Atlas, LoopScore™, Bet Charters, dashboards) is purpose‑built for circular scale‑ups.
Leadership Checklist: Are We LoopSight™‑Ready?
- We can access BoMs, service logs, and basic return data for priority lines.
- We have an executive sponsor and a cross‑functional team (Product, Supply, Service, Finance, IT, Legal).
- We’re willing to publish ranges and confidence bands instead of forcing premature certainty.
- We have appetite to run 2–3 time‑boxed tests in the next 8–10 weeks.
- We will use a formal Gate G1 to select what advances—and stop what doesn’t.
If you can tick most of these boxes, you’re ready to turn waste into a workhorse.
The Dawgen Toolkit You’ll Use in LoopSight™
- Loop Atlas Template – for Sankey/heatmaps of material and value flows.
- Opportunity Card & Learning Plan Templates – standardized, comparable summaries with economics and impact.
- LoopScore™ Scoring Sheet – weighted rubric with guidance and examples.
- Confidence Banding Guide – how to express uncertainty credibly for leadership.
- Gate G1 Pack – investor‑grade slides for decision‑making.
These assets standardize discovery so your teams can move faster together.
Conclusion: From Visibility to Velocity
Circular economy strategies deliver when they align vision, evidence, and capital. LoopSight™ is the visibility engine that makes circular value obvious, comparable, and fundable. It gives leaders a confident start, a pipeline of investable options, and a language that unites Product, Operations, Finance, and Sustainability around measurable outcomes. With the right governance, those options become pilots, those pilots become operations, and those operations become a durable competitive advantage—resilient margins, lower material risk, and a brand story customers want to buy into.
The next step is simple: see your system, choose your bets, and learn fast. That is how waste becomes a workhorse.
Build Your LoopSight™ Pipeline
Ready to discover—and fund—the circular initiatives that truly move the needle? Let’s get your first 90 days on the calendar.
Request a proposal today:
Email: [email protected]
WhatsApp: +1 555 795 9071
Dawgen Global | LoopWorks™ — Smarter and More Effective Decisions, by design
About Dawgen Global
“Embrace BIG FIRM capabilities without the big firm price at Dawgen Global, your committed partner in carving a pathway to continual progress in the vibrant Caribbean region. Our integrated, multidisciplinary approach is finely tuned to address the unique intricacies and lucrative prospects that the region has to offer. Offering a rich array of services, including audit, accounting, tax, IT, HR, risk management, and more, we facilitate smarter and more effective decisions that set the stage for unprecedented triumphs. Let’s collaborate and craft a future where every decision is a steppingstone to greater success. Reach out to explore a partnership that promises not just growth but a future beaming with opportunities and achievements.
✉️ Email: [email protected] 🌐 Visit: Dawgen Global Website
📞 📱 WhatsApp Global Number : +1 555-795-9071
📞 Caribbean Office: +1876-6655926 / 876-9293670/876-9265210 📲 WhatsApp Global: +1 5557959071
📞 USA Office: 855-354-2447
Join hands with Dawgen Global. Together, let’s venture into a future brimming with opportunities and achievements

