
| IN BRIEF
Before a lender meets a borrower, it has usually already calculated three numbers: how many years of earnings the debt represents, how many times earnings cover the interest, and how comfortably the cash the business generates covers every payment due. Most chief executives walk into the meeting without knowing any of them. This article explains the three questions every lender asks, the ratios that answer them on both EBITDA (earnings before interest, tax, depreciation and amortisation) and EBITA (earnings before interest, tax and amortisation), why the binding limit is often not the one owners expect, and a Borrowing Capacity Test that lets a chief executive calculate what the business can carry before asking for it.
|
SECTION 1
The credit committee the owner never attended

The owner had prepared well. The business, a manufacturer and distributor of building products, had grown steadily for ten years. It earned EBITDA of US$3.0 million. It owed the bank US$7.5 million, two and a half times EBITDA, a level the owner had been told was comfortable. It had a plan for a new production line that would add around US$0.8 million a year of EBITDA once it was running. The request was for a further US$5.0 million, repayable over five years.
The relationship manager was encouraging. The owner left the meeting confident.

The decision came back three weeks later. The bank would lend US$1.5 million, not five, and only on a longer tenor than requested. The letter referred to “debt service capacity” and “leverage headroom” and thanked the owner for the relationship.
The owner had not seen the calculation. But it was not complicated, and it had been done before the first meeting. With the extra borrowing, net debt would reach more than four times EBITDA, and more than six times EBITA. Interest cover would fall to three times. And the cash the business actually generated each year, after tax and after the spending needed to keep its existing plant running, would cover the annual interest and repayments only about seven-tenths of the way. The new line’s earnings could not count yet, because the line did not exist.
None of this was hidden. It was simply never calculated by the one person who most needed to know it.
This is a composite, drawn from patterns seen across the region rather than from any single business or lender.
SECTION 2
The Number Behind the Number™ and the E·B·I·T·A Lens™
The Number Behind the Number™ is a twelve-part series on the ratios that decide how a business is financed, valued and judged. Each article stands on its own, so the framework is set out in full here, as it is in every article in the series.
Two measures, one difference
Both measures begin with what the business earns from its operations, before the cost of financing it and before tax.
EBITDA — earnings before interest, tax, depreciation and amortisation — shows operating earnings before any charge for the assets the business uses. It is the figure bankers, bond arrangers and buyers quote most often, because it removes financing choices, tax positions and accounting estimates and so lets one business be compared with another.
EBITA — earnings before interest, tax and amortisation — deducts depreciation, the accounting recognition that buildings, plant, vehicles and equipment wear out and must be replaced. It still excludes amortisation, which relates mostly to intangible assets such as acquired goodwill and customer lists.
| EBITDA − EBITA = Depreciation |
Neither measure is right and the other wrong. EBITDA is the better lens for comparing operating efficiency and short-term debt capacity; EBITA is the better lens wherever replacing assets is a real, recurring cost.
The Wear Ratio
The series connects the two with one additional measure, depreciation as a share of EBITDA:
| Wear Ratio = Depreciation ÷ EBITDA |
It shows how much of every dollar earned before charging for assets is needed simply to keep those assets standing. The higher it is, the further EBITDA overstates what the owners can safely take out or borrow against.
The five lenses
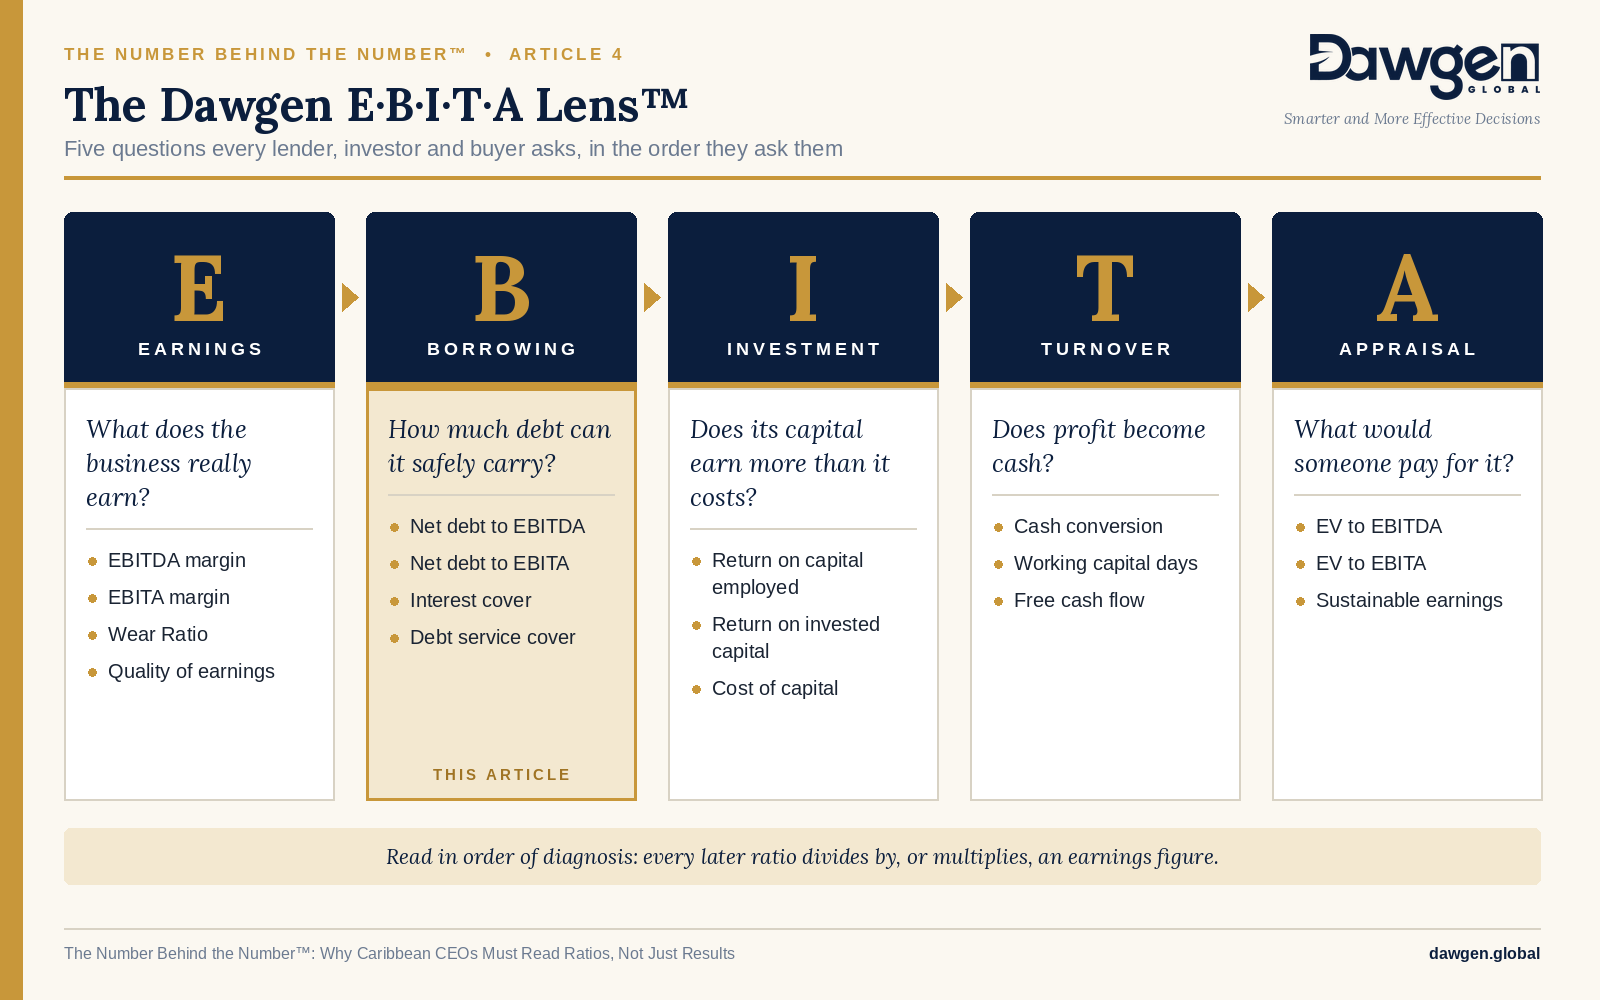
The Dawgen E·B·I·T·A Lens™ turns the acronym into five questions that every serious reader of a company’s accounts asks, in roughly this order.
| Lens | The question | The ratios that answer it |
| E — Earnings | What does the business really earn? | EBITDA margin, EBITA margin, Wear Ratio, quality of earnings |
| B — Borrowing | How much debt can it safely carry? | Net debt to EBITDA and to EBITA, interest cover, debt service coverage ratio (DSCR) |
| I — Investment | Does its capital earn more than it costs? | Return on capital employed (ROCE), return on invested capital (ROIC) |
| T — Turnover | Does profit become cash? | Cash conversion, working capital days, free cash flow |
| A — Appraisal | What would someone pay for it? | Enterprise value (EV) to EBITDA and to EBITA |
Articles 1 to 3 completed the first lens, Earnings: what the business earns, how much of it is needed to stand still, and whether the figure can be trusted. This article opens the second lens, Borrowing. Every ratio in it divides or multiplies an earnings figure, which is why the earnings lens comes first: a lender’s view of capacity is only as good as the EBITDA it accepts.
SECTION 3
The pattern: three questions every lender asks

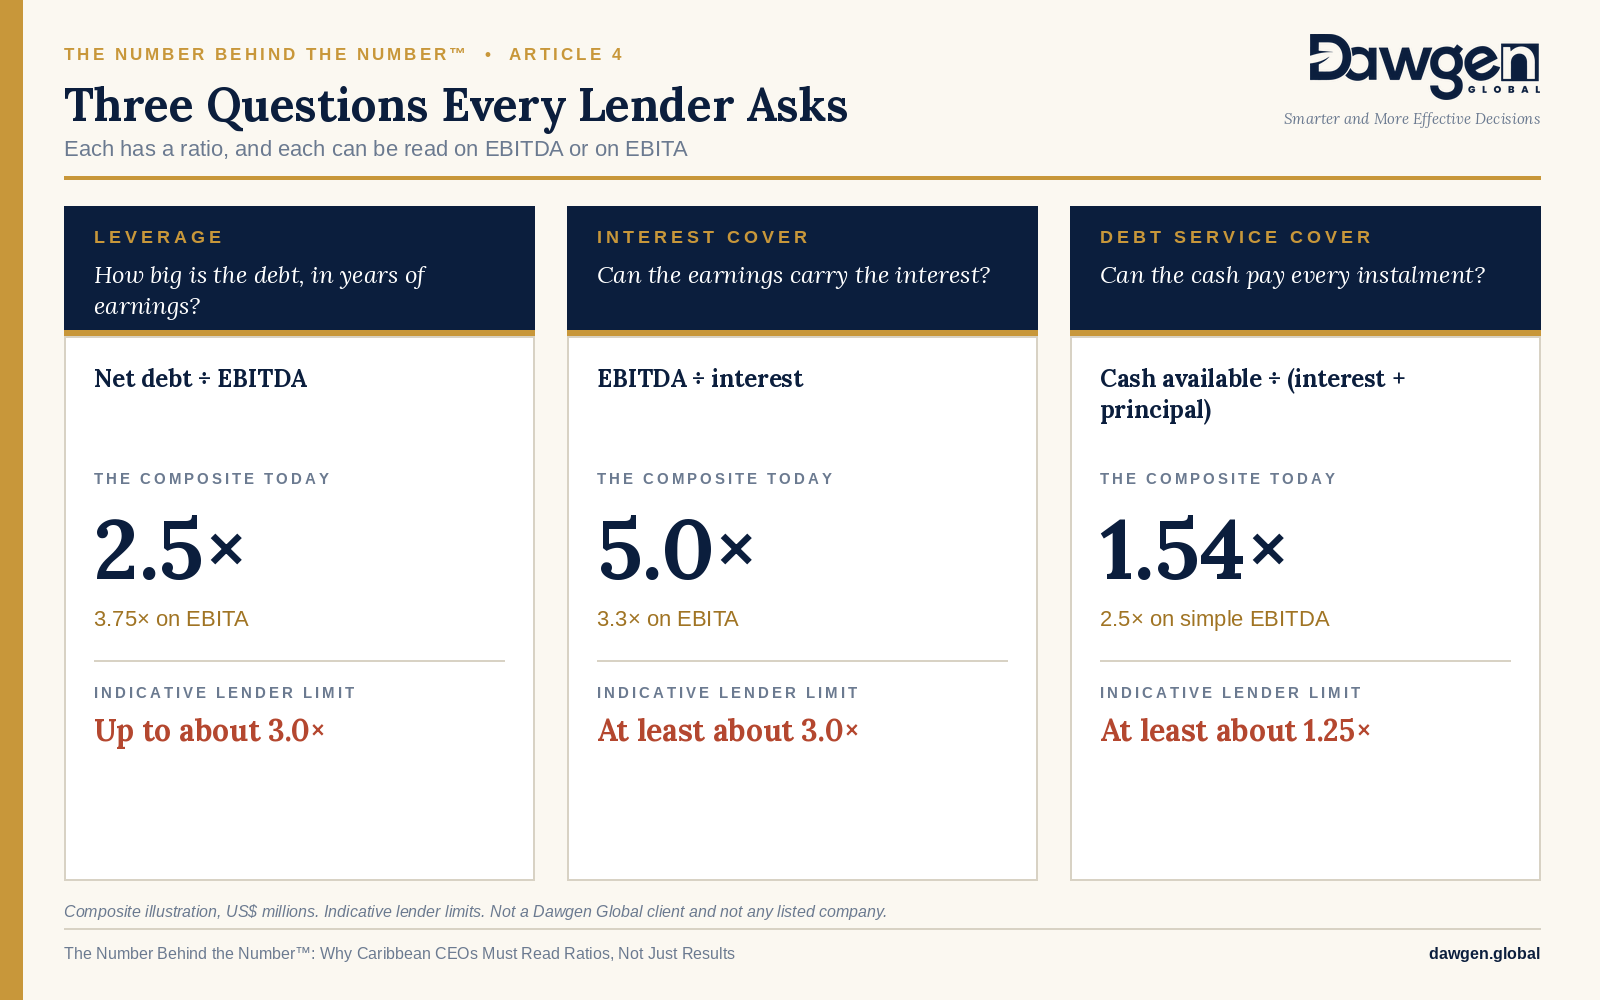
Lenders use different words and different templates, but almost all of them ask the same three questions of a borrower’s accounts. Each question has a ratio, and each ratio can be read on EBITDA or on EBITA.
Question 1: How big is the debt, measured in years of earnings?
| Leverage = Net debt ÷ EBITDA |
Net debt is borrowing less cash. Leverage says how many years of operating earnings it would take to repay the debt if every dollar went to the lender. A business with net debt of US$7.5 million and EBITDA of US$3.0 million has leverage of 2.5 times.
Read on EBITA, the same debt looks heavier. With depreciation of US$1.0 million, EBITA is US$2.0 million, and leverage is 3.75 times. The EBITA reading answers a harder question: how long would repayment take if the business also kept its assets in working order? The higher the Wear Ratio, the wider the gap between the two readings.
Question 2: Can the earnings carry the interest?
| Interest cover = EBITDA ÷ Interest |
Interest cover says how many times operating earnings exceed the interest bill. At interest of US$0.6 million, the business above has cover of 5.0 times on EBITDA and 3.3 times on EBITA. Some lenders use EBITDA, some EBIT (earnings before interest and tax), some EBITA. The more conservative the measure, the lower the cover. A chief executive should know which one the lender uses.
Question 3: Can the cash pay every instalment?
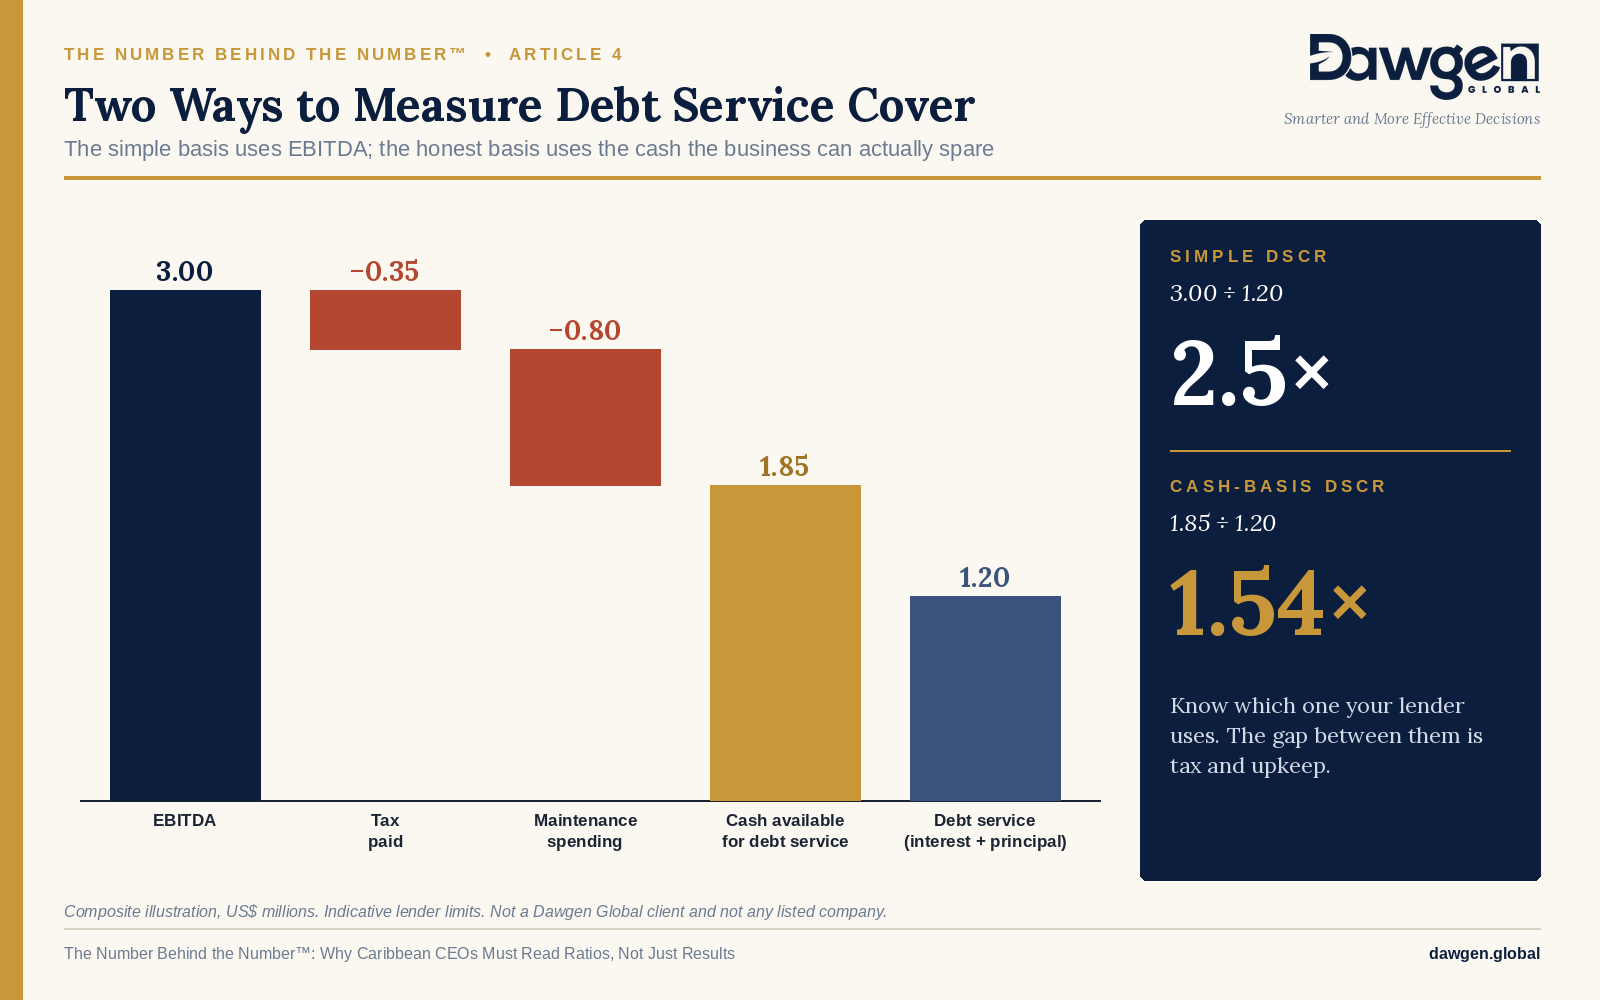
| DSCR = Cash available for debt service ÷ (Interest + Principal repayments) |
The debt service coverage ratio (DSCR) is the question most owners overlook, and the one that most often decides the answer. Leverage and interest cover ignore repayments of principal. DSCR does not. A loan that must be repaid over five years demands far more cash each year than the same loan over fifteen.
Lenders define the numerator in different ways. The simplest uses EBITDA. A stricter definition, and a more honest one, uses cash available for debt service: EBITDA less tax paid and less the capital spending needed to maintain the existing assets. For the business above, with tax of US$0.35 million and maintenance spending of US$0.8 million, that is US$1.85 million, well below EBITDA of US$3.0 million.
The binding limit is usually not the one owners watch
Owners tend to watch leverage, because it is the ratio most often quoted. Lenders watch all three, and lend only up to the lowest of the ceilings they imply. For a business with short-tenor debt, a high Wear Ratio or a large tax bill, that ceiling is very often set by debt service, not by leverage. The owner in the opening story was right that 2.5 times was comfortable. He was measuring the wrong limit.
What lenders add around the ratios
The three ratios are the core. Around them, lenders apply judgement to:
- Security: land, buildings, equipment or receivables that can be charged, and how readily they could be sold.
- Earnings quality: which adjustments to EBITDA they accept, which is why the Adjustment Ledger in Article 3 matters before any application.
- Trend and volatility: a business whose EBITDA swings with the season or the exchange rate will be lent less than one with the same average and a steadier path.
- Definitions: whether lease liabilities count as debt, whether cash can be netted, and whether covenants are tested on the last twelve months or the year-end.
SECTION 4
The Caribbean variant

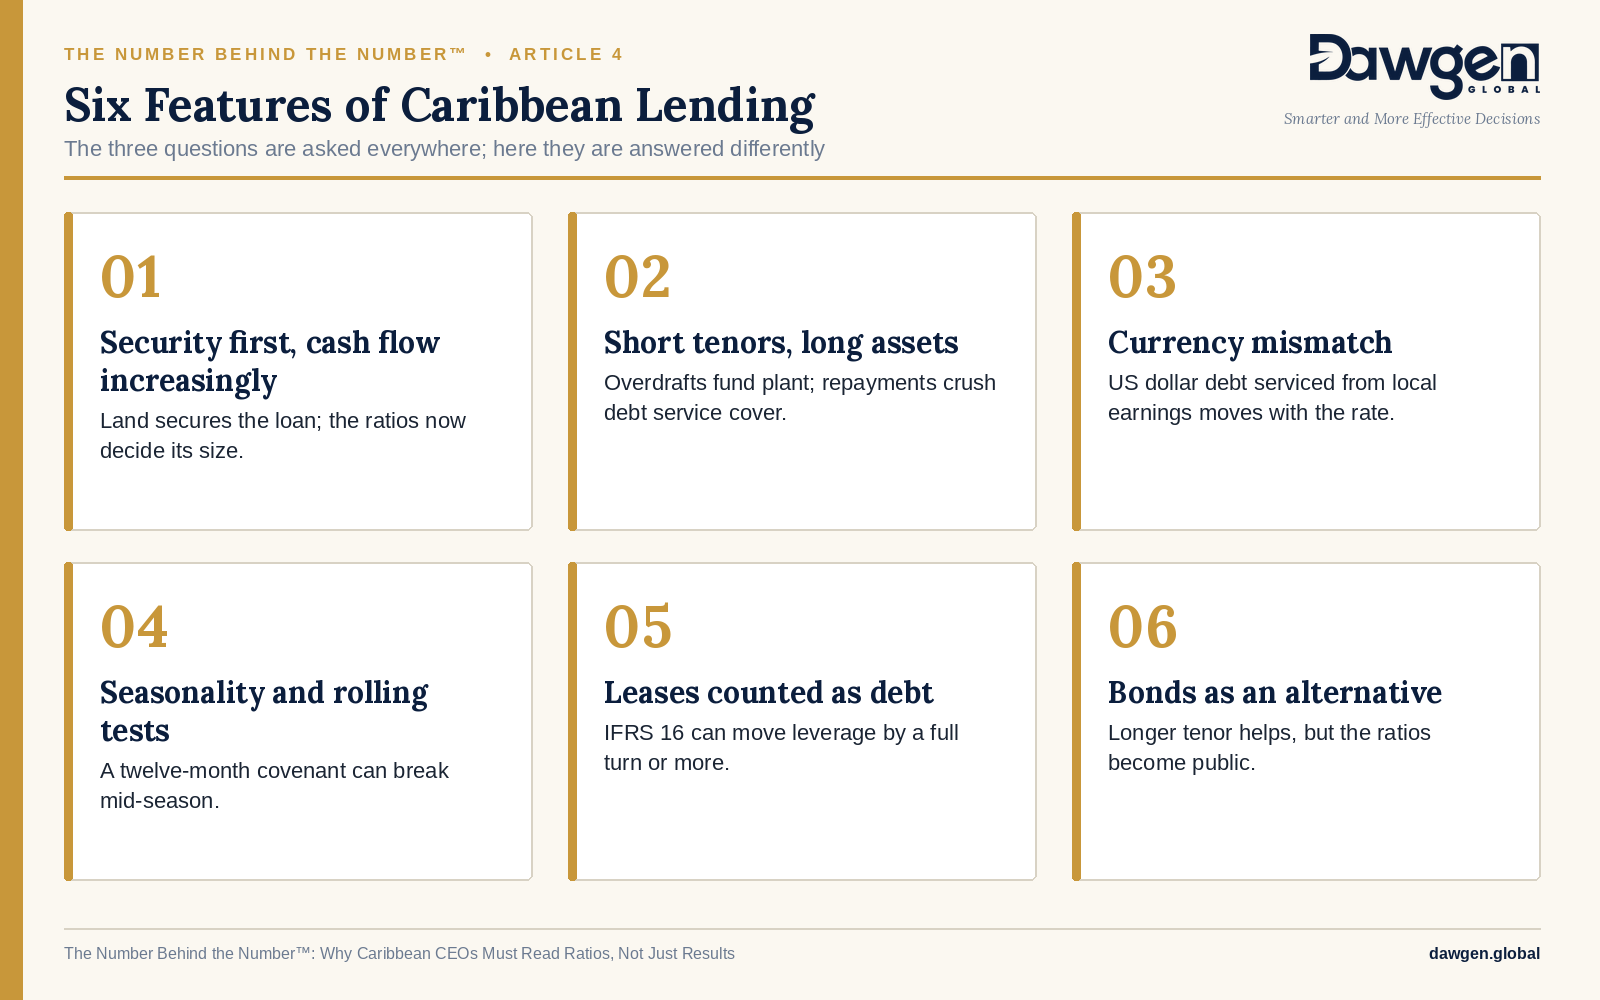
The three questions are asked everywhere. Six features of regional lending change how they are answered here.
Security first, cash flow increasingly. Regional banks have long lent against property and personal guarantees. That habit is changing. Ratio covenants now appear in more facility letters, and bond investors and regional development lenders test cash flow as a matter of course. A business that has always borrowed against its land may find that the land still secures the loan, but the ratios now decide its size.
Short tenors against long assets. Much regional borrowing is on overdraft or short term loans, even when it funds plant, buildings or fleets that last fifteen years or more. Short tenor inflates annual principal repayments, and so depresses DSCR. Many businesses that appear over-borrowed are in fact wrongly borrowed: the debt is the right size but on the wrong term.
Currency mismatch. Loans in US dollars serviced from local-currency earnings carry an exchange risk that no ratio on the face of the accounts shows. A depreciation of the local currency raises the debt and the interest in local terms while earnings stay where they were. Lenders increasingly stress-test for it, and a borrower should too.
Seasonality and rolling tests. Tourism, agriculture and retail follow sharp annual cycles. A covenant tested each quarter on the last twelve months of EBITDA can be breached mid-season even when the full year will be comfortable. Owners who look only at year-end accounts are the most likely to be surprised.
Leases counted as debt. Under International Financial Reporting Standard 16 (IFRS 16), most leases appear as liabilities. Whether a lender counts them in net debt, and whether it uses EBITDA before or after the lease effect, can change leverage by a full turn or more for a business with leased premises. Article 2 of this series explains the mechanics.
Capital markets as an alternative. Corporate bonds and junior market listings have opened longer-tenor funding to mid-sized regional businesses. Longer tenor lowers annual debt service and lifts DSCR, but bond investors apply the same three questions, often in writing, and publish the answers. The discipline does not go away; it becomes public.
SECTION 5
What it costs

Not knowing the lender’s arithmetic rarely costs a business its bank. It costs it in quieter ways. The figures are indicative, drawn from general practice rather than survey data.
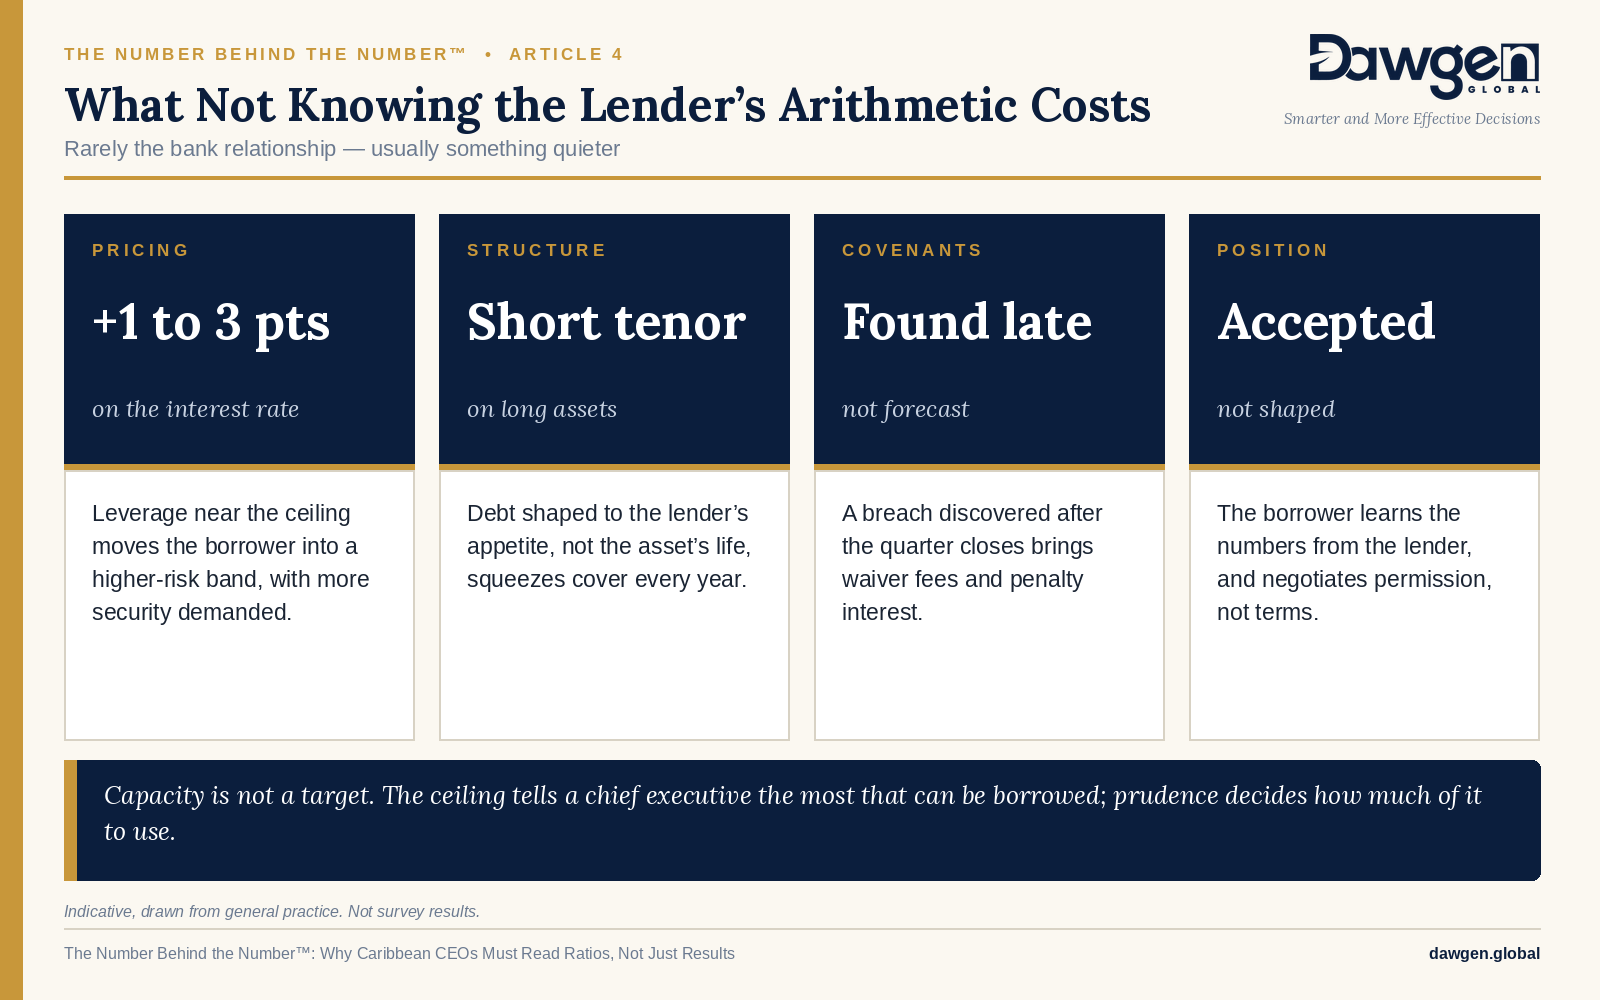
Planning suffers first. Investment plans built on borrowing the business cannot carry are delayed, scaled back or funded late, often after commitments to suppliers and staff have already been made.
The cost that matters most is negotiating position. A chief executive who arrives knowing leverage, interest cover and DSCR on the lender’s own definitions, and who has already worked out the binding ceiling, is negotiating structure: tenor, grace periods, repayment profile, security. One who arrives without them is negotiating whether to be lent to at all.
There is a second, less visible cost. A business that borrows up to the lender’s ceiling has used its headroom. The next bad season, currency move or storm then pushes it through a covenant.
SECTION 6
Reading it properly: the Borrowing Capacity Test

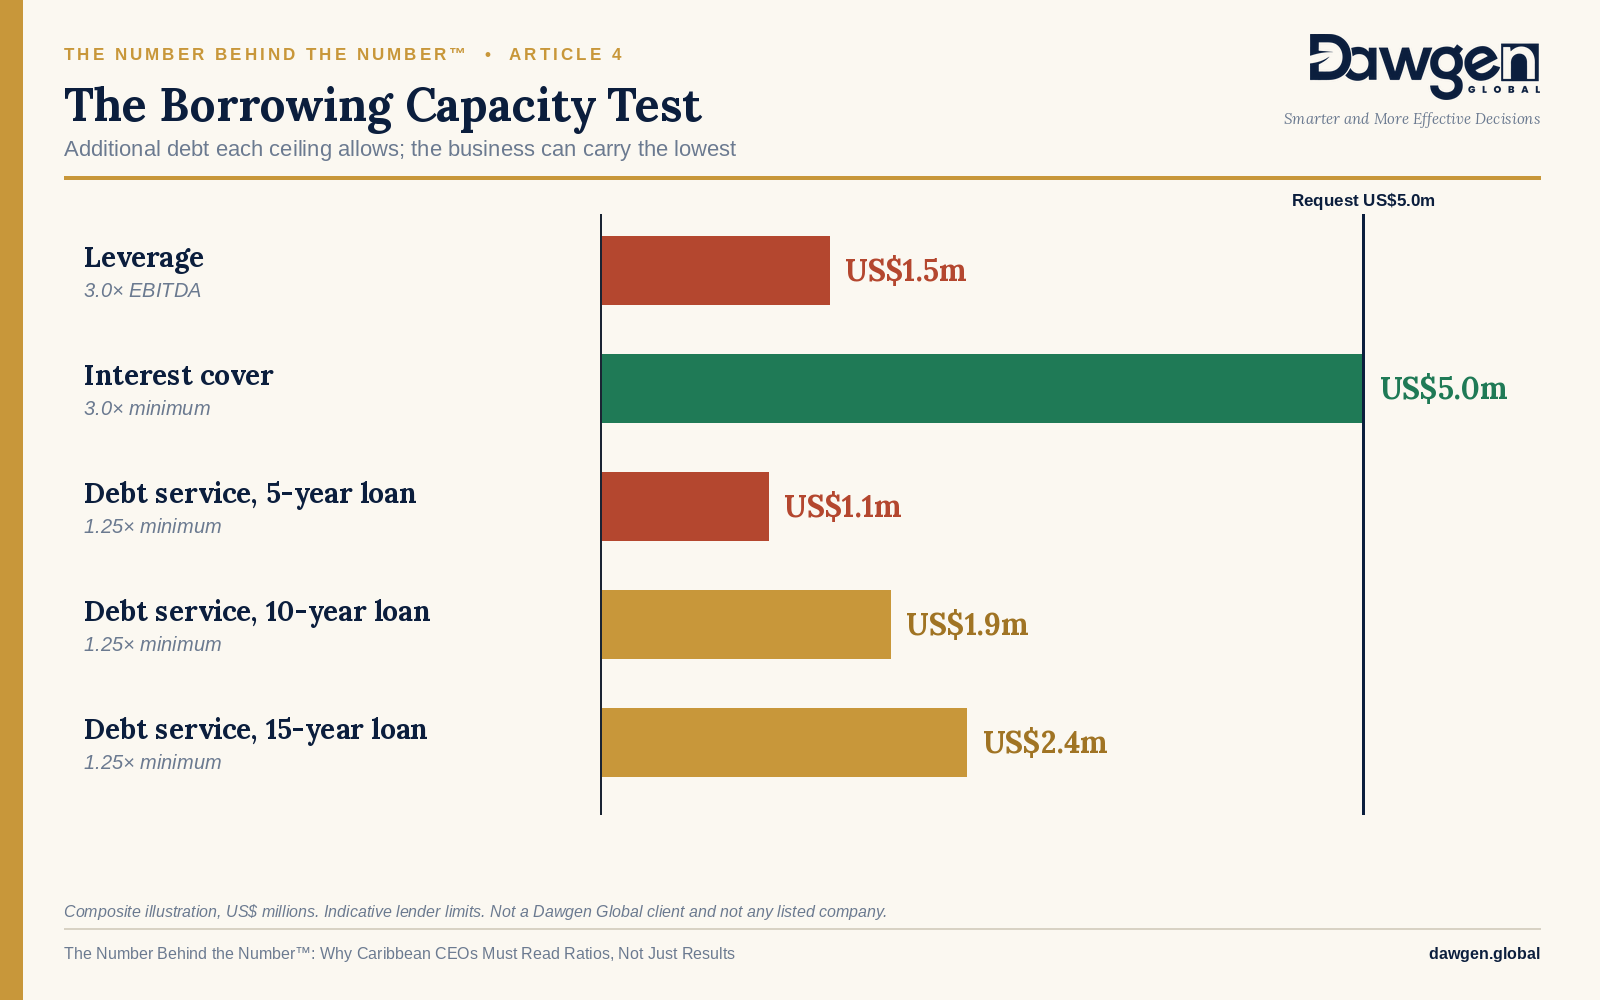
A chief executive can calculate what the business can borrow before asking, using three ceilings, one for each of the lender’s questions. Each ceiling is the additional debt that would take one ratio exactly to the lender’s limit. The business can carry the lowest of the three.
- The leverage ceiling. Maximum leverage multiplied by EBITDA, less existing net debt.
- The interest ceiling. Maximum interest (EBITDA divided by minimum cover), less existing interest, divided by the interest rate on new debt.
- The debt service ceiling. Maximum annual debt service (cash available for debt service divided by minimum DSCR), less existing debt service, divided by the annual payment per dollar borrowed on the proposed tenor.
The three ceilings need three limits. They vary by lender, sector and security; as an indicative guide for a mid-sized private business, many lenders look for leverage no higher than about 3.0 times EBITDA, interest cover of at least 3.0 times, and DSCR of at least 1.25 times on a cash basis. The only reliable limits are the ones written in your own facility letter.
The composite business, tested
The business in the opening story: EBITDA US$3.0 million, depreciation US$1.0 million, net debt US$7.5 million, interest US$0.6 million at 8 per cent, principal repayments US$0.6 million, tax US$0.35 million, maintenance spending US$0.8 million, cash available for debt service US$1.85 million.
| Ceiling | Calculation | Additional debt |
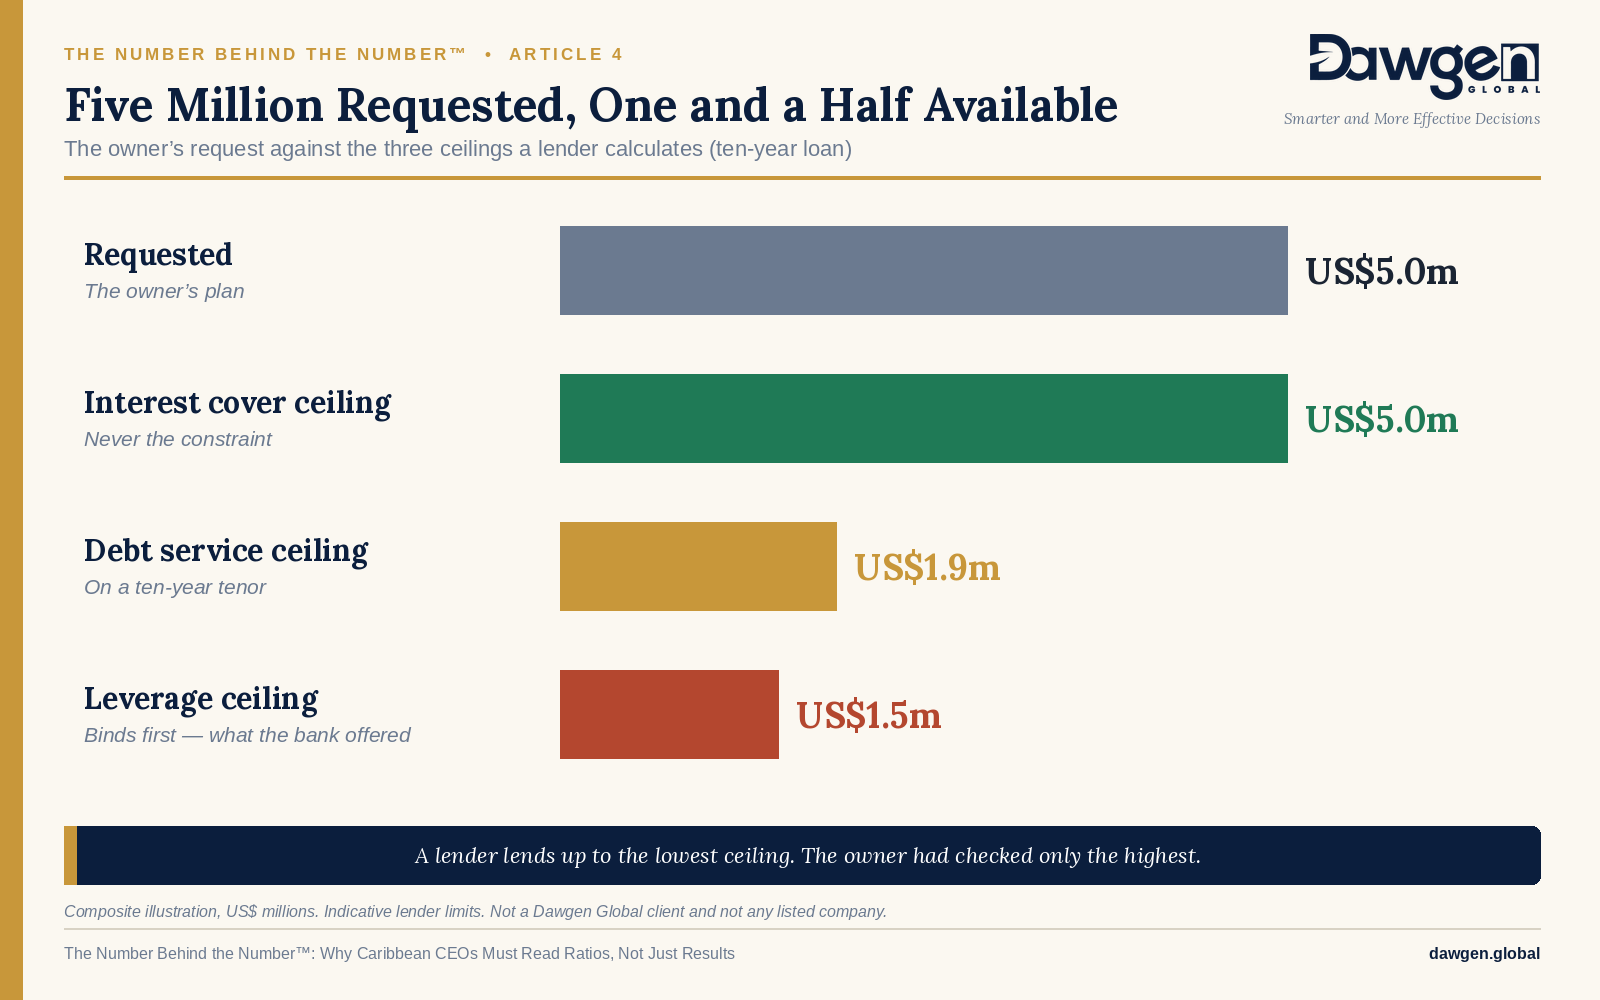
| Leverage (3.0× EBITDA) | 3.0 × 3.0 = 9.0; less 7.5 existing | US$1.5m |
| Interest cover (3.0×) | 3.0 ÷ 3.0 = 1.0 maximum interest; less 0.6; ÷ 8% | US$5.0m |
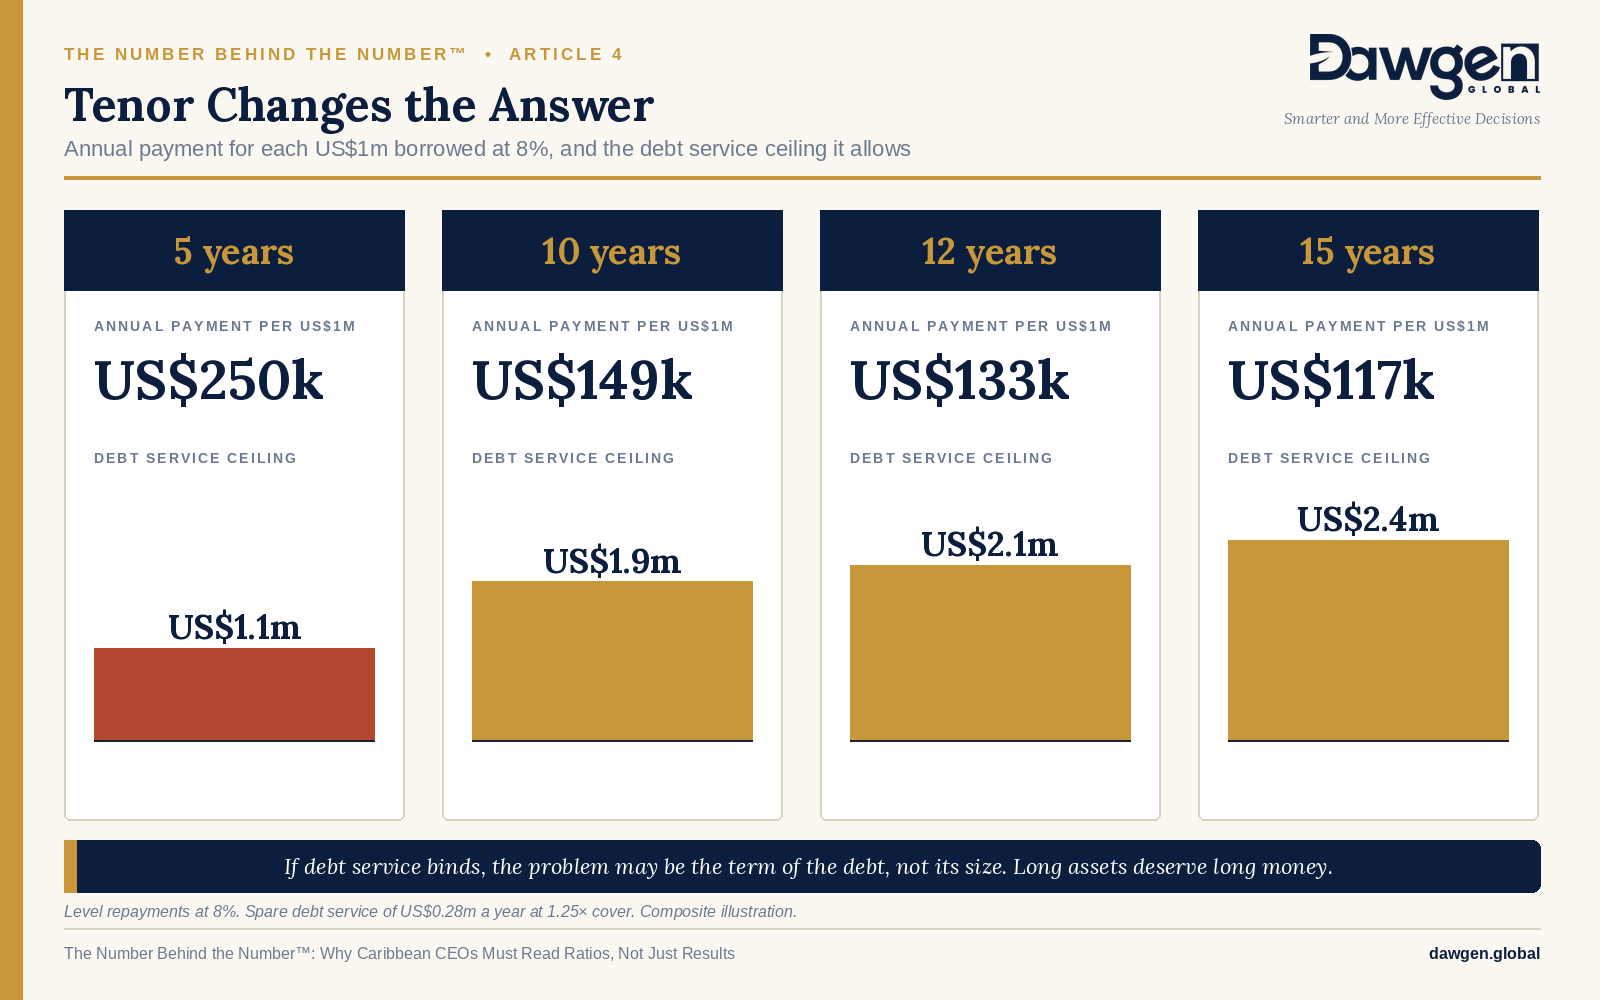
| Debt service, 5-year loan (1.25×) | 1.85 ÷ 1.25 = 1.48; less 1.2 = 0.28; ÷ 0.25 per US$1 | US$1.1m |
| Debt service, 10-year loan (1.25×) | 0.28 ÷ 0.15 per US$1 | US$1.9m |
| Debt service, 15-year loan (1.25×) | 0.28 ÷ 0.12 per US$1 | US$2.4m |
Composite illustration, US$ millions. Annual payment per dollar borrowed assumes level repayments at 8 per cent. Limits are indicative. Not a Dawgen Global client and not any listed company.
Three lessons sit in that test.
- Interest cover was never the constraint. It allowed US$5.0 million, exactly what the owner asked for. An owner who checked only interest cover would have been confident, and wrong.
- On a five-year loan, debt service binds first, at about US$1.1 million. The short tenor, not the size of the debt, was the problem.
- On a ten-year loan, leverage binds, at US$1.5 million. That is the figure the bank offered, on a longer tenor, and it is no coincidence. The bank had run this test before the first meeting.
The request, read through both measures
| Ratio | Today | With US$5.0m over 5 years | Indicative limit |
| Net debt ÷ EBITDA | 2.5× | 4.2× | 3.0× |
| Net debt ÷ EBITA | 3.75× | 6.25× | — |
| Interest cover, EBITDA | 5.0× | 3.0× | 3.0× |
| Interest cover, EBITA | 3.3× | 2.0× | — |
| DSCR, simple (EBITDA ÷ service) | 2.5× | 1.15× | — |
| DSCR, cash available for debt service | 1.54× | 0.71× | 1.25× |
On EBITDA, the request looks stretched but arguable. On EBITA and on cash, it is out of reach. The new line’s earnings do not help yet: lenders count earnings the business has, not earnings it plans to have, which is the realisation test from Article 3 in a new setting.
Closing the gap with structure, not hope
The gap between US$5.0 million requested and US$1.5 million available is not the banker’s caution. It is the arithmetic, and the arithmetic can be changed. One structure that works on the same numbers:
- The owner contributes US$1.5 million of equity, so new borrowing falls to US$3.5 million.
- Existing and new debt are combined into a single US$11.0 million facility or bond on a twelve-year tenor, matching the life of the plant. Annual debt service falls to about US$1.46 million, and DSCR on today’s cash is about 1.27 times.
- Leverage is allowed to step down. At 3.7 times today, it exceeds a 3.0 times limit. Once the new line adds US$0.8 million of EBITDA, leverage falls to about 2.9 times and DSCR rises to about 1.7 times. A covenant that starts at 4.0 times and steps down to 3.0 times over three years reflects that path, and lenders and bond investors agree to such profiles when the plan is evidenced.
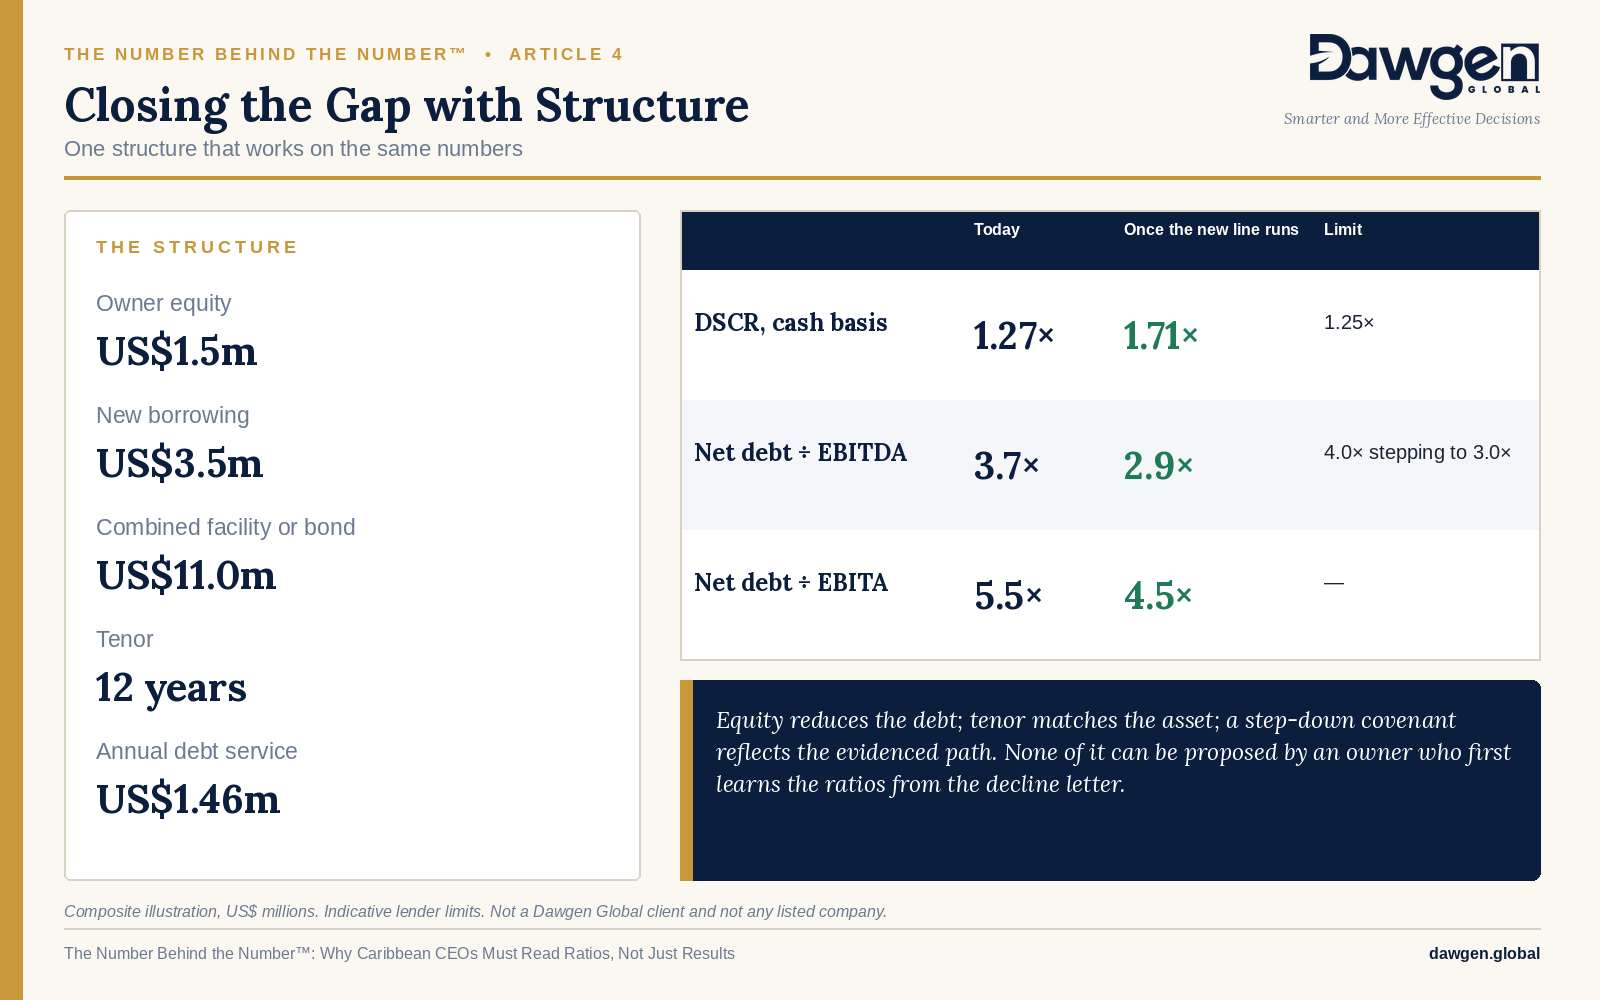
On EBITA the same structure reads about 5.5 times today and about 4.5 times once the line is running, allowing for its extra depreciation. That reading is the reminder that the business must keep replacing its existing plant while it pays for the new one.
None of this could be negotiated by an owner who first learned the ratios from the decline letter. All of it can be proposed by one who calculated them first.
SECTION 7
Where to start
Each of these steps uses information the business already holds, and each is worth doing before the next conversation with a lender.
- Calculate the three ratios on both measures. Leverage, interest cover and DSCR, on EBITDA and on EBITA, and DSCR on cash available for debt service as well as the simple basis.
- Find the definitions in your facility letter. Which EBITDA, which debt, whether leases count, whether cash is netted, and when each test is measured. Calculate the covenants exactly as written.
- Run the Borrowing Capacity Test. Work out the three ceilings and find the one that binds. That is your real borrowing capacity, and it is often not the one you expected.
- Match tenor to the life of the asset. If debt service is the binding ceiling, the problem may be the term of the debt, not its size. Long assets deserve long money.
- Forecast covenants, not just profit. Test each ratio on a rolling twelve months through the coming season and under a currency shock, so a breach is foreseen rather than discovered.
- Keep headroom. Decide in advance how much of the ceiling the business will use, and leave the rest for the season, the storm or the currency move that has not happened yet.
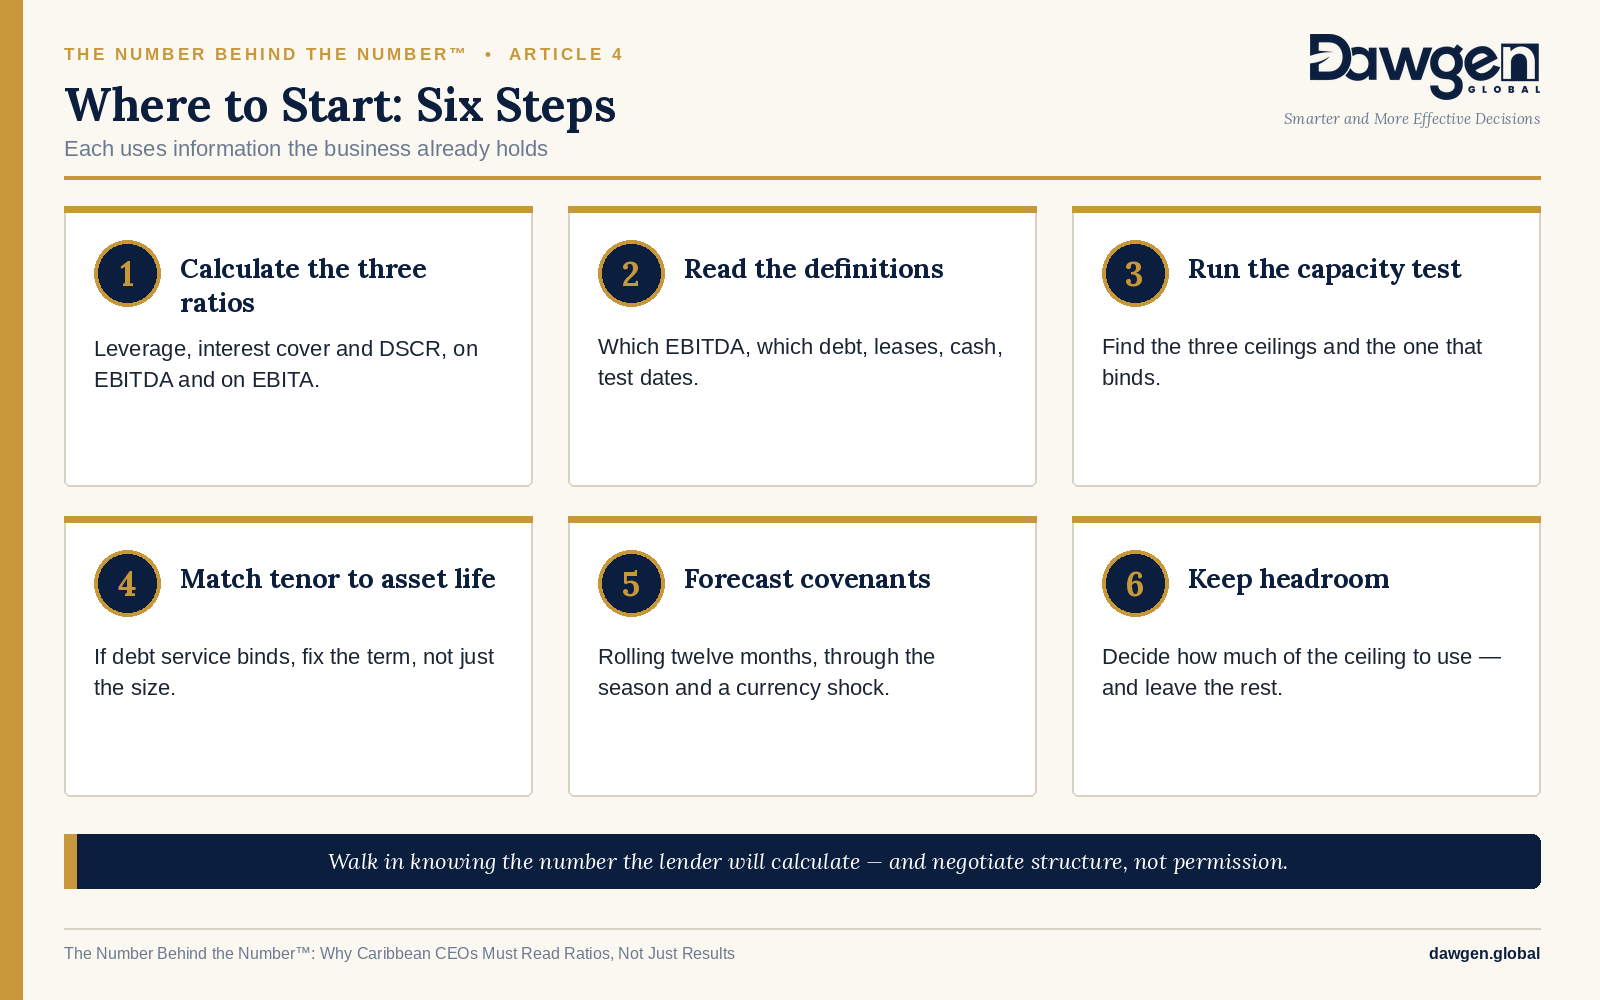
The aim is not to borrow the maximum. It is to walk into every credit conversation already knowing the number the lender will calculate, so that the discussion is about structure and terms, not about whether.

What comes next in the series
Article 5, EBITDA Is Not Cash, opens the Turnover lens: how much of EBITDA becomes cash, what working capital absorbs on the way, and why the cash available for debt service is so often smaller than owners expect. Later articles take each lens in turn, and the series closes with the CEO’s One-Page Ratio Dashboard.
| HOW DAWGEN GLOBAL HELPS
Dawgen Global works with chief executives, boards and owners across more than fifteen Caribbean territories to put these numbers to work. ■ The Dawgen E·B·I·T·A Lens™ Ratio Health Check — a fixed-fee review that scores the business on all five lenses, including a Borrowing Capacity Test on your lender’s own definitions. ■ Debt advisory and capital structuring — sizing, structuring and negotiating facilities, refinancings and tenor extensions, through our Corporate Finance and Business Advisory practice. ■ Corporate bond readiness — preparing mid-sized businesses for long-tenor bond financing under the BEDROCK™ framework. ■ Covenant monitoring and forecasting — rolling twelve-month covenant tests and stress scenarios, through our Virtual CFO and Accounting BPO division. ■ Restructuring and recovery — where headroom has already gone, through our Corporate Recovery practice. To see how your business reads through the E·B·I·T·A Lens™, or to request a Ratio Health Check or a Borrowing Capacity Test, contact Dawgen Global. [email protected] | dawgen.global | (876) 926-5210 |
Download a copy of the article here: Article4_Your_Banker_Already_Knows
The examples in this series are composites drawn from patterns observed across the region. They do not describe any client, lender or listed company. Figures and limits described as indicative are illustrative, not survey results or lending policy.
About Dawgen Global
Dawgen Global is an independent, integrated multidisciplinary professional services firm headquartered at 47 Trinidad Terrace, New Kingston, Jamaica, serving more than 15 territories across the Caribbean. Founded and led by Dr. Dawkins Brown, Executive Chairman, the firm is independent and not affiliated with any international network. It delivers a full suite of professional services under one roof: audit and assurance; tax advisory; IT and digital transformation; risk management; cybersecurity; actuarial and insurance regulatory advisory; HR advisory; mergers and acquisitions; corporate recovery; business advisory and strategy; accounting BPO and virtual CFO services; and legal process outsourcing.
The proposition is simple: big-firm capability without the big-firm price. Dawgen Global’s integrated approach is built for the specific complexities and opportunities of the Caribbean market, helping organizations make sharper, better-informed decisions that drive measurable progress.
To explore a partnership, reach out:
- Website: dawgen.global
- Email: [email protected]
- WhatsApp (Global): +1 555-795-9071
- Caribbean offices: +1 876-665-5926 | +1 876-929-3670 | +1 876-926-5210