Executive Summary
Great circular ideas die when the money doesn’t add up—or when capital is released without guardrails. Financing is where circular ambition becomes enterprise performance. This article lays out Dawgen Global’s playbook for pricing, risk management, and investment structuring across the LoopWorks™ model—LoopSight™ (discovery), BetForge™ (funded bets), and ScaleGrid™ (industrialized operations). We cover unit‑level economics, hurdle rates adapted to circular cashflows, stage‑gated capex, working capital for take‑back and secondary channels, insurance and warranty reserves, green finance options, EPR credits, and portfolio governance. We also provide sensitivity templates, risk registers, and a 90‑day financing roadmap so CFOs can fund with confidence and stop zombie pilots early.
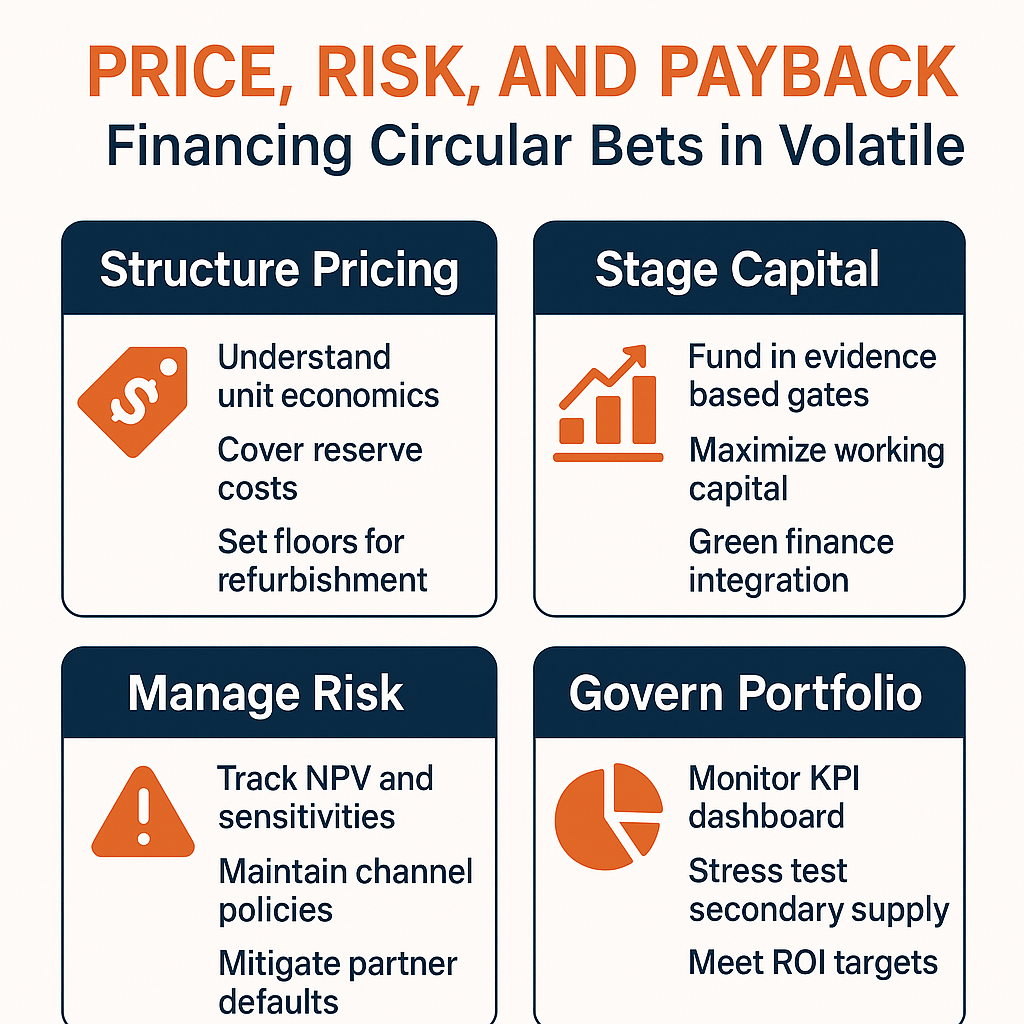
Thesis: Price with transparency, fund in stages, measure with discipline. Circular economics reward those who turn variability into design, not hope.
Why Financing Circular Bets Is Different
- Variable supply and grade mix. Returns and recovered materials arrive stochastically, changing yields and margins.
- Two‑sided channels. You buy back cores/returns and sell refurbished/remanufactured output; cash conversion cycles (CCC) behave differently from forward‑only models.
- Warranty tail risk. Certified pre‑owned and remanufactured offers carry actuarial reserves and brand risk.
- New value drivers. Virgin material displacement, EPR relief, carbon intensity changes, and brand lift don’t appear in traditional product P&Ls without design.
- Capex vs. opex trade‑offs. Modular refurb cells, tooling, data plumbing, and reverse‑logistics hubs need staged capital under uncertainty.
Treating circular initiatives like standard product launches ignores these realities—leading to under‑ or over‑funding. Dawgen’s financing approach is purpose‑built for loops.
Unit Economics: The “Unit of One” View
Every bet in LoopWorks™ starts with a unit‑of‑one model. For a single returned unit (or a defined lot):
Cash Outflows
- Capture: incentive/deposit, collection, packaging kit, inbound logistics.
- Intake & Grading: labor minutes, jigs/tools amortization, EHS handling, photo/scan costs.
- Refurb/Reman Processing: labor, parts replacement, consumables, energy, rework and scrap loss.
- Quality & Warranty: test time, QA labor, failure screening; actuarial reserve per unit.
- Outbound Channels: marketplace fees, channel margin, outbound logistics, reverse tote pool.
Cash Inflows
- Resale Price: certified pre‑owned/reman price net of discounts.
- By‑Product Value: parts harvesting, scrap material at purity bands.
- Credits/Relief (where applicable): EPR credits, take‑back subsidies, carbon instruments.
Working Capital Effects
- Days-in-process from capture → intake → refurb → resale.
- Inventory age distribution by grade; deposit/credit flows; consignment timing.
Decision Metrics
- Contribution margin per unit; payback months; sensitivity to return rate, grade mix, first‑pass yield (FPY), resale price elasticity, and logistics cost per unit.
We generate P10/P50/P90 scenarios with confidence bands. No bet advances past BetForge™ without explicit ranges and kill rules tied to these variables.
Pricing Logic: Value, Floors, and Cannibalization
Pricing refurbished/remanufactured output is a balancing act:
- Value‑based anchor. Price against the customer’s next‑best alternative (new, competitor, rental). Use performance guarantees and refreshed warranties to support the anchor.
- Quality bands. Create A/B/C graded SKUs with clear cosmetic and performance standards. Each band has its price floor to avoid cannibalizing new sales.
- Dynamic pricing. Adjust by inventory age, grade mix, seasonality, and channel elasticity. Older stock moves via targeted promotions, not across‑the‑board cuts.
- Bundles and PaaS. Increase LTV with service bundles (maintenance, upgrades, accessories) or subscriptions that monetize uptime rather than one‑off sales.
- Channel policy. Protect reseller relationships with differentiated SKUs, MAP (minimum advertised price) rules where legal, and quota credit for attach/retention.
Tip: Pair pricing floors with channel‑specific playbooks to prevent gray‑market leakage and protect brand positioning.
Risk: Identify, Quantify, Insure
Top Financial Risks and Tools
- Supply Shortfall (capture rate/grade mix). Mitigate via deposits/buy‑back contracts, multi‑sourcing of cores, and micro‑triage at origin. Model P10 scenarios; add surge pricing for returns when needed.
- Quality Variance (FPY drop, rework spikes). Set FPY quality gates; invest in intake diagnostics; use golden‑sample libraries; include rework caps in charters.
- Warranty Tail Risk. Build actuarial tables from field failures; set reserve factors by SKU and grade; buy stop‑loss insurance for catastrophic clusters.
- Channel Cannibalization. Track sell‑through and new‑build substitution; enforce pricing floors; compensate sales for attach/retention.
- Compliance/Liability. Maintain chain of custody, safety certifications, and EPR reporting; insure product liability where necessary.
- Partner Default. Use performance bonds, escrow for prepayments, SLAs with penalties, and dual‑source critical services.
Risk Register Template (excerpt)
- Risk; trigger/indicator; financial exposure band; mitigation; owner; review cadence.
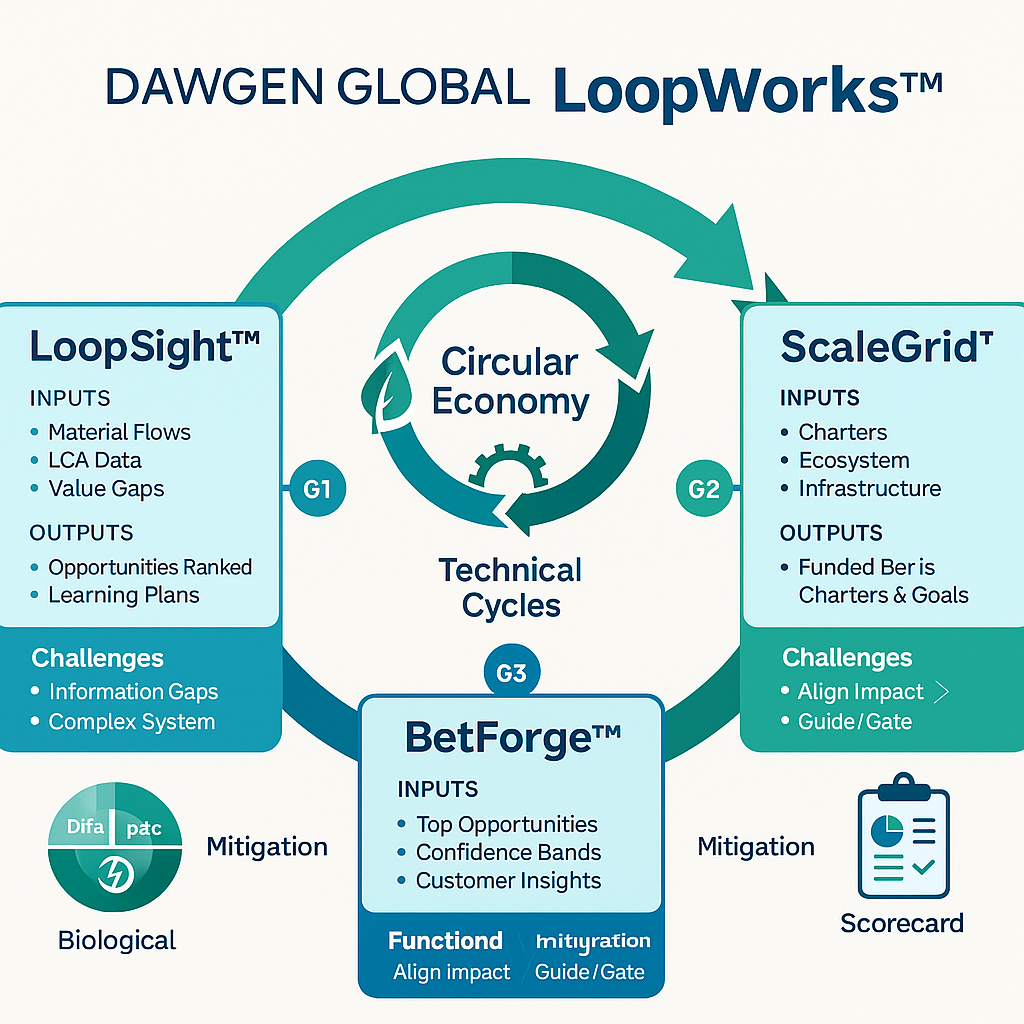
Capital Structure: Stage‑Gated Funding
We release capital in tranches aligned to evidence, not effort.
- G1: Portfolio Commit (LoopSight™) – Seed budgets fund learning plans; no capex beyond minimal test fixtures.
- G2: Scale Go/No‑Go (BetForge™) – Pilot capex for modular refurb cells, intake stations, and data plumbing. Tranche contingent on FPY, capture rate, and unit margin clearing hurdles.
- G3: Enterprise Embed (ScaleGrid™) – Network build (hubs, reverse totes), automation, and IT/OT integration. Release tied to ≥4 quarters of sustained economics and process capability.
Hurdle Rates & Payback
- Apply hurdle rates that reflect risk reduction across gates. Early stages may accept longer payback windows; by G3, payback and margin must meet enterprise thresholds.
Capex vs. Opex Strategy
- Lease early, buy later. Use mobile/modular refurb cells and short‑term leases until volume stabilizes. Convert to owned capex once utilization is proven. Treat data/platform costs as opex where flexibility is valuable.
Working Capital: The Hidden Engine
Circular models can tie up cash if unmanaged. We design CCC explicitly:
- Deposits & Credits. Use deposits on PaaS and buy‑back credits to pull returns faster while reducing cash risk. Time refunds to confirmed grade.
- Cycle Time Compression. Target dock‑to‑grade hours; pre‑book triage capacity; use carbon‑aware yet time‑efficient routing.
- Inventory Policies. Age‑based pricing, disposition triggers for slow‑moving grades, and parts harvesting thresholds.
- Receivables/Payables. Align reseller terms with inventory age; use supply‑chain finance for secondary channels where feasible.
Green Finance, Credits, and Incentives
Depending on jurisdiction and sector, financing options can include:
- Green loans/bonds linked to KPIs such as virgin material intensity or landfill diversion.
- Sustainability‑linked loans (SLLs) with margin step‑ups/downs based on circular KPIs.
- EPR incentives/credits reducing net disposal costs and funding take‑back logistics.
- Carbon market instruments (where legitimate) tied to verified intensity reductions.
- Equipment financing for refurb/reman cells and diagnostics equipment.
Guardrails: Only book benefits with verifiable M&V. Avoid over‑reliance on credits to make economics appear viable.
The Circular Finance Dashboard (for Boards & CFOs)
Financial & Operating
- Circular revenue % and growth; unit contribution margin by grade/SKU.
- Payback (months) and NPV bands by bet; capex intensity.
- CCC and inventory age distribution for refurbished stock.
Materials & Impact
- Virgin material intensity (kg per revenue) and displacement (%).
- Recovery yield and landfill diversion.
- Carbon intensity per functional unit.
Risk & Assurance
- Warranty reserve adequacy; claims trend vs. actuarial forecast.
- Compliance/audit pass rate; chain‑of‑custody coverage.
- Partner SLA adherence; incident rate; insurance claims activity.
Capital Allocation
- Portfolio heatmap: performance vs. hurdle; reallocation decisions quarterly.
Sensitivity & Scenario Design
We standardize sensitivity sets so executives compare bets apples‑to‑apples:
- Return Capture Rate ±10–25%
- Grade Mix (A/B/C/Scrap) shifts ±10 pp
- FPY ±8–15%
- Resale Price Elasticity ±5–12%
- Inbound/Outbound Logistics Cost ±10–20%
- Warranty Reserve Factor ±2–5 pp
Combine into P10/P50/P90 scenarios. Require that the P50 clears hurdles and P10 is survivable or mitigated.
Example: Financing a Remanufactured Equipment Line
A regional equipment maker wants to remanufacture returned units and sell certified pre‑owned.
BetForge™ Unit Economics (P50)
- Capture incentive + inbound logistics: $18/unit.
- Intake + grading: $7.
- Refurb labor + parts: $62.
- QA + warranty reserve: $11.
- Channel fee + outbound: $29.
- Total Cost: $127.
- Resale price: $169.
- By‑product value: $8.
- Contribution: $50 (29.6%).
- Payback: 14 months given modular cell lease costs.
Sensitivity: At P10 grade mix, contribution falls to $29 (17%)—still above threshold due to price floors and parts harvesting triggers.
Capital Plan
- Lease two refurb cells for 6 months; convert to purchase after utilization ≥85% for 90 days.
- Finance intake diagnostics via equipment finance; treat IT/OT as opex in year 1.
- Green loan with margin step‑down tied to verified recovery yield ≥70%.
Outcome
- After 16 weeks, FPY hits 86%; capture reaches 58% via deposit‑back. G2 cleared; G3 build funds three more cells and a regional hub.
Policy and Accounting Considerations (Executive Snapshot)
- Revenue recognition: align refurbished sales/warranties with IFRS/GAAP; separate service components in PaaS models.
- Inventory: define grading as part of cost capitalization policy; establish valuation for A/B/C/Scrap with obsolescence rules.
- Provisions: warranty reserves based on actuarial analysis; environmental provisions for disposal where necessary.
- Credits & Incentives: present EPR/carbon credits net of related expenses with clear disclosure; verify with third parties.
(We work with client accounting teams to codify these policies in accounting manuals and audit trails.)
Governance: Making Capital Discipline Stick
- Circular PMO runs monthly Value Councils to review KPI trends and capital allocation.
- Gate packs require decision‑grade evidence, not anecdotes.
- Post‑investment reviews 6 and 12 months after G3 funding to confirm economics and assumptions; reallocate capital as needed.
90‑Day Financing Roadmap
Weeks 1–2: Baseline & Policy
- Align accounting policies, reserve methods, and hurdle rates tailored to circular bets.
Weeks 3–5: Unit Economics & Sensitivities
- Build unit‑of‑one models for Top‑5 bets; run P10/P50/P90 with confidence bands.
Weeks 6–7: Capital Plan
- Define stage‑gated tranches, lease vs. buy, and green finance options.
Weeks 8–10: Working Capital & Pricing
- Set deposit/credit logic, age‑based pricing, and floor policies; finalize SLA impacts to CCC.
Weeks 11–13: Governance & Gate Prep
- Assemble G2/G3 pack templates; stand up dashboard; schedule Value Council cadence.
By Day 90, leadership knows what to fund, how much, and under what conditions—and has kill rules to protect capital.
FAQs for CFOs and Boards
Q1: Do we need green finance to make the math work?
No. Green finance can enhance returns but should not be the core case. The base model must clear hurdles on unit economics alone.
Q2: How do we keep pilots from lingering?
Write exit criteria into Bet Charters; tie tranche releases to FPY, capture rate, and margin; run monthly Value Councils.
Q3: What if returns dry up?
Use dynamic incentives, B2B contracts with take‑back clauses, and by‑product marketplaces. Maintain multi‑sourcing and predictive analytics on failure/warranty cohorts.
Q4: How do we explain risk to investors?
Report with confidence bands, scenario cases, and evidence from M&V protocols. Show governance: gates, reserves, and audits.
Fund for Evidence, Not Optimism
Circular economy leaders succeed because they finance differently. They price with discipline, understand where variance lives, and release capital only when evidence clears gates. With LoopWorks™, Dawgen Global helps clients design for uncertainty—so refurbished, remanufactured, and recycled value streams produce reliable margins and defendable growth.
Build a Finance Engine for Circular Growth
Ready to structure pricing, risk, and capital so your circular bets deliver?
Request a proposal today:
Email: [email protected]
WhatsApp: +1 555 795 9071
Dawgen Global | LoopWorks™ — Smarter and More Effective Decisions, by design.
About Dawgen Global
“Embrace BIG FIRM capabilities without the big firm price at Dawgen Global, your committed partner in carving a pathway to continual progress in the vibrant Caribbean region. Our integrated, multidisciplinary approach is finely tuned to address the unique intricacies and lucrative prospects that the region has to offer. Offering a rich array of services, including audit, accounting, tax, IT, HR, risk management, and more, we facilitate smarter and more effective decisions that set the stage for unprecedented triumphs. Let’s collaborate and craft a future where every decision is a steppingstone to greater success. Reach out to explore a partnership that promises not just growth but a future beaming with opportunities and achievements.
✉️ Email: [email protected] 🌐 Visit: Dawgen Global Website
📞 📱 WhatsApp Global Number : +1 555-795-9071
📞 Caribbean Office: +1876-6655926 / 876-9293670/876-9265210 📲 WhatsApp Global: +1 5557959071
📞 USA Office: 855-354-2447
Join hands with Dawgen Global. Together, let’s venture into a future brimming with opportunities and achievements

