

Barbados publishes a document listing every established post in its central government. We extracted it: 10,989 posts across 1,110 distinct job titles. One title — graduate teacher — accounts for a tenth of the entire establishment. Twenty titles account for forty-four per cent of it. And 493 titles, forty-four per cent of all of them, describe exactly one person.
The document nobody reads
Nine articles in this series have been about pay. This one is about headcount, and the two are usually discussed as though they were the same subject. They are not. A salary scale tells you what a grade pays. It cannot tell you how many people are on it, and the wage bill is the product of the two.
Barbados is the only jurisdiction in our study that publishes an establishment schedule — a listing of every approved post with its salary scale code and the provision made for it. It runs to 414 pages. As a source for pay research it is valuable but incomplete, as the sixth article explained, because it gives the scale code without the scale range.
As a source for something else entirely, it is extraordinary. It is a full description of how a Caribbean state is staffed, and so far as we can establish nobody has analysed it that way.
| A CORRECTION WE MADE BEFORE PUBLISHING
Our first pass at this data appeared to show the establishment falling by 14.1 per cent between 2025-26 and 2026-27. It is not. Four hundred and sixty rows failed to yield a second-year figure to our parser, accounting for 1,454 posts — the whole of the apparent reduction. We report only the 2025-26 column, which parses completely, and make no claim about year-on-year change. A finding that dramatic should always be tested against the extraction before it is tested against the world. |
What a public service is made of
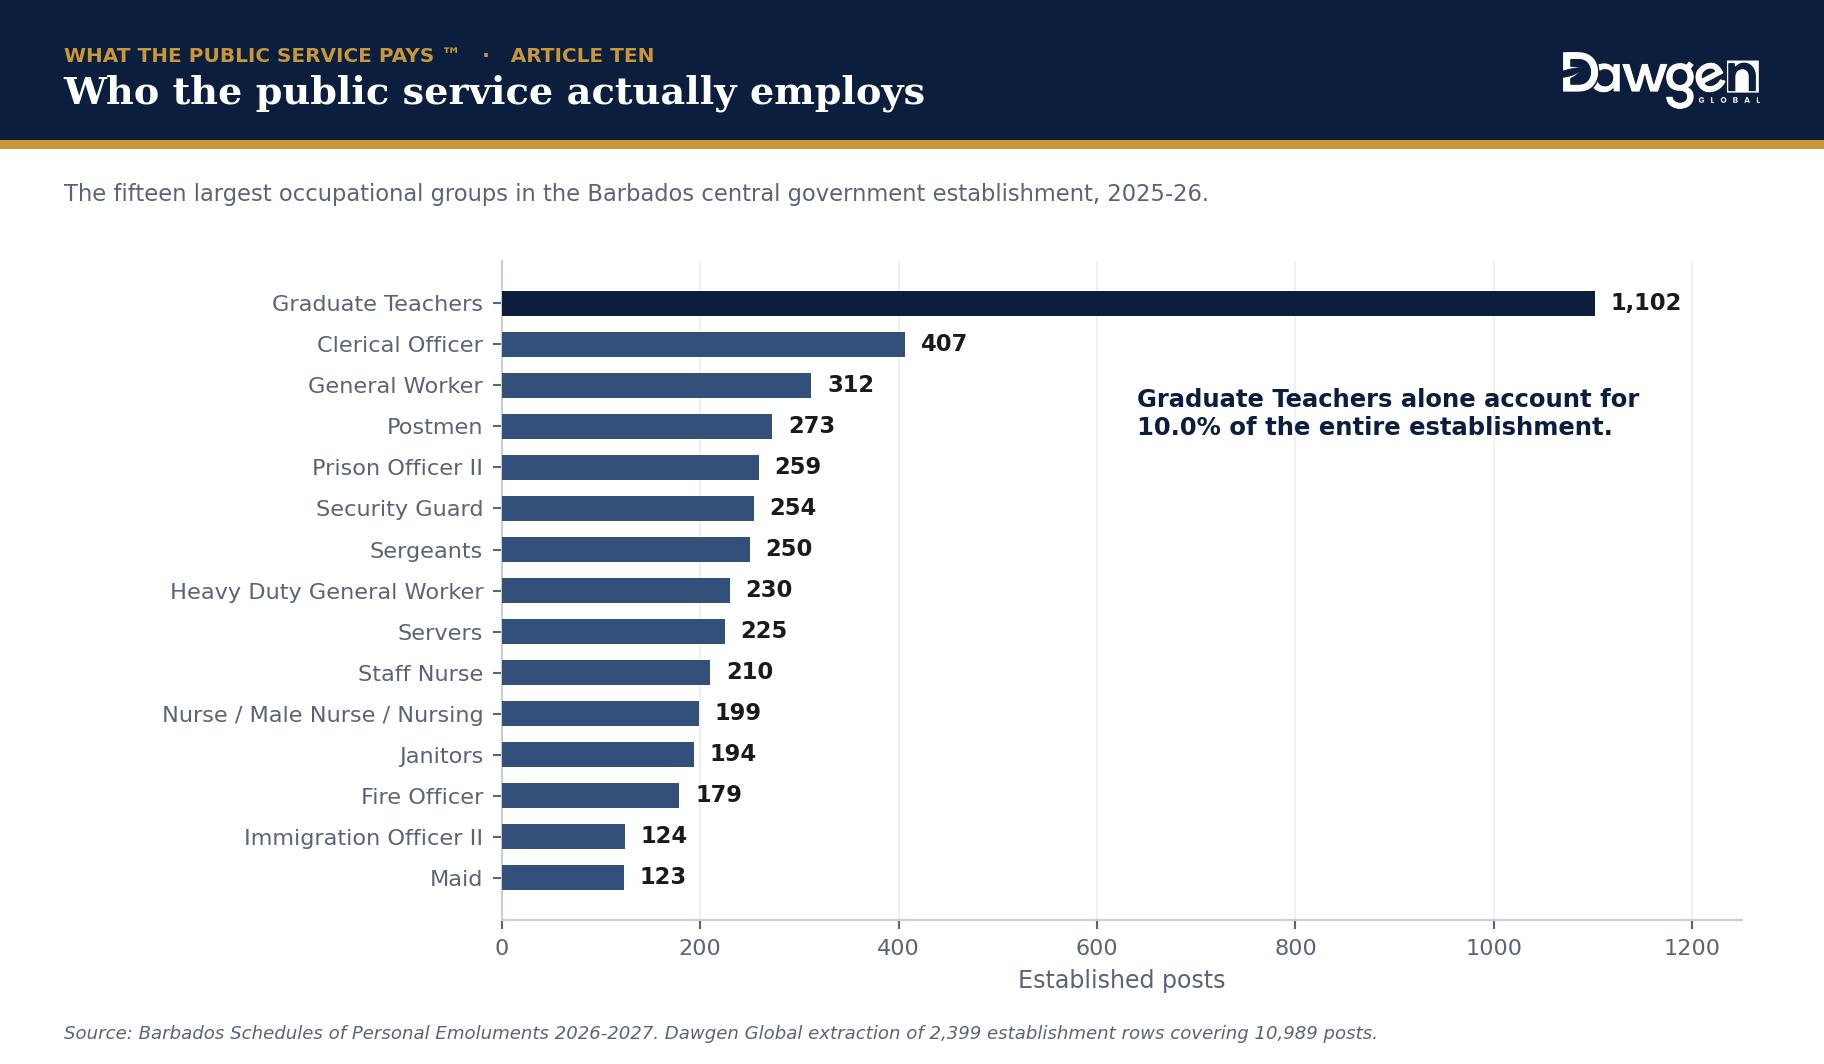
Exhibit 1. The fifteen largest occupational groups in the Barbados central government establishment.
Graduate teachers are the largest single group by a wide margin: 1,102 posts, ten per cent of the entire establishment. Clerical officers follow at 407. Then general workers, postmen, prison officers, security guards, police sergeants, heavy duty general workers, servers, staff nurses, nurses, janitors and fire officers.
Read that list again. With the exception of clerical officers, every one of the largest groups is a front-line service role: teaching, mail, custody, security, policing, catering, nursing, cleaning, fire. The administrative and professional grades that dominate discussion of public sector pay do not appear until well down the distribution.
This is not a Barbadian peculiarity. It is what a state does. But it is consistently invisible in pay debate, which concentrates on the grades that generate controversy rather than the grades that generate cost.
A note on what is missing from that list
Two absences from the fifteen largest groups are as informative as the entries.
There is no accountant, no engineer, no legal officer and no economist in the top fifteen. The professional grades that dominate benchmarking exercises — and that private employers compete hardest for — exist in numbers far too small to appear. A public service employs a great many people and comparatively few of the specific professionals a private firm is bidding against it for.
That has a counter-intuitive implication for an employer. The public service is your largest competitor for professional staff in most Caribbean economies, but those professionals are a small minority of its own workforce. A settlement driven by the cost of eleven hundred teachers may leave professional rates untouched for years — which is precisely the condition in which a private employer can recruit well, and precisely the condition most miss because they are watching the headline settlement rather than the grades they care about.
How concentrated it is
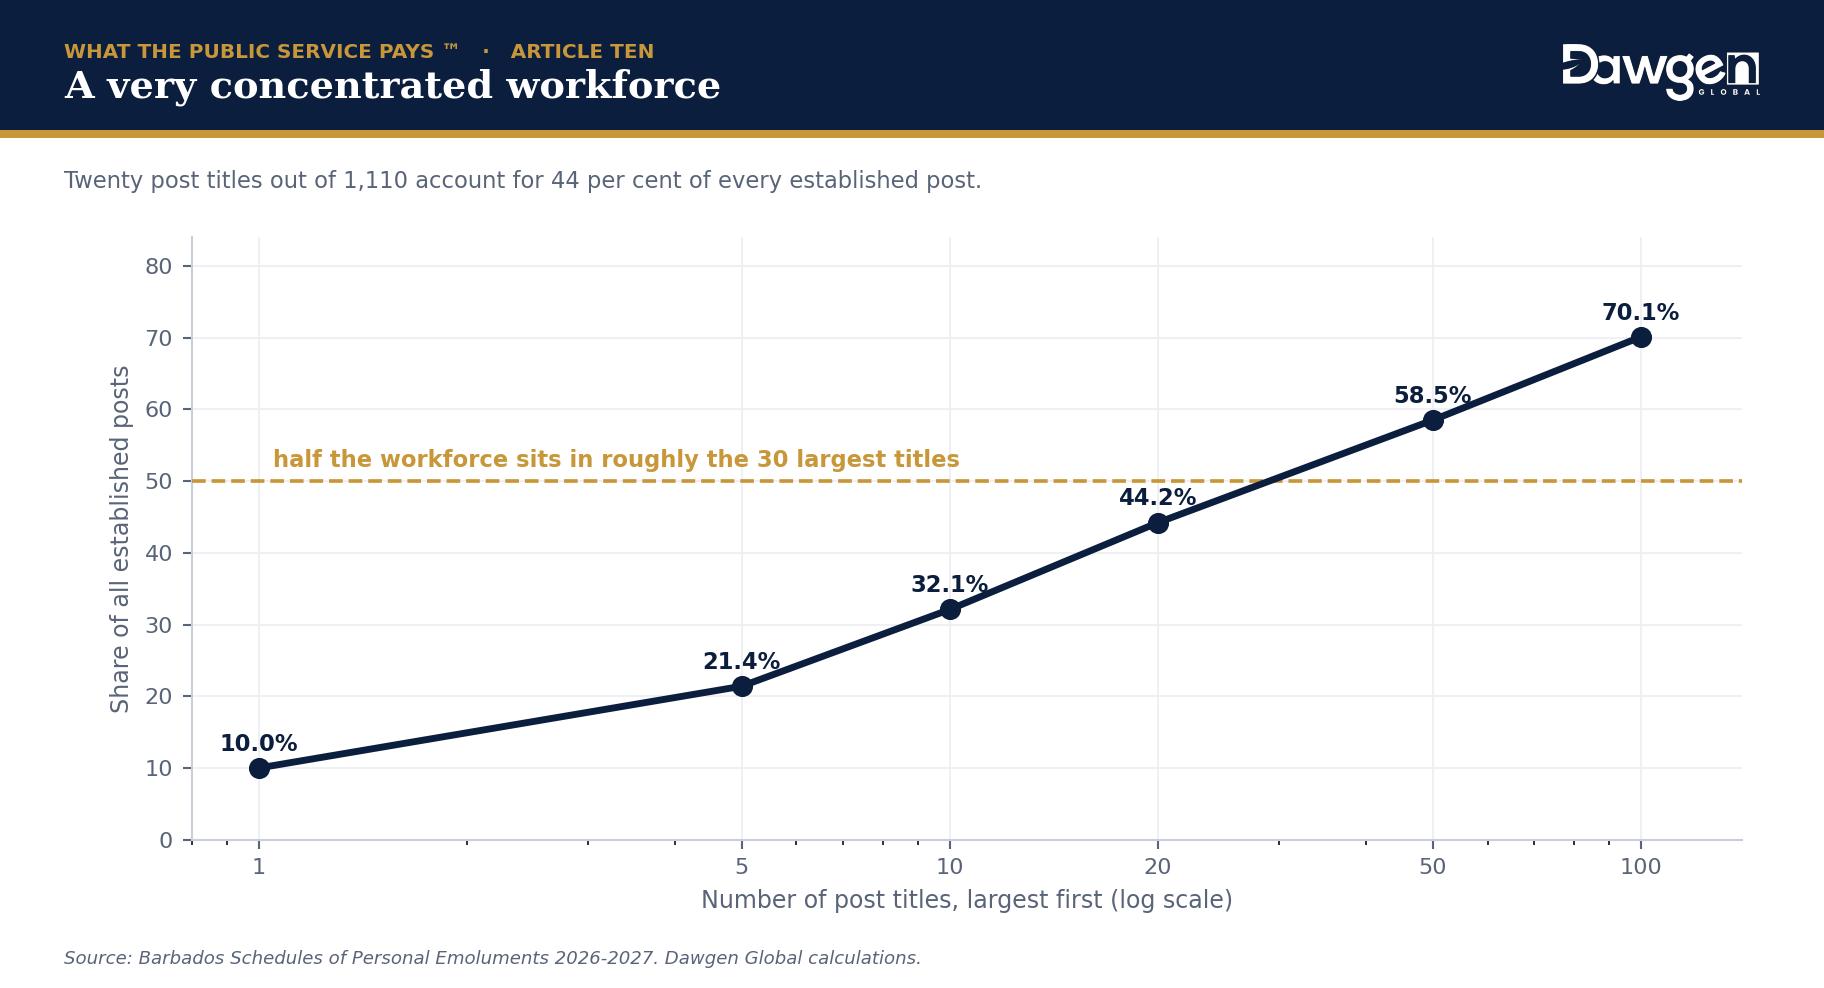
Exhibit 2. Cumulative share of established posts, by number of post titles.
The single largest title is ten per cent of the workforce. The largest five are 21.4 per cent. The largest twenty — out of 1,110 — are 44.2 per cent. The largest hundred are just over seventy per cent.
The practical consequence is significant and widely ignored. When a government negotiates a pay settlement, the cost is determined almost entirely by what happens in a small number of large occupational groups. A generous settlement for a group of two hundred professionals costs a fraction of a modest settlement for eleven hundred teachers.
| WHY THIS REFRAMES THE AFFORDABILITY ARGUMENT
Public debate treats pay restraint as though it applied evenly. It does not. In a workforce this concentrated, affordability is decided in a handful of groups, and those groups are teachers, clerical staff, general workers and the uniformed services. Any settlement discussion that does not begin with headcount by group is discussing percentages without discussing money. |
The long tail
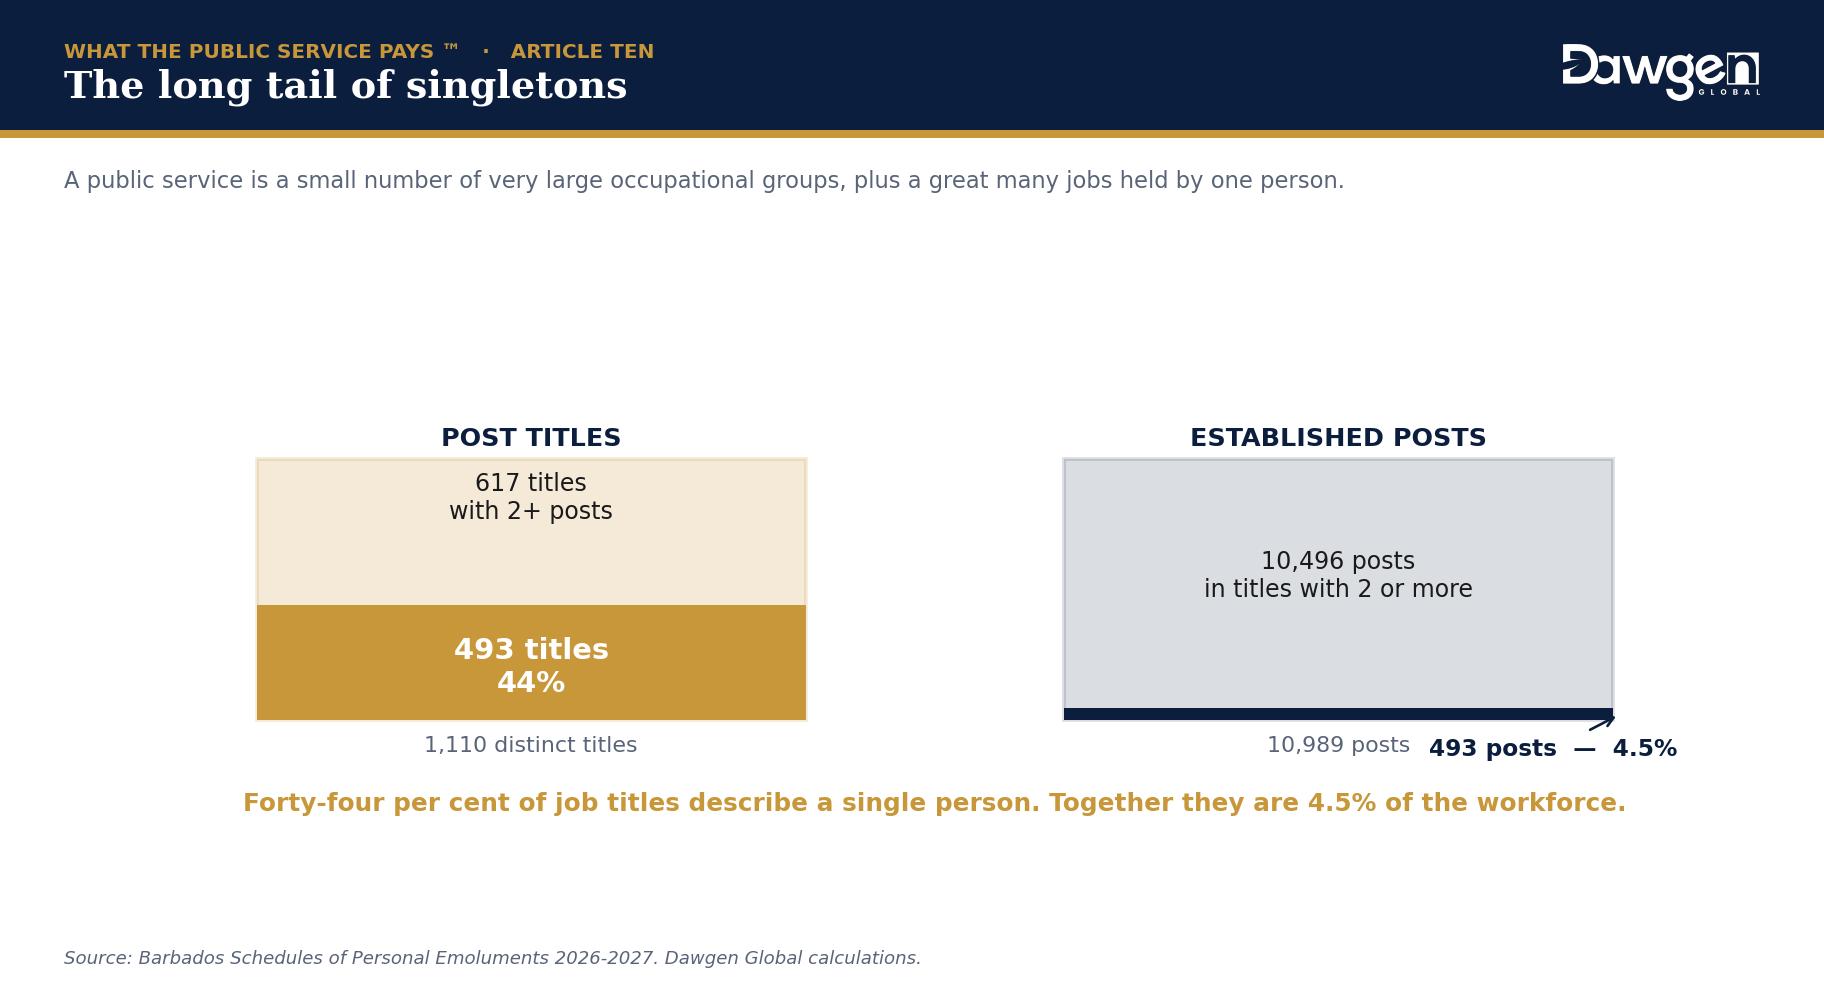
Exhibit 3. Post titles against posts. Most titles describe very few people.
At the other end of the distribution sits something equally striking. Of 1,110 distinct post titles, 493 — forty-four per cent — have exactly one post. Together those 493 titles account for 4.5 per cent of the workforce.
Nearly half the job titles in the Barbados central government describe a single person.
Some of that is inevitable and correct. There is one Chief Medical Officer, one Registrar of the Supreme Court, one Government Analyst. A state needs a great many unique senior functions, and each properly has its own title and its own grade.
Why singletons matter more than their number suggests
But singleton posts carry three risks that grow quietly, and they are worth naming because they apply to every organisation, not only to states.
The first is grading drift. A post with no comparator is graded against nothing. When it is reviewed, the natural reference is its own history and the person occupying it, which is exactly what job evaluation exists to avoid. Over successive reviews a singleton post can migrate several grades without any change in its content.
The second is documentation decay. Job descriptions for large groups are maintained because they are used constantly in recruitment. A description for a post filled once a decade is not, and by the time the holder retires nobody can say precisely what the job is.
The third is succession. A singleton is by definition a post with no bench. In a public service where 4.5 per cent of posts are singletons, that is several hundred roles with no obvious internal successor — and they are disproportionately senior.
What the schedule cannot tell you
Before drawing conclusions from any establishment schedule, three limits need stating, because each is easy to forget once the numbers are in a spreadsheet.
Posts are not people
An establishment lists approved positions. Whether they are filled is a separate question the schedule does not answer. A post may have been vacant for years and remain on the establishment, budgeted and counted, because removing it requires a decision that nobody has taken.
This matters for anyone using the data as a proxy for employment. The gap between establishment and actual headcount is the vacancy rate, and it is often concentrated in exactly the professional and technical grades that are hardest to recruit. An establishment can therefore look well staffed in precisely the areas where an organisation is struggling most.
Central government is not the public sector
The Barbados schedule covers central government ministries and departments. It does not cover statutory bodies, state-owned enterprises or, in most cases, the wider public sector. Those employ substantial numbers of people on separate terms, and any figure describing the public sector as a whole will be considerably larger than 10,989.
This is one of the more common errors in public sector employment commentary: a central government figure quoted as though it described the whole public sector, or a whole-public-sector figure compared against another jurisdiction’s central government count. The two are not the same population and the difference can be a factor of two or more.
Titles are not jobs
Our extraction normalises post titles to strip trailing scale codes, which means titles that the source separates may be grouped and vice versa. Two posts called “Clerical Officer” in different ministries may be genuinely identical or may have diverged considerably in practice.
We report the counts as close approximations rather than exact figures, and we would encourage anyone doing similar work to say the same. The concentration finding is robust to this: whether the largest twenty titles are 44 per cent or 42 per cent of the establishment does not change the argument. A precise-looking number that has not been qualified is a different matter.
Counting the workforce a different way
Barbados counts posts. Guyana counts something else, and its approach is the only one of its kind in our study.
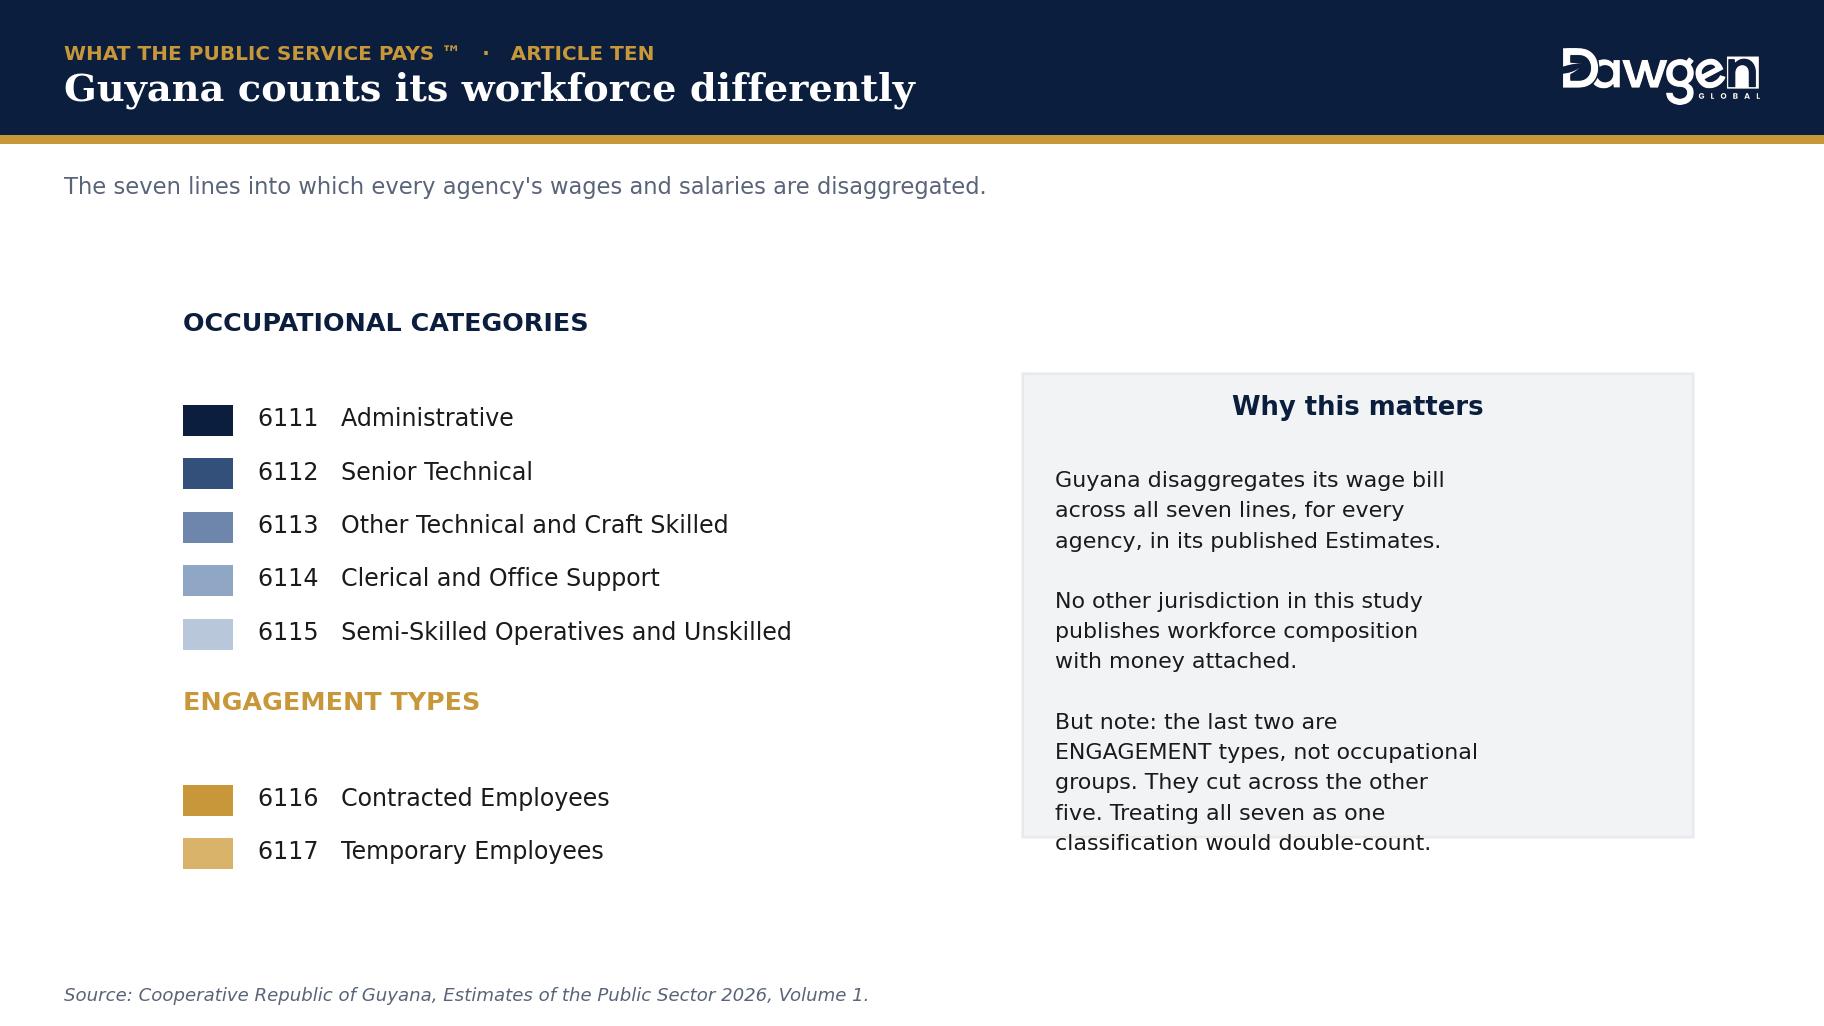
Exhibit 4. The seven lines into which Guyana disaggregates every agency’s wages and salaries.
Guyana’s Estimates break each agency’s compensation across seven categories: administrative; senior technical; other technical and craft skilled; clerical and office support; semi-skilled operatives and unskilled; contracted employees; and temporary employees. Every agency, every year, with money attached.
No other jurisdiction in this study publishes workforce composition alongside expenditure. It permits questions the Barbados schedule cannot answer — what proportion of an agency’s wage bill goes to administration rather than to technical staff, and how that varies between ministries.
One caution, which we noted in the pilot and repeat because it is easy to miss. The last two categories are ENGAGEMENT types, not occupational groups. A contracted employee is also administrative or technical or clerical. Treating all seven as a single classification would double-count, and the document does not warn you.
Headcount and pay together
The two datasets become considerably more useful when combined, and the Barbados schedule permits that combination because it carries both the post count and the salary provision on the same line.
Consider what that allows. The largest occupational group in the establishment is graduate teachers, at 1,102 posts. The lowest substantive grade in the service — the cleaner and general worker classification examined in the fourth article — is paid a flat BBD 25,891. General workers, heavy duty general workers, janitors, servers and maids together account for well over a thousand posts.
So a settlement affecting the lowest-graded classifications touches a population comparable in size to the entire teaching establishment. That is not how these groups are discussed, and it is not how their claims are usually weighed.
| THE ARITHMETIC THAT SHOULD PRECEDE ANY PAY DEBATE
Multiply headcount by rate for each of your largest groups and rank the products. That ranking — not the salary levels, and not the number of employees — is where your wage bill actually sits. In our experience the ordering surprises most organisations, because the groups that dominate cost are rarely the groups that dominate attention. |
What headcount tells you that pay cannot
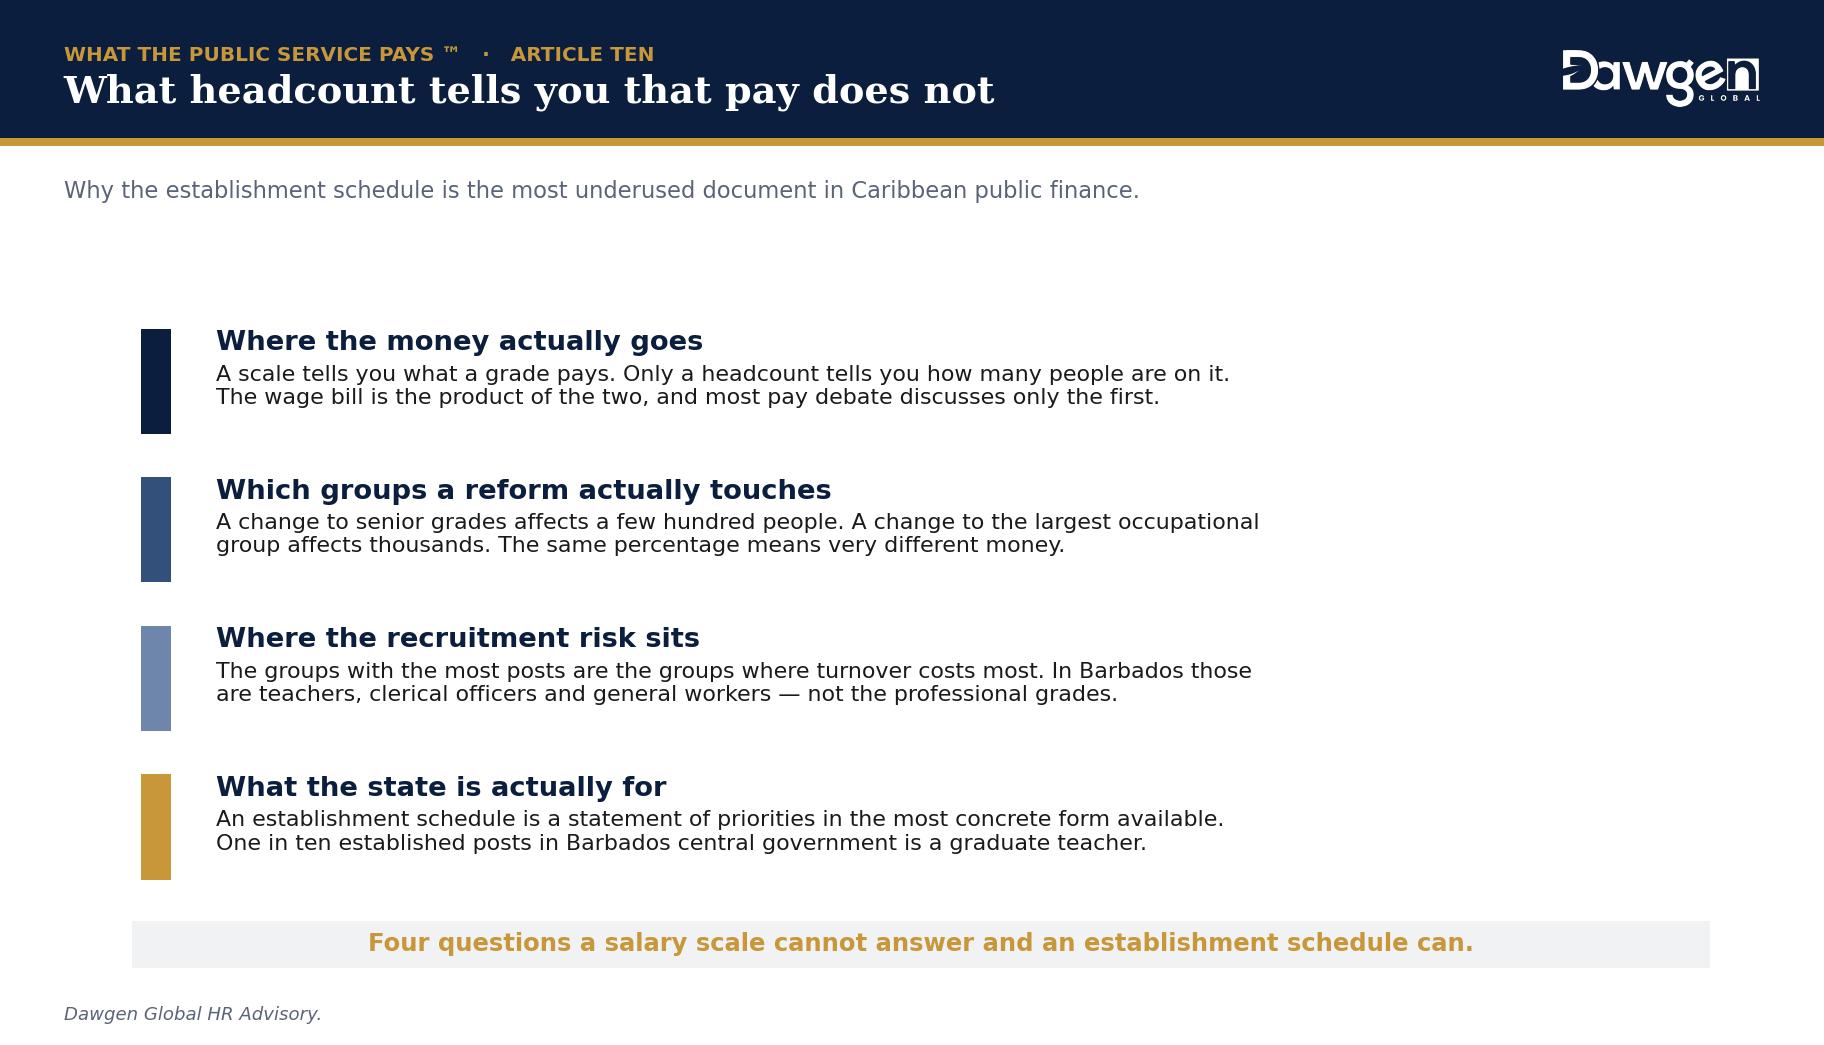
Exhibit 5. Four questions a salary scale cannot answer.
The fourth of those deserves emphasis. An establishment schedule is a statement of national priorities in the most concrete form a government produces. Not what it says it values — what it has actually approved posts and money for.
One in ten established posts in Barbados central government is a graduate teacher. That single fact says more about what the state is for than any policy document will, and it is available to anyone willing to read a 414-page schedule.
Reading your own establishment
Every employer holds this data. Very few have looked at it this way, and the exercise takes an afternoon.
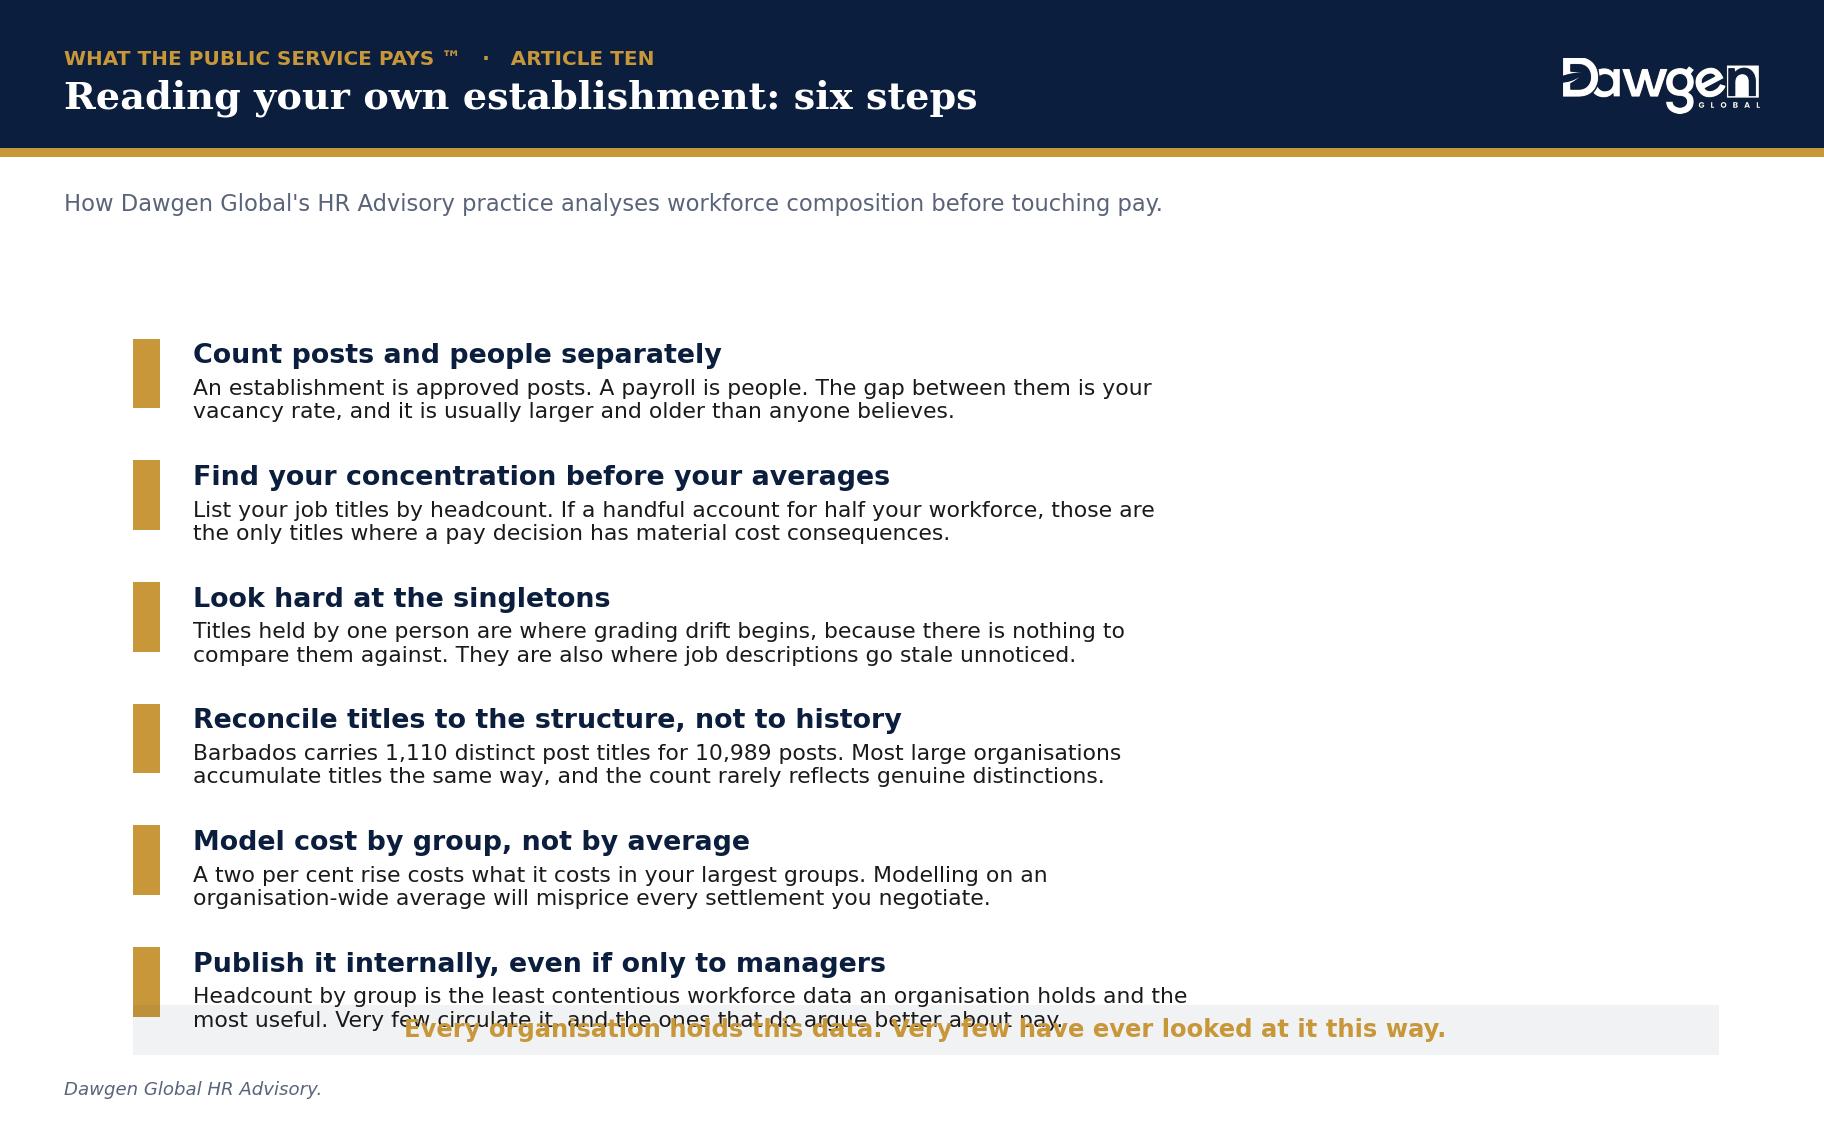
Exhibit 6. Six steps, in the order our HR Advisory practice takes them.
The first step is the one that most often produces a surprise. An establishment is approved posts; a payroll is people. The difference is the vacancy rate, and in most organisations we work with it is both larger and older than management believes. Posts left unfilled for years remain approved, budgeted and counted, which makes the establishment a poor guide to what the organisation actually costs and a good guide to what it once intended.
The fifth is the one that changes negotiations. Modelling a settlement on an organisation-wide average salary will misprice it, because the average is not where the people are. Cost the settlement in your three largest groups first and you will have most of the answer before you have finished.
The title problem
Barbados carries 1,110 distinct post titles for 10,989 posts — roughly one title for every ten people. Most large organisations accumulate titles at a similar rate, and the count rarely reflects genuine distinctions in work.
Titles proliferate for understandable reasons. A title is free to create and carries recognition, so it becomes the currency of last resort when pay cannot move. The cost appears later, when nobody can tell whether two similarly named posts are the same job, and grading decisions have to be taken without comparators that ought to exist.
A title census — simply listing every title with its headcount and asking which pairs are genuinely different jobs — is one of the cheapest useful exercises in reward management. It is also the one most likely to be resisted, for the same reason titles multiplied in the first place.
What to look for in your own numbers
Three patterns recur across the organisations we work with, and each is visible from headcount alone.
- A middle that has thinned. Count posts by grade band. Many organisations find they have a large junior population, a substantial senior one, and very little between — usually the result of years of recruiting at entry level and promoting selectively. It is the shape that produces succession problems five years later.
- Titles growing faster than posts. If your distinct-title count is rising while headcount is flat, titles are being used as a substitute for pay. That is not always wrong, but it should be a decision rather than a drift, and it degrades your ability to grade consistently.
- Concentration you had not noticed. Most managers can name their largest department. Far fewer can name their largest job title, and the two are frequently different. The largest title is where a pay decision costs real money.
A note on our work
This research sits within Dawgen Global’s HR Advisory practice, which advises on job evaluation, grading reviews, pay structure design and reward benchmarking across the Caribbean. Workforce composition analysis is where we normally begin a reward assignment, before any pay data is examined. It is quick, it is uncontentious, and it frequently establishes that the problem the client described is not the problem the numbers describe.
A closing thought on the singletons
Of everything in this data, the figure that has stayed with us is that forty-four per cent of job titles in a national government describe one person.
It is easy to read that as inefficiency. We do not think it is. A state has an irreducible number of unique functions — one chief medical officer, one registrar, one government analyst — and a small state has very nearly the same number of them as a large one, spread across a much smaller workforce. That is the diseconomy of small scale in its most concrete form, and it is a structural feature of Caribbean public administration rather than a management failing.
It does mean that these jurisdictions carry a heavy load of posts with no comparator, no bench and no natural successor. Whatever else the region’s public services need, they need succession planning more than most — and an establishment schedule is where you would start looking for it.
Next in this series
Article eleven turns to the top of the structure — what the most senior career posts in the Caribbean public service are paid, how those figures are arrived at, and why the apex is both the most discussed and the least comparable part of any pay system.
| AN INVITATION
Establishment schedules are the least available document type in our source map: only one of five pilot jurisdictions publishes one. If your jurisdiction produces a personnel or establishment schedule, whether or not it is published, we would very much like to hear from you. Public service ministries, personnel departments and statistical offices wishing to supply information, or to correct anything published in this series, are invited to contact the firm. |
SOURCES
Barbados, Schedules of Personal Emoluments 2026-2027, Government Printing Department. Headcount, title counts and concentration figures are Dawgen Global calculations from an extraction of 2,399 establishment rows covering 10,989 posts in the 2025-26 column. Post titles have been normalised to remove trailing salary scale codes, which may group or separate titles differently from the source document; the figures should be read as close approximations rather than exact counts. No individual officer’s name or salary has been recorded or reported. Cooperative Republic of Guyana, Estimates of the Public Sector 2026, Volume 1.
This article is the tenth in What the Public Service Pays™, a Dawgen Global series drawn from research across sixteen Caribbean jurisdictions. Dawgen Global is an independent, integrated multidisciplinary professional services firm serving the Caribbean. Enquiries: [email protected] | dawgen.global
About Dawgen Global
Dawgen Global is an independent, integrated multidisciplinary professional services firm headquartered at Dawgen Towers, 47-49 Trinidad Terrace, Kingston 5, Jamaica, serving more than 15 territories across the Caribbean. Founded and led by Dr. Dawkins Brown, Executive Chairman, the firm is independent and not affiliated with any international network. It delivers a full suite of professional services under one roof: audit and assurance; tax advisory; IT and digital transformation; risk management; cybersecurity; actuarial and insurance regulatory advisory; HR advisory; mergers and acquisitions; corporate recovery; business advisory and strategy; accounting BPO and virtual CFO services; and legal process outsourcing.
The proposition is simple: big-firm capability without the big-firm price. Dawgen Global’s integrated approach is built for the specific complexities and opportunities of the Caribbean market, helping organizations make sharper, better-informed decisions that drive measurable progress.
To explore a partnership, reach out:
- Website: dawgen.global
- Email: [email protected]
- WhatsApp (Global): +1 555-795-9071
- Caribbean offices: +1 876-665-5926 | +1 876-929-3670 | +1 876-926-5210