
How Jamaica and the wider Caribbean can use evidence to convert visitor spend into local wealth—consistently and at scale
Why MEAL matters (and what it actually is)
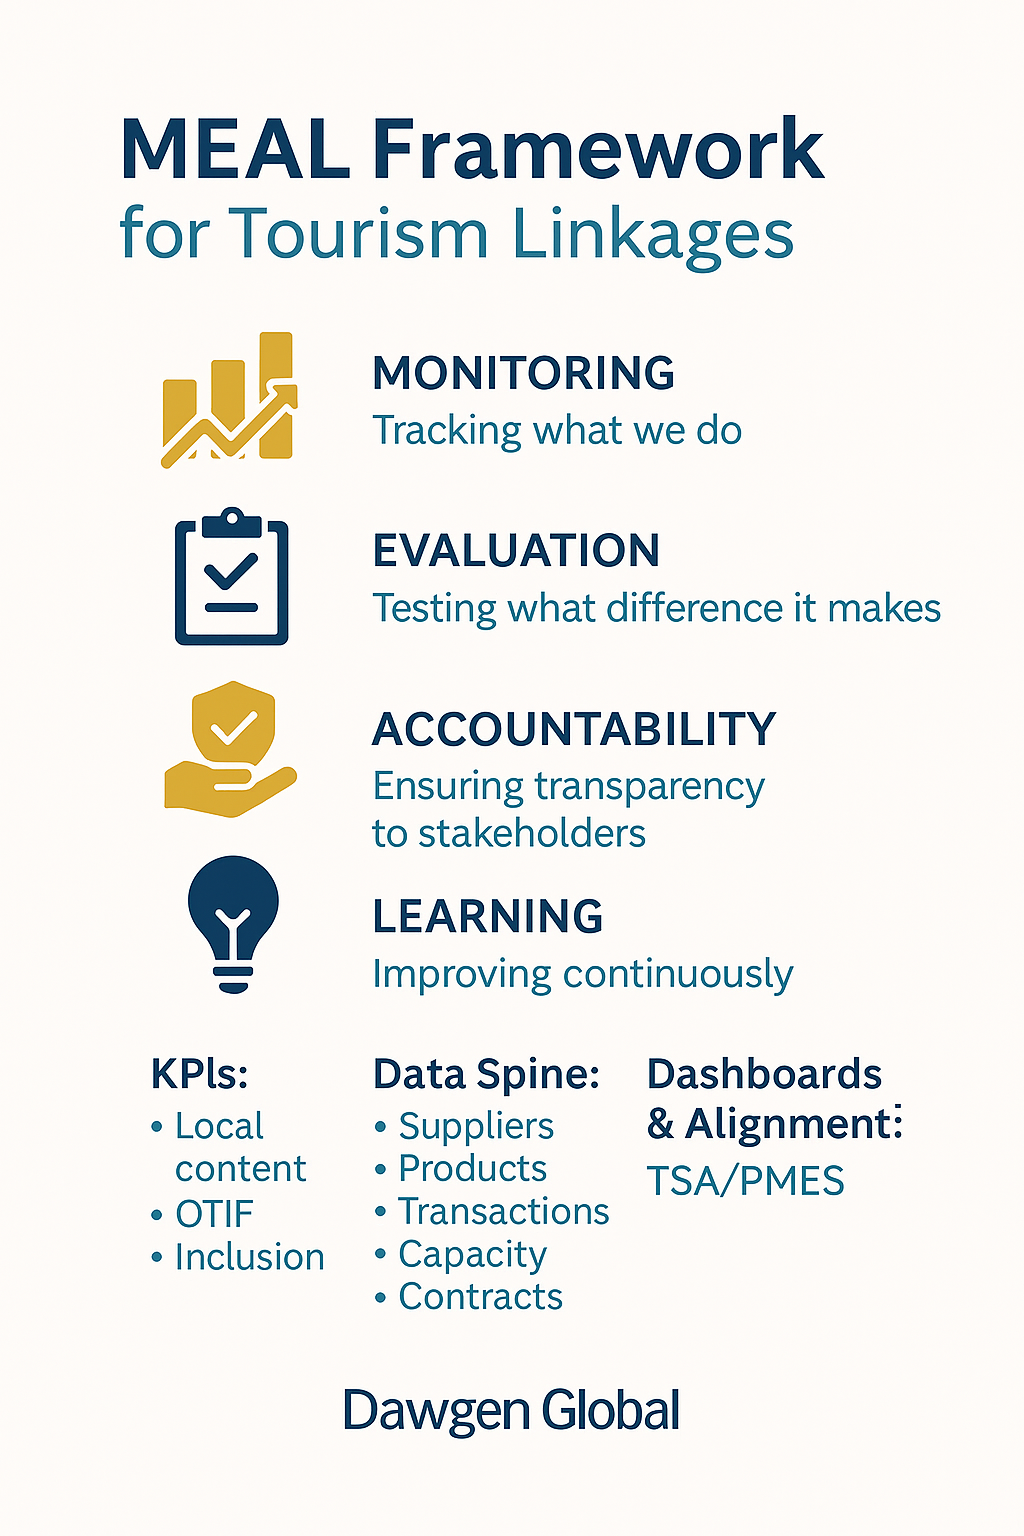
Monitoring, Evaluation, Accountability, and Learning (MEAL) is the operating system for performance. It turns policies and projects into measurable outcomes by (1) tracking what we do (Monitoring), (2) testing what difference it makes (Evaluation), (3) ensuring transparency to funders, citizens, and partners (Accountability), and (4) institutionalizing improvement over time (Learning).
In tourism, MEAL is the difference between announcing a Local Content Policy and actually raising the share of hotel and attraction spending going to domestic suppliers, increasing inclusive employment, and lifting Micro, Small and Medium Tourism Enterprises (MSTEs) into higher-value segments of the Tourism Value Chain (TVC) and even Global Value Chains (GVCs).
This article gives ministries, Destination Management Organizations (DMOs), hotel groups, and industry associations a ready-to-implement MEAL blueprint built for Caribbean realities: lean teams, limited budgets, many stakeholders, and real-world shocks (hurricanes, pandemics, commodity spikes).
The five design principles of a high-functioning tourism MEAL system
-
Start with a Theory of Change (ToC), not a shopping list of activities.
A Theory of Change describes how inputs and activities lead to outputs, outcomes, and impact—and the assumptions that must hold. In linkage programs, the ToC often asserts: If we fix standards, finance, aggregation, and procurement, then buyers will switch to local options, thereby increasing domestic value capture and inclusive jobs. -
Use a logical framework (logframe) to translate the ToC into measurable targets.
A logframe structures objectives, indicators, baselines, targets, data sources, and responsibilities. It’s the contract between policy intent and day-to-day delivery. -
Measure what changes at the buyer–supplier interface.
Don’t drown in vanity metrics. Focus on local content rates, on-time in-full (OTIF) reliability, quality acceptance rates, and supplier graduation (e.g., moving from tier-2 aggregator to tier-1 direct hotel supplier). -
Bake in Accountability and Learning cycles.
Publish simple dashboards quarterly (Accountability). Run structured “what worked/what didn’t” sessions to adjust the next quarter’s plan (Learning). -
Integrate with the Tourism Satellite Account (TSA) and the public sector’s Planning, Monitoring, Evaluation and Reporting System (PMES).
The Tourism Satellite Account (TSA) gives official macro estimates. Extend it with domestic input tables and inclusion indicators so MEAL feeds national accounts. Align your indicators and reporting cadence with PMES so budgets and procurement reinforce the same outcomes.
A practical, tourism-specific Theory of Change (example)
Impact (5–10 years)
-
Higher domestic value added from tourism; resilient supply chains; quality jobs and incomes; diversified experiences that spread benefits to communities.
Outcomes (2–5 years)
-
Increased local content rate in priority categories (fresh produce, seafood, baked goods, soft furnishings, tours).
-
More MSTEs meeting standards and contracting directly with anchors.
-
Improved guest satisfaction with authentic local products and experiences.
-
Stronger inclusion (women-/youth-led firms; community-based tourism).
Outputs (6–24 months)
-
Operational Supplier Development Centres (SDCs), Aggregation Hubs, and a national Tourism Sourcing Portal.
-
Signed Memoranda of Understanding (MOUs) with hotel groups and attractions.
-
Functioning blended finance (credit guarantees; results-based grants).
-
Published procurement calendars and category roadmaps.
Activities (ongoing)
-
Supplier audits and coaching; HACCP training; quality and packaging upgrades; e-procurement integration; concierge protocols for community experiences; quarterly learning reviews; dashboard publication.
Key Assumptions
-
Tourism demand remains stable enough to support supplier ramp-up.
-
Public finance windows and donor support are timely.
-
Standards agencies and buyers enforce requirements consistently.
-
Logistics and utilities are reliable enough to honor OTIF commitments.
The logframe: from intentions to indicators (template + example)
Key terms (expanded on first use):
-
Key Performance Indicator (KPI): a measurable value that shows progress toward a desired result.
-
Baseline: where we are now.
-
Target: where we want to be by a deadline.
-
Data Source: where the number will come from (e.g., e-procurement system, surveys, TSA extension).
-
Frequency: how often it’s reported.
-
Owner: who collects and signs off.
Sample logframe (priority category: Fresh Produce)
| Level | Objective | KPI | Baseline (Year 0) | Target (Year 1) | Target (Year 3) | Data Source | Frequency | Owner |
|---|---|---|---|---|---|---|---|---|
| Impact | Raise domestic value added | Share of domestic inputs in total tourism intermediate consumption (%) | 28% | 32% | 40% | TSA extension, input–output tables | Annual | Ministry/Tourism Agency + Statistics Office |
| Outcome | Increase local content in fresh produce | Local content rate—fresh produce (%) | 35% | 50% | 70% | E-procurement + hub invoices | Quarterly | Linkages Unit |
| Outcome | Improve reliability | OTIF (on-time in-full) delivery rate (%) | 82% | 90% | 95% | Buyer systems + hub logs | Monthly | Aggregation Hub |
| Output | Expand certified suppliers | # of HACCP-certified suppliers | 12 | 40 | 120 | SDC registry | Quarterly | SDC |
| Output | Secure anchor demand | # of MOUs with volume commitments | 0 | 6 | 12 | Linkages Unit | Quarterly | Linkages Unit |
| Activity | Build capacity | # of coaching hours delivered | 0 | 1,200 | 3,600 | SDC MIS | Monthly | SDC |
HACCP = Hazard Analysis and Critical Control Point, the international standard for food safety.
MIS = Management Information System, the database used to track activities and results.
Indicator dictionary (how to define and calculate your KPIs)
-
Local Content Rate – Category X (%)
-
Definition: Share of spend in Category X sourced from domestic suppliers meeting program standards.
-
Formula: (Domestic spend in X ÷ Total spend in X) × 100.
-
Data Source: E-procurement, finance ledgers, hub invoices.
-
Notes: Count only transactions that meet quality and compliance standards to avoid gaming.
-
-
On-Time In-Full (OTIF) Delivery Rate (%)
-
Definition: Percentage of purchase orders delivered by the agreed date/time and meeting quantity/quality specs.
-
Formula: (# POs delivered OTIF ÷ # POs) × 100.
-
Source: Buyer warehouse/procurement systems; hub logs.
-
Notes: Track root causes (late harvest, transport, cold chain, invoicing errors).
-
-
Supplier Graduation (#)
-
Definition: Number of MSTEs moving up the supplier ladder (e.g., micro → tier-2 aggregator → tier-1 direct).
-
Source: SDC registry and MOUs.
-
Notes: Require documented contracts at the higher tier.
-
-
Inclusion Index (0–100)
-
Definition: Composite score combining share of spend with women-/youth-led firms, community-based tourism (CBT) participation, and geographic spread.
-
Formula: Weighted average of component indicators (agree weights with stakeholders).
-
Source: Supplier registry, contract database, CBT associations.
-
-
Guest Experience NPS—Local Excursions (score)
-
Definition: Net Promoter Score (NPS) for curated local experiences.
-
Formula: % Promoters − % Detractors (standard NPS method).
-
Source: Post-experience surveys via QR codes, hotel apps, or SMS.
-
-
Waste-to-Value Diversion Rate (%)
-
Definition: Share of resort waste diverted to recycling/upcycling or compost.
-
Source: Facilities logs, recycler receipts.
-
Relevance: Links sustainability to cost savings and local enterprise growth.
-
Building the MEAL data spine (without boiling the ocean)
1) Minimum viable data model (MVDM)
Focus on five core tables you can stand up in 60–90 days:
-
Suppliers (ID, legal status, women/youth-led flag, location, certifications).
-
Products/Services (SKU or service code, category, standards).
-
Transactions (date, buyer, supplier, amount, currency, local/foreign flag, OTIF flag).
-
Capacity Events (audits, coaching hours, training modules completed).
-
MOUs/Contracts (anchor buyer, category volumes, duration, milestones).
Host this in a simple cloud database or a well-structured spreadsheet/workbook at first. Protect privacy and commercial sensitivity with role-based access.
2) Data flows and roles
-
Anchors (hotels/attractions/cruise) send monthly procurement extracts (line level), plus OTIF and quality flags.
-
Aggregation Hubs submit weekly intake/delivery logs and cold-chain exceptions.
-
Supplier Development Centres (SDCs) update training/certification status.
-
Linkages Unit compiles MOUs and category roadmaps and resolves data issues.
-
Statistics Office validates annual aggregates and integrates with the Tourism Satellite Account (TSA).
-
PMES Team ingests quarterly dashboards into the government performance cycle.
3) Data quality routines
-
3-way reconciliation (buyer ledger vs. hub logs vs. supplier invoices).
-
Automated checks (duplicate POs, negative quantities, out-of-range prices).
-
Data Issue Register with owners and resolution dates.
Dashboards decision-makers will actually use
Keep it one page per audience:
A. Minister / Permanent Secretary (Quarterly)
-
Local Content Rate by priority category vs. target.
-
Inclusion Index.
-
MOUs signed and value committed.
-
Top 3 risks and mitigations.
-
Traffic-light view of category roadmaps.
B. Programme Manager / Linkages Unit (Monthly)
-
OTIF trend; quality acceptance rates; stockout incidents.
-
Supplier Graduation funnel (by stage).
-
Coaching hours delivered vs. plan; certification pipeline.
-
Spend at risk (categories falling behind) with drill-downs.
C. Buyer/Anchor Operations (Weekly)
-
Exceptions list: late deliveries, quality rejects, missing invoices.
-
Next-week delivery schedule; harvest forecasts.
-
Price/volume variance against MOU commitments.
D. Public Accountability (Quarterly, public site)
-
High-level local content summary, inclusion highlights, success stories.
-
Open data (aggregated) to build trust without exposing commercial secrets.
The MEAL calendar (cadence that keeps everyone honest)
-
Weekly (Ops): Exceptions triage with buyers, hubs, and SDCs.
-
Monthly (Delivery): Category performance review, unblockers, re-forecasting.
-
Quarterly (Learning + Accountability): Dashboard to PMES; structured learning workshop (“start/stop/continue”), adjust targets if assumptions shift.
-
Annual (Evaluation): Independent check on outcome/impact indicators; update the ToC; feed results into TSA; refresh three-year roadmap.
Evaluation that teaches, not just audits
Formative Evaluation (months 6–12): Are we implementing as designed? What quick adjustments will raise performance?
Process Evaluation (months 12–18): Where are the bottlenecks (procurement rules, cold chain, standards, finance)?
Outcome Evaluation (months 18–36): What changed for local content, reliability, inclusion, and guest satisfaction—and why?
Impact Evaluation (year 3+): How much additional domestic value added and decent jobs can be attributed to the program, controlling for external factors?
Use mixed methods: administrative data, buyer/supplier interviews, mystery shopping on concierge recommendations, and guest surveys for experiences.
Accountability that builds trust
-
Public Scorecards: short, visual, plain-language summaries.
-
Community Feedback Loops: WhatsApp lines/QR codes for CBT (Community-Based Tourism) partners to flag issues.
-
Procurement Transparency: publish category MOU goals, selection criteria, and grievance channels.
-
Supplier Ombud: independent channel to resolve payment delays or unfair practices.
Learning: turning evidence into better decisions
A MEAL system only works if it changes behavior. Build rituals:
-
Quarterly Learning Reviews: facilitated sessions with decision-rights (you can actually choose to change specs, shift targets, or reallocate budget).
-
Failure Post-Mortems: write short notes on pilots that didn’t work and why—then publish internally.
-
Playbooks: when a category model works (e.g., bakery/pastry), codify it as a step-by-step guide for the next region.
How to start in 90 days (Jamaica-ready, Caribbean-portable)
Days 0–15: Frame and align
-
Approve the Theory of Change and 8–10 core KPIs.
-
Nominate data owners and sign a one-page data-sharing protocol with anchors.
Days 16–45: Stand up the data spine
-
Build the five-table Minimum Viable Data Model (MVDM).
-
Pilot automated procurement extracts with 2–3 anchor buyers.
-
Configure a one-page dashboard (Minister view + Manager view).
Days 46–90: Run–learn–improve
-
Publish the first dashboard; hold the first learning review.
-
Fix the top three data issues; onboard one new category (e.g., seafood).
-
Announce the supplier graduation criteria and certification grant window.
Risk management inside MEAL
-
Data gaps: Mitigation = phased rollout; impute with conservative rules; use audits to calibrate.
-
Perverse incentives: Mitigation = triangulate (quality + OTIF + inclusion); spot checks; independent evaluation.
-
Supplier cash-flow stress: Mitigation = invoice financing, faster pay for verified OTIF deliveries.
-
Anchor pushback: Mitigation = start with mini-contracts; dual sourcing; show total-cost-of-ownership benefits (reduced lead times, lower stockouts).
-
Shock events: Mitigation = scenario targets; emergency sourcing protocols; resilience KPIs (backup suppliers, buffer inventory).
Frequently asked questions (MEAL edition)
Isn’t this too much reporting?
Not if you focus on 10–15 high-value KPIs pulled automatically from systems where possible. The aim is fewer spreadsheets, more decisions.
What if small suppliers don’t have digital systems?
Hubs and SDCs can capture transactions; simple mobile forms (offline-capable) work well. The key is standardized, lightweight data.
Can MEAL work in experiences (not just goods)?
Yes—track curated itineraries, safety checks, bookings, Net Promoter Score (NPS), and off-property spend, then compare against guest demographics and resort type.
How does MEAL link to finance?
KPIs become triggers for releasing results-based grants or credit guarantees (e.g., when a supplier reaches 95% OTIF for three months).
What success looks like after 12–18 months
-
Local content rates up 10–15 percentage points in at least three categories.
-
Reliability ≥ 90% OTIF across participating suppliers.
-
Supplier Graduation: dozens of MSTEs step up a tier; more women-/youth-led firms win contracts.
-
Guest Experience: higher NPS for local excursions; more distinctive “sense of place” ratings.
-
Public Confidence: quarterly dashboards are published on time; data is consistent with TSA updates and PMES reporting.
How Dawgen Global helps you get there
-
System design: Theory of Change, logframe, KPI dictionary, dashboarding, and PMES alignment.
-
Data engineering: set up the Minimum Viable Data Model, e-procurement extracts, and reconciliation routines.
-
Capability building: train Linkages Units, SDCs, hubs, and anchors to operate the system themselves.
-
Evaluation: independent process/outcome evaluations with clear recommendations.
-
Change management: quarterly learning reviews, decision-rights frameworks, and communication packs for public scorecards.
Our promise: lightweight where possible, rigorous where it counts, always tied to real buyer–supplier behavior.
Next Step!!
Policies don’t deliver results—systems do. A fit-for-purpose MEAL architecture can turn your linkage strategy into a repeatable engine for local wealth creation, inclusion, and resilience. If you’re ready to stand up a high-impact MEAL system in the next 90 days, Dawgen Global can lead the design and handover—so your teams own it by quarter two.
About Dawgen Global
“Embrace BIG FIRM capabilities without the big firm price at Dawgen Global, your committed partner in carving a pathway to continual progress in the vibrant Caribbean region. Our integrated, multidisciplinary approach is finely tuned to address the unique intricacies and lucrative prospects that the region has to offer. Offering a rich array of services, including audit, accounting, tax, IT, HR, risk management, and more, we facilitate smarter and more effective decisions that set the stage for unprecedented triumphs. Let’s collaborate and craft a future where every decision is a steppingstone to greater success. Reach out to explore a partnership that promises not just growth but a future beaming with opportunities and achievements.
✉️ Email: [email protected] 🌐 Visit: Dawgen Global Website
📞 📱 WhatsApp Global Number : +1 555-795-9071
📞 Caribbean Office: +1876-6655926 / 876-9293670/876-9265210 📲 WhatsApp Global: +1 5557959071
📞 USA Office: 855-354-2447
Join hands with Dawgen Global. Together, let’s venture into a future brimming with opportunities and achievements

