

Every board watches the bottom line. Profit after tax is the number that shareholders, lenders and the financial press quote first, and it deserves attention. But a board that steers by profit alone is steering by the wake of the ship rather than the compass. Profit tells you where the organisation has been. It says much less about whether the value it reports is durable, whether it was earned or merely moved, and whether the business is converting that value into the cash it needs to survive the next shock.
In the CARIMETRIX™ framework, financial performance is the first of five dimensions: D1, Prosperity & Financial Value. It is the outcome that the other four dimensions exist to produce. This article explains how to measure it properly, why Caribbean organisations need a broader view of financial health than the income statement offers, and how to design financial measures that inform decisions rather than simply report history.
Why profit alone misleads
Profit is an accounting construct. It depends on judgements about revenue recognition, provisions, valuations and the timing of costs. Two organisations with identical cash flows can report very different profits, and one organisation can report rising profits while its cash position quietly deteriorates. Four distortions recur.
Earned versus moved. Fair value gains, one-off disposals, related-party income and reversals of provisions can lift reported profit without any improvement in the underlying business. A board needs to see core operating earnings separately from items that are moved rather than earned.
Profit versus cash. A distributor that extends credit to win sales will report revenue and margin immediately, but the cash may arrive months later, or not at all. When debtor days drift upwards and inventory builds, profit can rise while liquidity falls.
Margin versus mix. Total gross margin can hold steady while the mix shifts towards customers, products or channels that cost far more to serve than the margin reveals. Without cost-to-serve insight, the most profitable-looking customers may be the least profitable in reality.
This year versus the next five. Cutting maintenance, training or marketing improves this year’s profit while weakening next year’s capacity to earn. A financial dimension that rewards short-term profit without guarding against underinvestment invites exactly this behaviour.
The five indicator families of D1
CARIMETRIX measures prosperity across five families, each with lagging measures that confirm results and leading measures that predict them.
| Family | Lagging measures (results) | Leading measures (early warning) |
| Growth | Revenue growth; share of revenue from new products or markets | Pipeline value and conversion rate; quotes issued; new accounts opened |
| Profitability | Gross margin; EBITDA (earnings before interest, tax, depreciation and amortisation) margin; core operating margin | Price realisation against list; discount leakage; margin on new business |
| Cost efficiency | Operating cost to revenue; cost per unit or transaction | Spend under management; budget variance trend; procurement compliance |
| Cash and capital | Cash conversion cycle; free cash flow; ROCE (return on capital employed) | Debtor ageing profile; inventory days by category; capital project pipeline |
| Owner value or value for money | EPS (earnings per share) growth; ROE (return on equity); for public bodies and charities, cost per output and share of spending reaching the mission | Strategic investment pipeline; cost of capital trend; grant drawdown rate |
No organisation needs all of these. A typical enterprise scorecard carries four to seven D1 measures, chosen because they trace to the strategy and change decisions. A credit union focused on sustainable growth might choose net interest margin, cost-to-income ratio, loan growth, delinquency-adjusted yield and a pipeline measure. A manufacturer under margin pressure might choose gross margin by product family, cost per unit, cash conversion cycle and price realisation.
The Caribbean dimension of financial health
Caribbean organisations face financial conditions that make a narrow profit focus particularly risky.
Foreign exchange exposure. Many businesses earn in local currency and pay for imports, debt service or technology in United States dollars. A margin measure that ignores currency movements can mislead badly. Where exposure is material, D1 should include a measure of margin at constant exchange rates, or the share of costs that is naturally hedged.
Concentration. In small markets, a handful of customers, suppliers or contracts can account for a large share of revenue. Revenue concentration is a financial measure, not only a risk measure, because it determines how much of the bottom line could disappear with one decision made elsewhere.
Cost of capital. Interest rate cycles and the depth of local capital markets affect the cost of funding growth. A business earning a return on capital below its cost of capital is shrinking its value, even if profits rise. ROCE compared against the cost of capital is therefore one of the most useful D1 measures a Caribbean board can adopt.
Liquidity after shocks. Hurricanes and economic shocks test liquidity first. Months of operating cost covered by available cash and committed facilities is a simple measure that tells a board how long the organisation could survive a disruption.
Designing D1 measures that drive decisions
A financial measure becomes decision-grade when it passes the seven CARIMETRIX selection tests and is fully defined on a KPI Definition Card. Debtor days illustrates the discipline.
The card specifies the formula exactly: trade receivables divided by credit sales over the last 12 months, multiplied by 365, excluding related-party balances. It names the polarity (lower is better), the source (the general ledger and receivables ledger), the frequency (monthly, by the fifth working day), the KPI owner (the financial controller), the data owner (the credit supervisor), the baseline, the target and the method used to set it. It sets thresholds: green at or below the target, amber within tolerance, red beyond it.
Crucially, it also names a counter-measure. Debtor days can be improved by refusing credit to good customers or by writing off balances aggressively, neither of which creates value. Pairing debtor days with bad-debt write-offs and customer attrition ensures the measure improves for the right reasons. Every D1 measure that could be gamed should carry such a pair: cost per unit paired with quality, margin paired with volume, budget variance paired with delivery of planned investment.
Setting financial targets with logic
The most common financial target in the region is last year plus a round percentage. CARIMETRIX replaces this with one of five documented methods. Historical trend suits stable measures with reliable history. Benchmark sets the target against peers or best-in-class performance and suits measures such as cost-to-income or debtor days. Capability-based targets are derived from planned improvements, so a target for cost per transaction reflects the automation project that will deliver it. Strategic requirement works back from what the strategy, the budget, a lender’s covenant or a regulator demands. Stretch with glide path breaks a multi-year ambition into annual steps.
Every target is then tested for realism (is the capacity there?), consistency (does a revenue target conflict with a margin target?) and funding (is the investment required to reach it in the budget?). A target that fails these tests is not ambitious; it is fictional.
D1 as the outcome of the system
The most important feature of D1 in CARIMETRIX is its position in the value linkage. Financial results are produced by valued relationships (D2), excellent processes (D3), sound stewardship (D4) and capable people (D5). When a D1 measure turns red, the strategy map tells the board which drivers to examine. A margin decline may trace to process cost (D3) or to discounting to retain customers (D2). A rising cost-to-income ratio may trace to skills gaps that force manual work (D5).
This is why CARIMETRIX insists that financial measures never stand alone on the scorecard. A board that sees only D1 can ask what went wrong; a board that sees all five dimensions can see why, and can act on the cause before the next set of results arrives.
Eight questions for the board
- Can we separate earnings that were earned from gains that were moved?
- Is our cash conversion keeping pace with our reported profit?
- Do we know which customers, products and channels truly create value after the cost of serving them?
- Are we earning a return on capital above our cost of capital?
- How exposed is our margin to currency movements and customer concentration?
- How many months could we operate if revenue stopped tomorrow?
- Was each financial target set by a documented method, and is it funded?
- Which non-financial measures on our scorecard predict next year’s financial results?
The CARIMETRIX–CARIVANCE™ framework in full
Dawgen Global’s CARIMETRIX–CARIVANCE™ Performance System joins measurement and improvement in a single loop. CARIMETRIX™ shows leadership where performance stands and why it matters. CARIVANCE™ turns the gaps that CARIMETRIX reveals into funded, owned and verified improvements. A governance layer turns information into decisions, and a set of enablers (graded data, dashboards, trained owners and assurance) keeps the loop turning year after year.
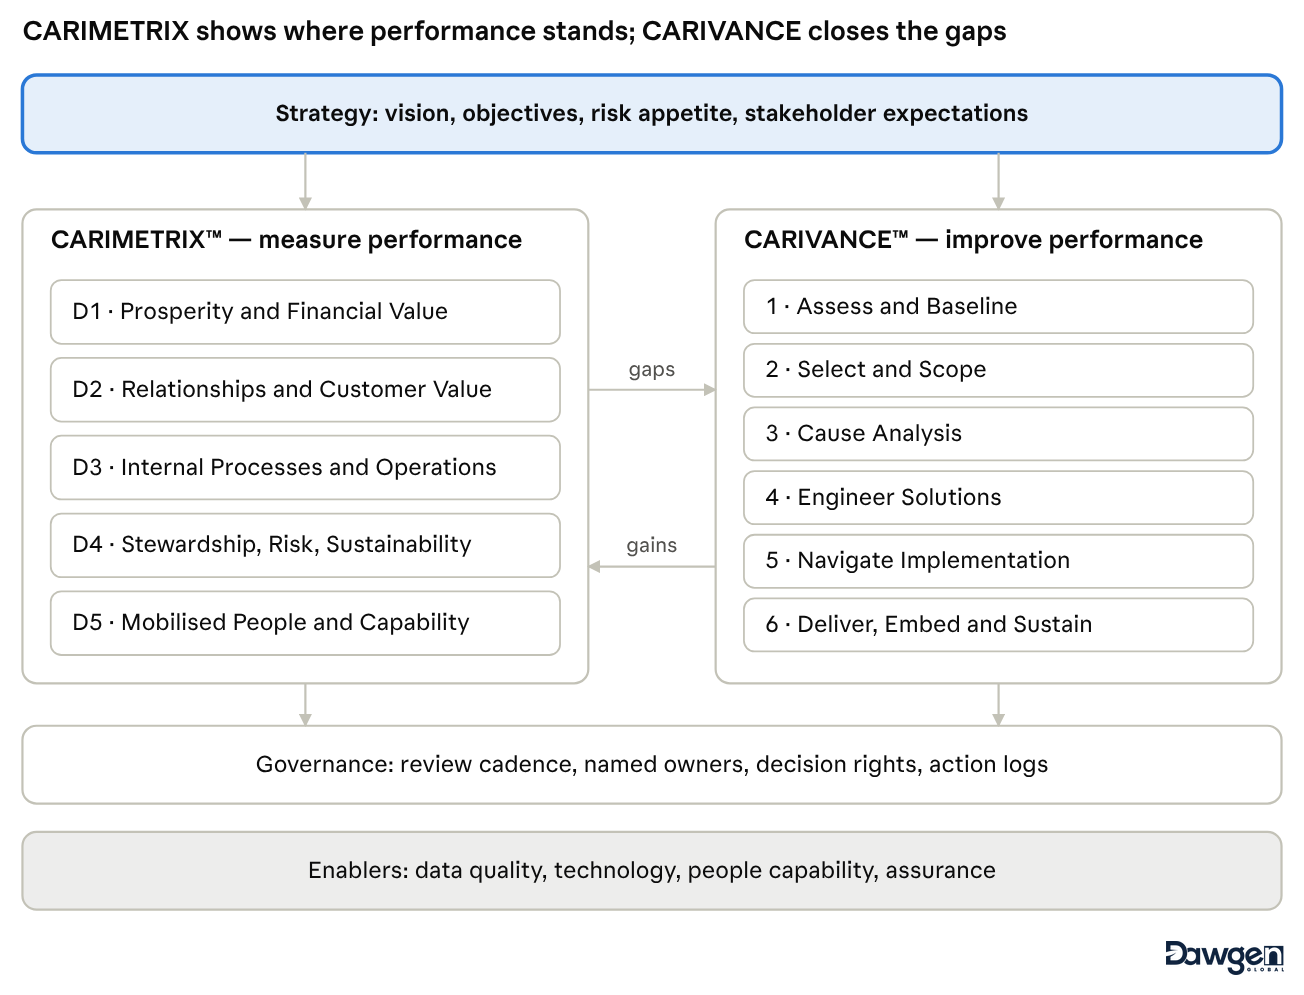
Exhibit 1 · The CARIMETRIX–CARIVANCE™ architecture
CARIMETRIX™: five dimensions of performance
| Code | Dimension | The board question it answers | Typical scorecard weight |
| D1 | Prosperity & Financial Value | Are we creating sustainable financial value? | 25–35% |
| D2 | Relationships & Customer Value | Are customers, members, citizens and partners better served? | 15–25% |
| D3 | Internal Processes & Operational Excellence | Are our processes efficient, reliable and cost-effective? | 15–25% |
| D4 | Stewardship, Risk & Sustainability | Are we well governed, compliant, resilient and responsible? | 10–20% |
| D5 | Mobilised People & Capability | Do we have the people, skills, culture and technology to deliver? | 10–20% |
The dimensions form a cause-and-effect chain read from the bottom up: capable people and systems (D5) enable excellent processes (D3) and sound stewardship (D4); these deliver valued relationships (D2), which in turn produce sustainable financial value (D1). Weights are calibrated to each organisation: a public body or charity shifts weight towards D2 and D4, while a business in turnaround shifts weight towards D1 and D3.
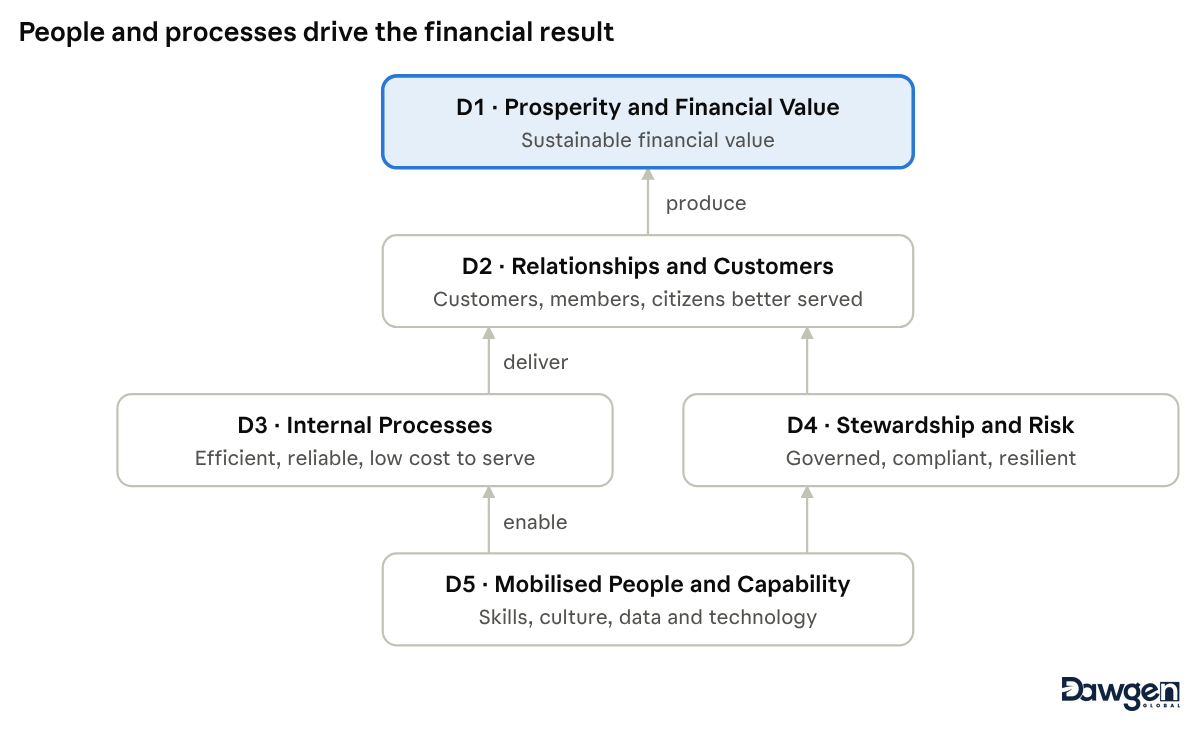
Exhibit 2 · The CARIMETRIX™ value linkage
Building the measurement system: eight steps
- M1 Mandate and strategic clarity — executive and board interviews and a health check of every existing measure.
- M2 Strategy mapping — 12–20 objectives across the five dimensions, with their cause-and-effect links.
- M3 Measure selection — candidate measures tested against seven tests: strategic, decision, controllable, measurable, understandable, timely and ungameable.
- M4 KPI definition — every key performance indicator (KPI) defined on a card recording its formula, source, owner, polarity, thresholds and a counter-measure against gaming.
- M5 Baselining and target setting — 12–36 months of history where available, and targets set by one of five documented methods: historical trend, benchmark, capability-based, strategic requirement, or stretch with a glide path.
- M6 Data and reporting architecture — data flows mapped, data quality graded from A to D, dashboards and board packs designed.
- M7 Cascade — the enterprise scorecard translated into divisional, process and team scorecards.
- M8 Governance and go-live — review cadence installed, two parallel reporting cycles run and owners trained.
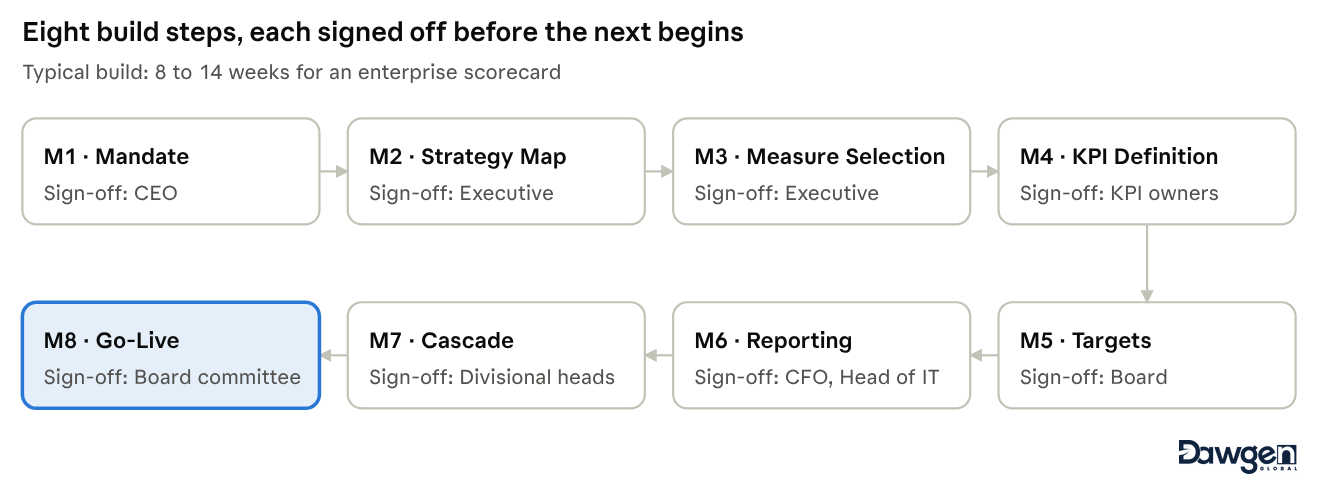
Exhibit 3 · Building the measurement system: steps M1–M8
A typical enterprise scorecard holds 15 to 25 measures. Every lagging outcome is paired with at least one leading indicator that predicts it. Each measure is scored from 0 to 100 against its thresholds: 100 at or beyond target, 50 at the edge of tolerance, and proportionally between. Scores roll up into five dimension scores and a single weighted CARIMETRIX Index, reported to the board with the trend and the data quality grade behind each figure. Grade A means system-generated, reconciled and independently reviewed; grade D means manual, unreconciled or estimated. Only grade A or B measures may drive incentive pay.
CARIVANCE™: six gated phases of improvement
| Phase | Core question | The gate that closes it |
| 1 Assess & Baseline | Where exactly are we, and how big is the gap? | Baseline agreed; value at stake quantified |
| 2 Select & Scope | Which gaps are worth closing first? | Charters signed; resources committed |
| 3 Cause Analysis | Why does the gap exist? | Root causes proven by data, not opinion |
| 4 Engineer Solutions | What will close the gap, and is it worth it? | Business case approved; benefits owner named |
| 5 Navigate Implementation | How do we deliver the change on time and on budget? | Solution live; procedures updated; owners trained |
| 6 Deliver, Embed & Sustain | Have the gains been achieved, and will they last? | Benefits verified by Finance; gains held for two cycles |
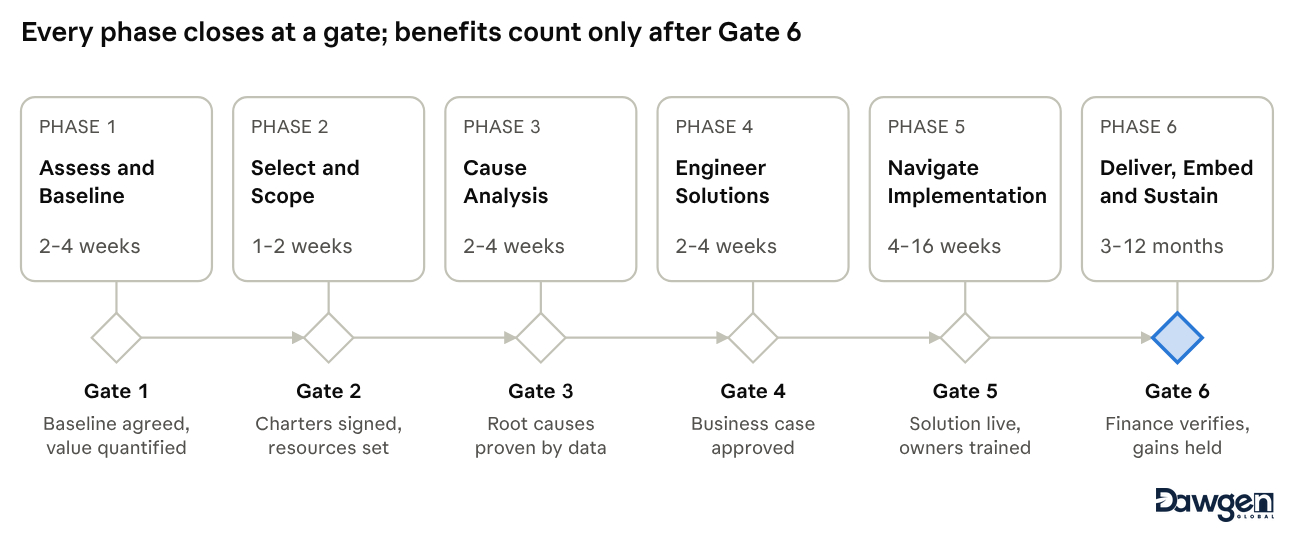
Exhibit 4 · CARIVANCE™ phases and gates
CARIVANCE draws on Lean, the Six Sigma DMAIC (Define, Measure, Analyse, Improve, Control) cycle, theory of constraints and benefits realisation management, adapted for lean Caribbean teams. Improvement runs in waves of three to seven initiatives so that projects finish. Four rules govern benefits: Finance, not the project team, signs off financial benefits; every benefit is classified as cash-releasing, non-cash or risk reduction; a single benefits register prevents double counting; and capacity freed is not counted as savings until it is redeployed or removed.
Governance, people and maturity
Five forums run on a fixed rhythm: the board or strategy committee quarterly; an executive performance review and divisional reviews monthly; a CARIVANCE steering group fortnightly during improvement waves; and team huddles daily or weekly. Every forum keeps an action log. Decision rights are explicit: a measure amber for one period requires owner action; amber for two periods or red for one requires a divisional recovery plan; red for two periods triggers an executive root cause review and becomes a candidate for CARIVANCE; a board measure red for two quarters prompts a formal board review.
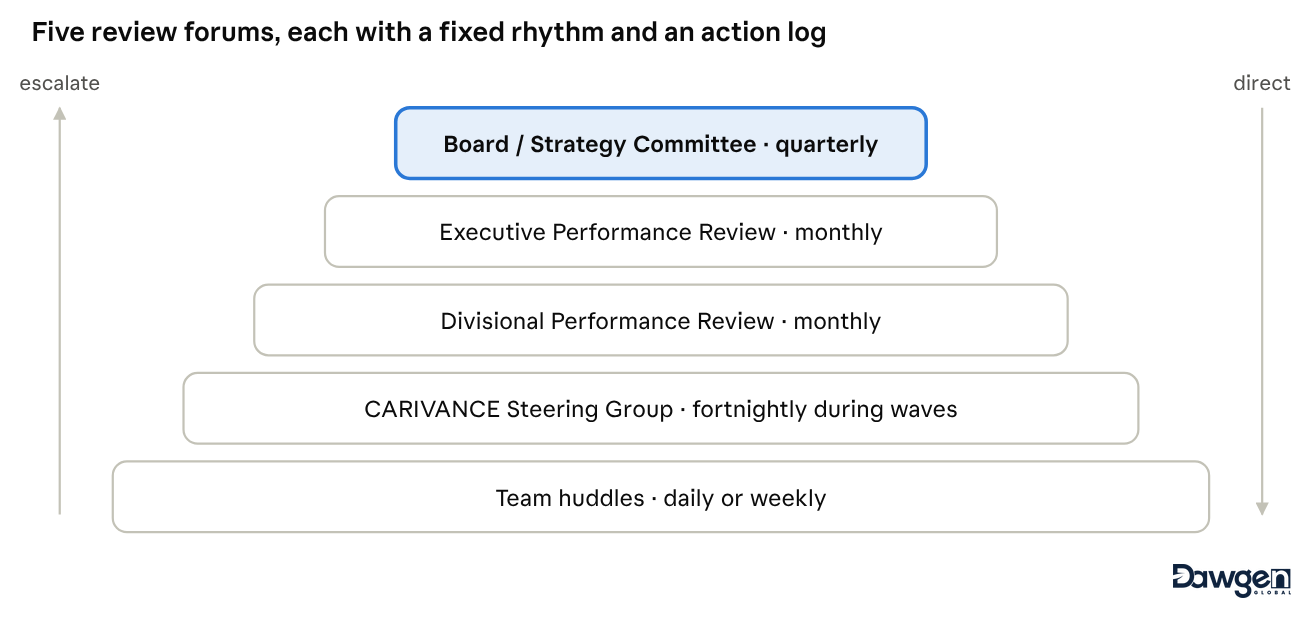
Exhibit 5 · The five review forums
The enterprise scorecard cascades to divisional scorecards, process and team boards, and individual performance agreements that typically weight shared results at 20–40%, individual results at 30–50%, improvement contribution at 10–20% and behaviours at 20–30%. Progress is tracked on a five-level maturity model (Reactive, Developing, Defined, Managed and Optimising) across eight capabilities: strategy linkage, measure design, targets, data and reporting, review and governance, improvement capability, people linkage and assurance. Most organisations begin at Level 1 or 2; a realistic aim is one to two levels within 12 to 18 months. The method is supported by a toolkit of 24 controlled templates, from the Strategic Clarity Interview Guide to the Benefits Tracker and Sustainment Audit.
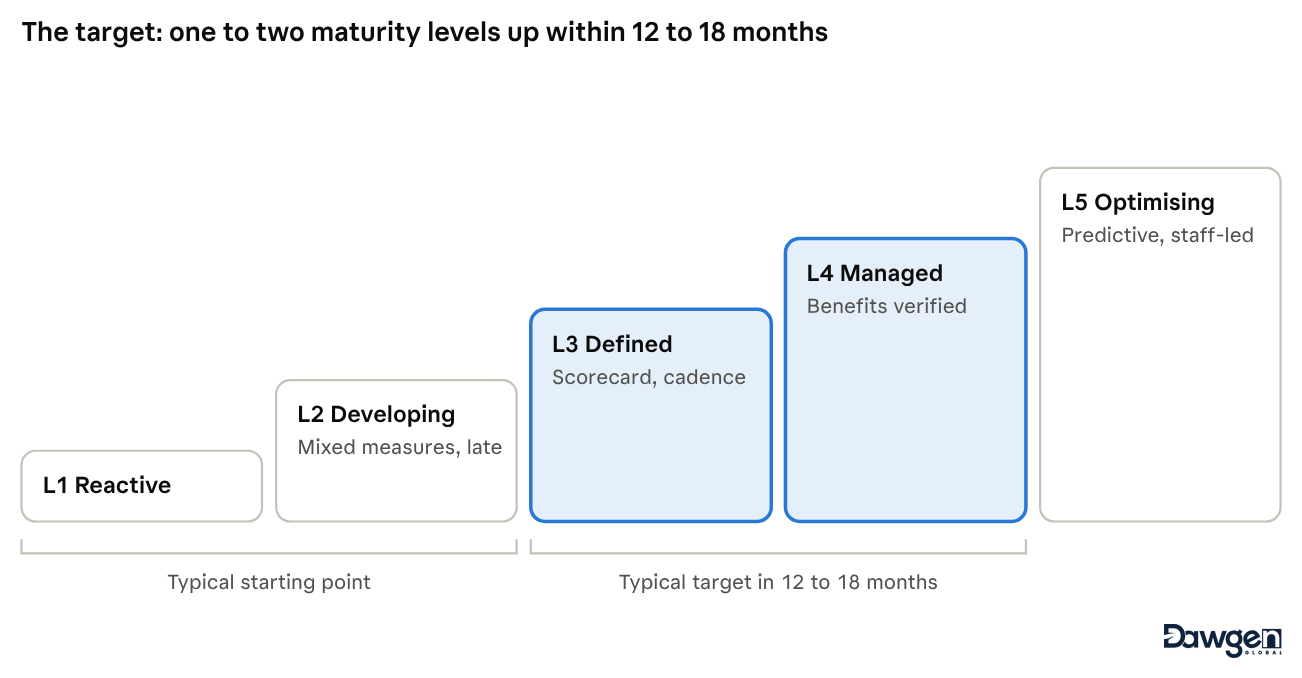
Exhibit 6 · Cascading the scorecard to individuals
Exhibit 7 · The CARIMETRIX–CARIVANCE™ maturity journey
Design principles and delivery
Six principles govern every CARIMETRIX–CARIVANCE™ engagement. Strategy comes first: every measure traces to a stated objective, and measures without an owner or a decision attached are retired. Measures are few, balanced and decision-grade. Evidence comes before action: no improvement starts without a baseline, and none closes without verified, sustained results. Ownership and cadence are fixed: named owners meet on a set rhythm to review results and commit to dated actions. The system is built for Caribbean reality: thin data, lean teams, multi-territory groups, regulatory demands and exposure to climate and economic shocks. And Dawgen Global owns delivery, then transfers capability: the firm builds the system and completes the improvement work, then trains the client’s team to run it.
Clients can engage through five service modules, individually or as an integrated programme: a Performance Diagnostic (maturity assessment, measurement health check and value-at-stake estimate); a CARIMETRIX Scorecard Build covering steps M1 to M8; a CARIVANCE Improvement Wave of three to seven initiatives taken through all six phases; Performance Reporting as a Service, delivering monthly scorecards and board packs; and Assurance over Performance Information, an independent review of KPI data, definitions and published performance statements. In an indicative integrated programme, measurement is live within about four months and the first verified gains arrive within about nine, because the first improvement wave begins while the scorecard is being finished.
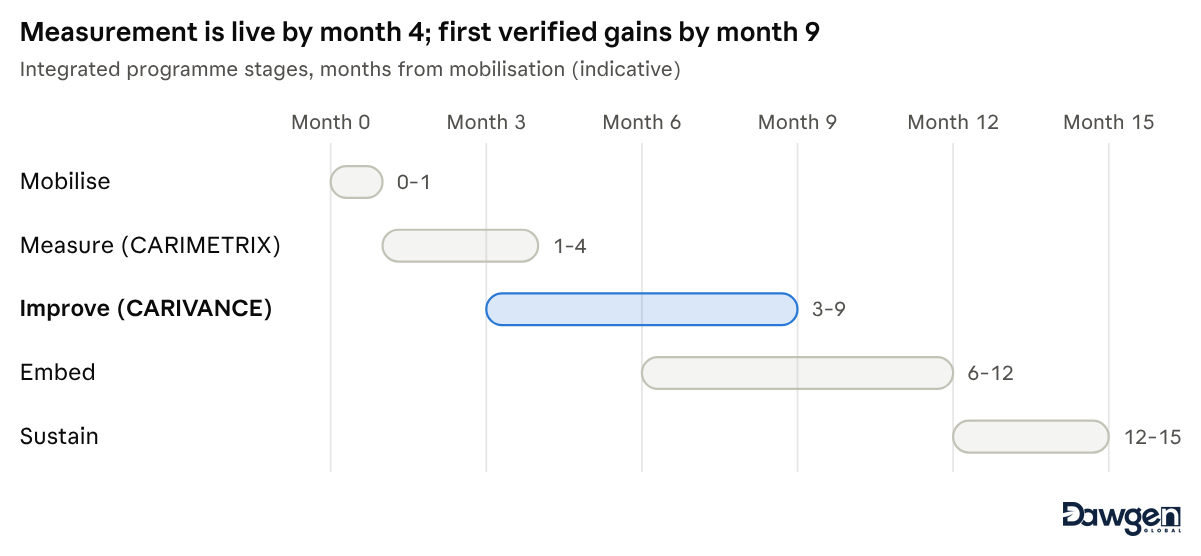
Exhibit 8 · Indicative integrated programme roadmap
Quality controls protect the result: every scorecard measure must trace to an objective; no measure goes live without an approved definition card; each KPI is reconciled to its source for at least two periods; two parallel reporting cycles run before go-live; each CARIVANCE gate is evidenced and signed by the sponsor; Finance signs off financial benefits; and a senior reviewer independent of the delivery team reviews final deliverables. These controls guard against the most common pitfalls: measuring what is easy rather than what matters, targets that drive the wrong behaviour, dashboards nobody uses, too many initiatives at once, solutions chosen before causes are proven, benefits claimed but never banked, and gains that fade once the project team leaves.
Taking the next step
If your board pack tells you what profit was but not whether it will last, the financial dimension of your performance system needs attention. Dawgen Global’s Growth & Recovery and Finance & BPO teams deliver CARIMETRIX–CARIVANCE™ engagements across the Caribbean, beginning with a Performance Diagnostic that assesses maturity, tests the health of current measures and estimates the value at stake. To discuss your organisation’s performance system, write to info@dawgen.global or visit dawgen.global.
Dawgen Global is an independent, integrated multidisciplinary professional services firm serving 35 territories across the Caribbean and the Americas, and is not affiliated with any international network. As a multidisciplinary firm, Dawgen Global offers some regulated services; in each case the head of the regulated division holds the appropriate professional practice licence in the respective jurisdiction. CARIMETRIX™ and CARIVANCE™ are proprietary frameworks
About Dawgen Global
Dawgen Global is an independent, integrated multidisciplinary professional services firm headquartered at 47 Trinidad Terrace, New Kingston, Jamaica, serving 35 territories across the Caribbean. Founded and led by Dr. Dawkins Brown, Executive Chairman, the firm is independent and not affiliated with any international network. It delivers a full suite of professional services under one roof: audit and assurance; tax advisory; IT and digital transformation; risk management; cybersecurity; actuarial and insurance regulatory advisory; HR advisory; mergers and acquisitions; corporate recovery; business advisory and strategy; accounting BPO and virtual CFO services; and legal process outsourcing.
The proposition is simple: big-firm capability without the big-firm price. Dawgen Global’s integrated approach is built for the specific complexities and opportunities of the Caribbean market, helping organizations make sharper, better-informed decisions that drive measurable progress.
To explore a partnership, reach out:
- Website: dawgen.global
- Email: info@dawgen.global
- WhatsApp (Global): +1 555-795-9071
- Caribbean offices: +1 876-665-5926 | +1 876-929-3670 | +1 876-926-5210