

Most organisations in the Caribbean measure their performance. Very few measure it in a way that changes decisions. Walk into almost any boardroom from Kingston to Port of Spain and you will find a thick monthly pack, a dashboard or two, and a calendar of reviews. What you will find far less often is a board that can say, with confidence and evidence, whether the strategy is working, where it is failing, and what will be done about it by a named person on a named date.
This gap between measuring and managing is not a matter of effort. Finance teams work late to close the month. Managers compile reports. Consultants deliver recommendations. Yet results stall, improvement projects lose momentum, and the same problems return to the agenda year after year. The issue is structural: measurement and improvement are treated as separate activities, owned by different people, run on different rhythms, and connected to strategy only loosely.
This series introduces a different approach. Dawgen Global’s CARIMETRIX–CARIVANCE™ Performance System treats measurement and improvement as one closed loop. Over twelve articles we will examine each part of that loop in depth and apply it to the sectors that carry the Caribbean economy. Each article stands on its own and sets out the full framework, because a method that can only be understood in instalments is not a method a busy board can use.
Ten ways performance systems fail
Our diagnostic work across the region points to ten recurring failure patterns. They appear in banks and credit unions, in public bodies and charities, in hotels, distributors and manufacturers. Most organisations exhibit several at once.
- The strategy says one thing; the scorecard says another. The strategic plan promises customer focus, digital transformation and resilience. The board pack remains almost entirely financial. What gets reported gets attention, so the strategy quietly becomes whatever the finance pages measure.
- Too many measures, too few decisions. Packs carry dozens of indicators, many inherited from previous executives or regulators, few retired. When everything is measured, nothing stands out, and meetings become a tour of numbers rather than a discussion of choices.
- Results arrive too late to act. Many organisations report results three to eight weeks after period end, and almost all of what they report is lagging: revenue earned, costs incurred, customers already lost. By the time the board sees a problem, the opportunity to prevent it has passed.
- Measures are not defined. Two departments report different figures for the same measure because each calculates it differently. Debates about whose number is right consume the time that should be spent on what to do.
- Data is not trusted. Figures are assembled by hand in spreadsheets, reconciled loosely or not at all, and never independently checked. Leaders sense the weakness, discount the numbers, and fall back on instinct.
- Targets have no logic. Next year’s target is last year’s actual plus a round percentage, regardless of market conditions, capacity or the investments planned. Some targets are unreachable and ignored; others are too easy and meaningless.
- Reports are circulated but not reviewed. Dashboards are emailed, filed and forgotten. There is no fixed forum where owners explain results, commit to actions and are held to them at the next meeting.
- Improvement happens by initiative. Every year brings new projects. Few are finished, fewer still deliver benefits that Finance would sign off, and almost none show up visibly in the results the board watches.
- People are measured separately from the enterprise. Individual appraisals bear little relation to the organisation’s scorecard. Staff can be rated highly while the business they serve falls short, and incentives reward activity rather than results.
- Gains fade. When improvements are achieved, they slip back within months because no one owns the process, no controls are monitored, and the project team has moved on.
Why the Caribbean pays more for these failures
These patterns are not unique to the region, but their cost is higher here. Five conditions explain why.
First, scale. Caribbean markets are small, so a single under-performing product line, branch or contract can move the results of the whole group. There is less room for error and less time to recover from it.
Second, lean teams. Few organisations can afford a dedicated strategy or performance office. Measurement therefore falls to finance teams already stretched by month-end, statutory reporting and tax compliance. Performance reporting becomes a burden to be completed rather than a tool to be used.
Third, multi-territory complexity. Groups operating across several islands face different currencies, regulators, labour markets and reporting calendars. Without a common measurement architecture, comparing a subsidiary in one territory with another becomes an exercise in reconciliation rather than insight.
Fourth, accountability demands. Regulators, exchanges, ministries, funders and lenders increasingly expect performance, governance and risk information that stands up to scrutiny. A weak performance system is no longer only a management problem; it is a governance and reputational exposure.
Fifth, shock exposure. Hurricanes, commodity price swings, tourism cycles and global financial conditions mean Caribbean organisations must measure resilience and recovery, not only growth. A scorecard that cannot show how quickly operations recover after disruption is missing one of the region’s most important truths.
What replaces a failing system
The answer is not more measures or better software. It is a system with six properties.
It starts with strategy. Every measure traces to a stated objective, and any measure without an owner or a decision attached to it is retired.
It is balanced. Financial results sit alongside the customer, process, stewardship and people drivers that produce them, so the board can see causes as well as effects.
It is decision-grade. Each measure is defined once, owned by a named person, available soon enough to act on, graded for data quality and paired with a leading indicator that warns of trouble early.
It is governed. Named owners meet on a fixed rhythm, explain results, commit to dated actions, and are held to them.
It improves, not only reports. Gaps that persist become structured improvement initiatives with proven root causes, approved business cases and benefits verified by Finance.
It sustains. Improvements are handed to process owners with control plans, and the gains are checked months later to confirm they held.
CARIMETRIX–CARIVANCE™ was built to deliver these six properties together, in a form that works for lean Caribbean teams.
The CARIMETRIX–CARIVANCE™ framework in full
Dawgen Global’s CARIMETRIX–CARIVANCE™ Performance System joins measurement and improvement in a single loop. CARIMETRIX™ shows leadership where performance stands and why it matters. CARIVANCE™ turns the gaps that CARIMETRIX reveals into funded, owned and verified improvements. A governance layer turns information into decisions, and a set of enablers (graded data, dashboards, trained owners and assurance) keeps the loop turning year after year.
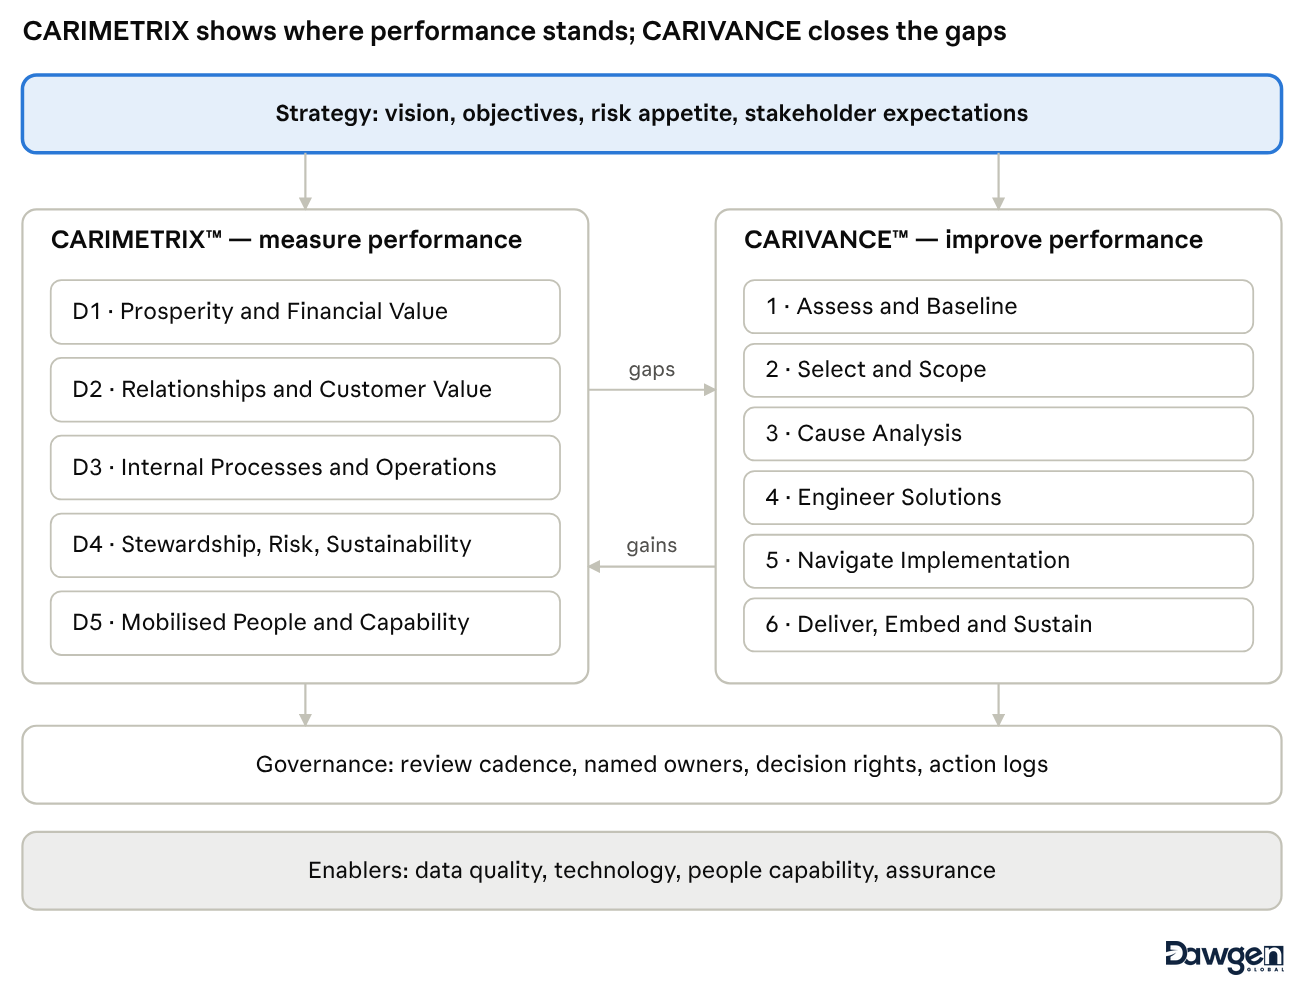
Exhibit 1 · The CARIMETRIX–CARIVANCE™ architecture
CARIMETRIX™: five dimensions of performance
| Code | Dimension | The board question it answers | Typical scorecard weight |
| D1 | Prosperity & Financial Value | Are we creating sustainable financial value? | 25–35% |
| D2 | Relationships & Customer Value | Are customers, members, citizens and partners better served? | 15–25% |
| D3 | Internal Processes & Operational Excellence | Are our processes efficient, reliable and cost-effective? | 15–25% |
| D4 | Stewardship, Risk & Sustainability | Are we well governed, compliant, resilient and responsible? | 10–20% |
| D5 | Mobilised People & Capability | Do we have the people, skills, culture and technology to deliver? | 10–20% |
The dimensions form a cause-and-effect chain read from the bottom up: capable people and systems (D5) enable excellent processes (D3) and sound stewardship (D4); these deliver valued relationships (D2), which in turn produce sustainable financial value (D1). Weights are calibrated to each organisation: a public body or charity shifts weight towards D2 and D4, while a business in turnaround shifts weight towards D1 and D3.
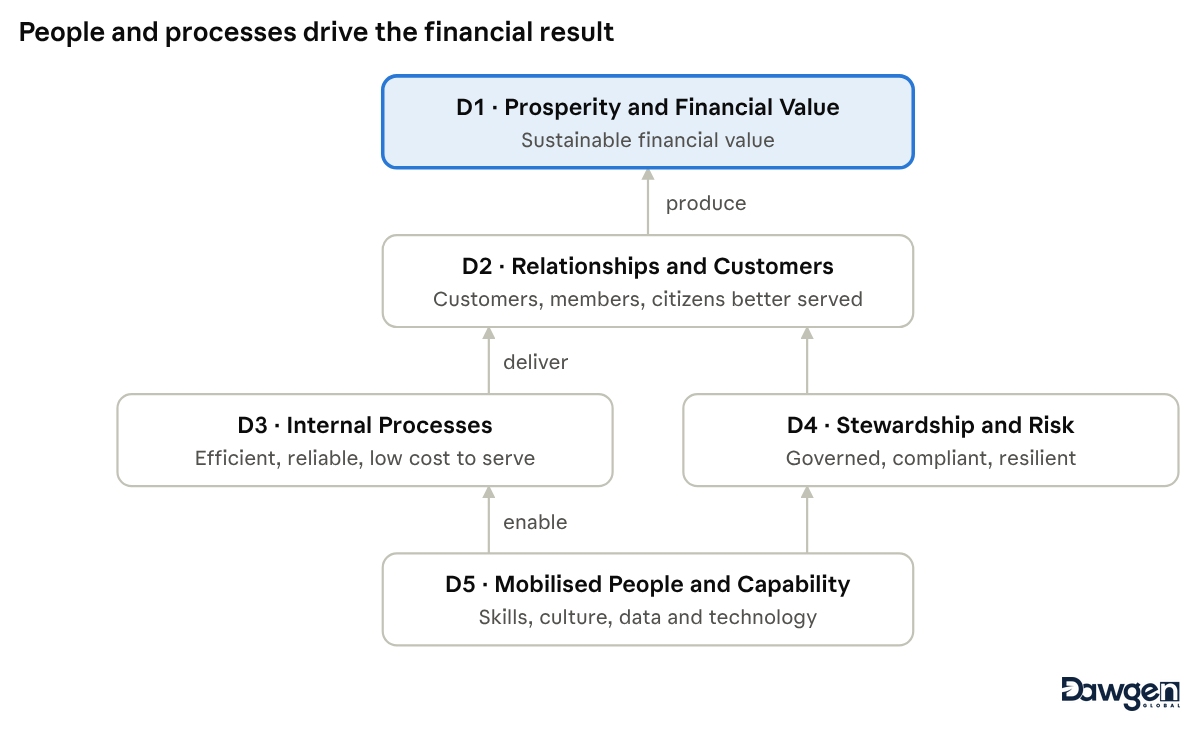
Exhibit 2 · The CARIMETRIX™ value linkage
Building the measurement system: eight steps
- M1 Mandate and strategic clarity — executive and board interviews and a health check of every existing measure.
- M2 Strategy mapping — 12–20 objectives across the five dimensions, with their cause-and-effect links.
- M3 Measure selection — candidate measures tested against seven tests: strategic, decision, controllable, measurable, understandable, timely and ungameable.
- M4 KPI definition — every key performance indicator (KPI) defined on a card recording its formula, source, owner, polarity, thresholds and a counter-measure against gaming.
- M5 Baselining and target setting — 12–36 months of history where available, and targets set by one of five documented methods: historical trend, benchmark, capability-based, strategic requirement, or stretch with a glide path.
- M6 Data and reporting architecture — data flows mapped, data quality graded from A to D, dashboards and board packs designed.
- M7 Cascade — the enterprise scorecard translated into divisional, process and team scorecards.
- M8 Governance and go-live — review cadence installed, two parallel reporting cycles run and owners trained.
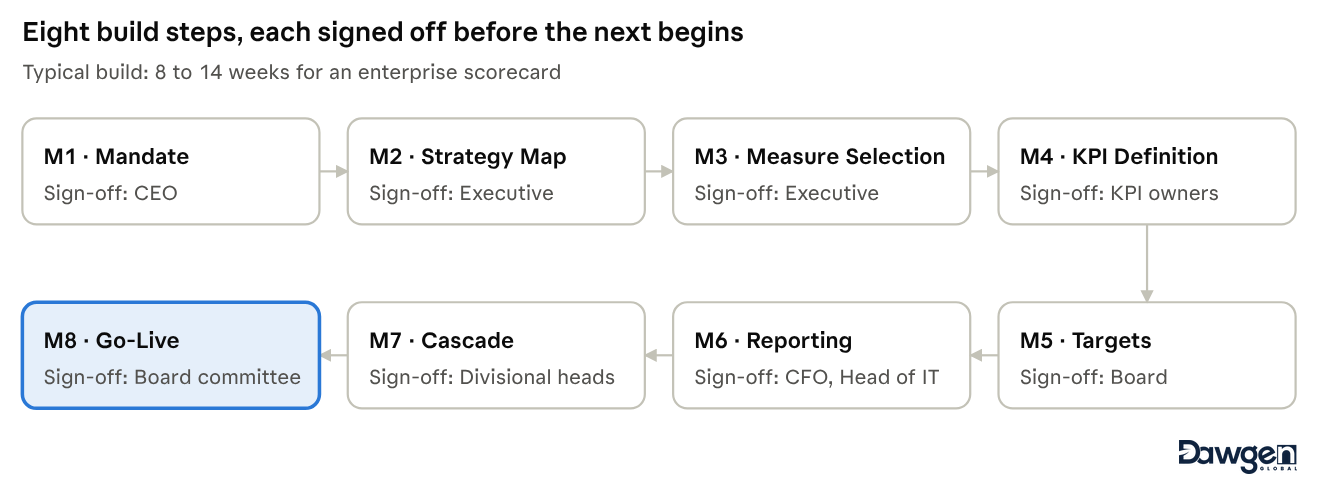
Exhibit 3 · Building the measurement system: steps M1–M8
A typical enterprise scorecard holds 15 to 25 measures. Every lagging outcome is paired with at least one leading indicator that predicts it. Each measure is scored from 0 to 100 against its thresholds: 100 at or beyond target, 50 at the edge of tolerance, and proportionally between. Scores roll up into five dimension scores and a single weighted CARIMETRIX Index, reported to the board with the trend and the data quality grade behind each figure. Grade A means system-generated, reconciled and independently reviewed; grade D means manual, unreconciled or estimated. Only grade A or B measures may drive incentive pay.
CARIVANCE™: six gated phases of improvement
| Phase | Core question | The gate that closes it |
| 1 Assess & Baseline | Where exactly are we, and how big is the gap? | Baseline agreed; value at stake quantified |
| 2 Select & Scope | Which gaps are worth closing first? | Charters signed; resources committed |
| 3 Cause Analysis | Why does the gap exist? | Root causes proven by data, not opinion |
| 4 Engineer Solutions | What will close the gap, and is it worth it? | Business case approved; benefits owner named |
| 5 Navigate Implementation | How do we deliver the change on time and on budget? | Solution live; procedures updated; owners trained |
| 6 Deliver, Embed & Sustain | Have the gains been achieved, and will they last? | Benefits verified by Finance; gains held for two cycles |
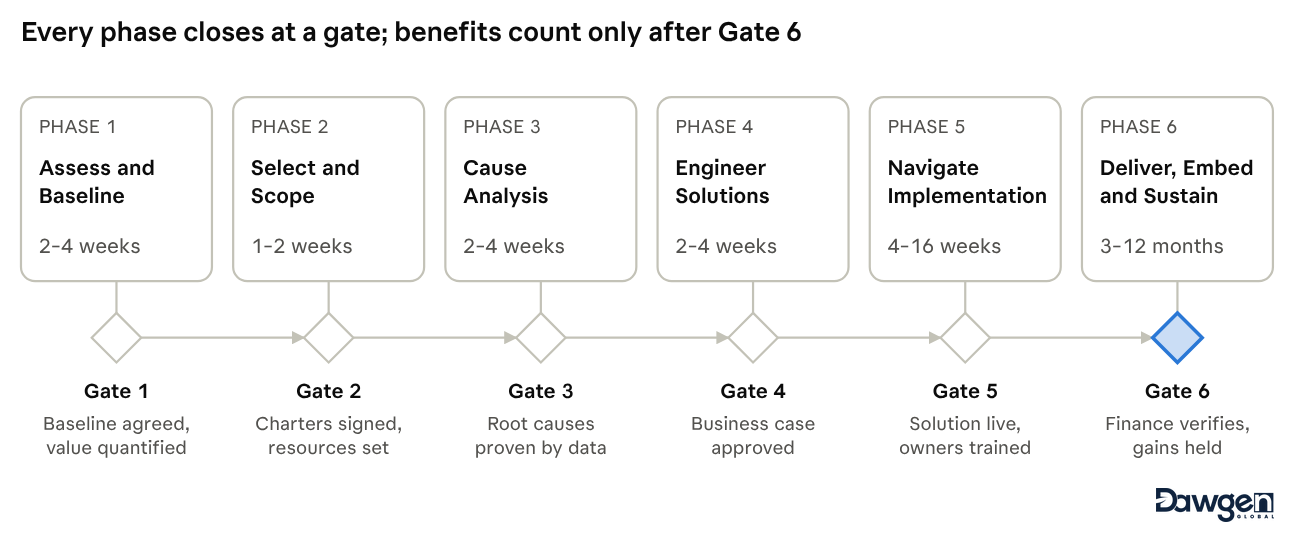
Exhibit 4 · CARIVANCE™ phases and gates
CARIVANCE draws on Lean, the Six Sigma DMAIC (Define, Measure, Analyse, Improve, Control) cycle, theory of constraints and benefits realisation management, adapted for lean Caribbean teams. Improvement runs in waves of three to seven initiatives so that projects finish. Four rules govern benefits: Finance, not the project team, signs off financial benefits; every benefit is classified as cash-releasing, non-cash or risk reduction; a single benefits register prevents double counting; and capacity freed is not counted as savings until it is redeployed or removed.
Governance, people and maturity
Five forums run on a fixed rhythm: the board or strategy committee quarterly; an executive performance review and divisional reviews monthly; a CARIVANCE steering group fortnightly during improvement waves; and team huddles daily or weekly. Every forum keeps an action log. Decision rights are explicit: a measure amber for one period requires owner action; amber for two periods or red for one requires a divisional recovery plan; red for two periods triggers an executive root cause review and becomes a candidate for CARIVANCE; a board measure red for two quarters prompts a formal board review.
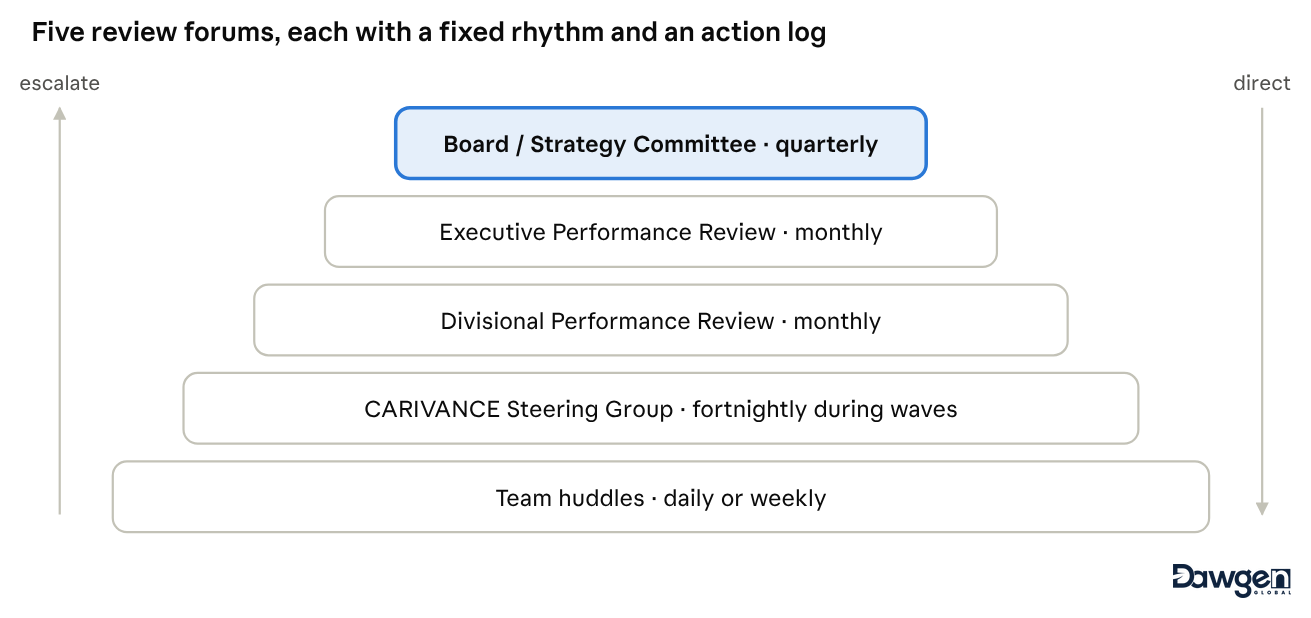
Exhibit 5 · The five review forums
The enterprise scorecard cascades to divisional scorecards, process and team boards, and individual performance agreements that typically weight shared results at 20–40%, individual results at 30–50%, improvement contribution at 10–20% and behaviours at 20–30%. Progress is tracked on a five-level maturity model (Reactive, Developing, Defined, Managed and Optimising) across eight capabilities: strategy linkage, measure design, targets, data and reporting, review and governance, improvement capability, people linkage and assurance. Most organisations begin at Level 1 or 2; a realistic aim is one to two levels within 12 to 18 months. The method is supported by a toolkit of 24 controlled templates, from the Strategic Clarity Interview Guide to the Benefits Tracker and Sustainment Audit.
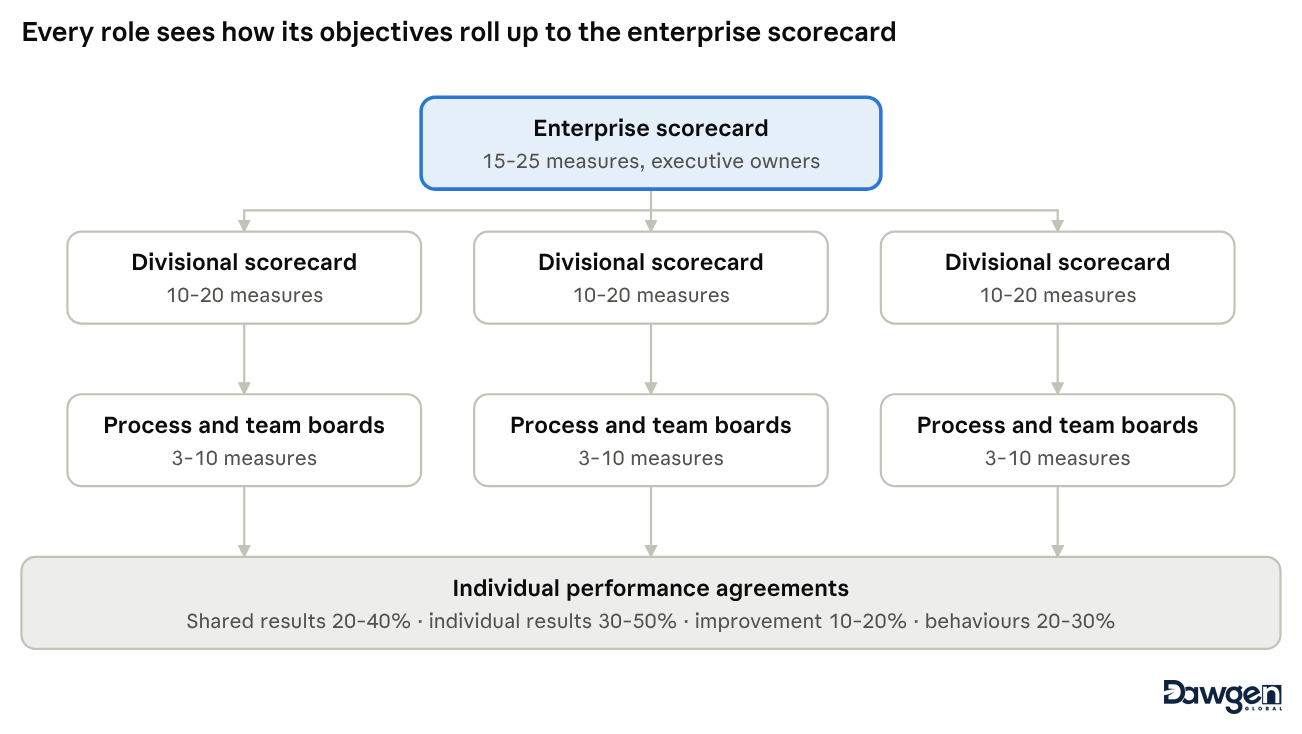
Exhibit 6 · Cascading the scorecard to individuals
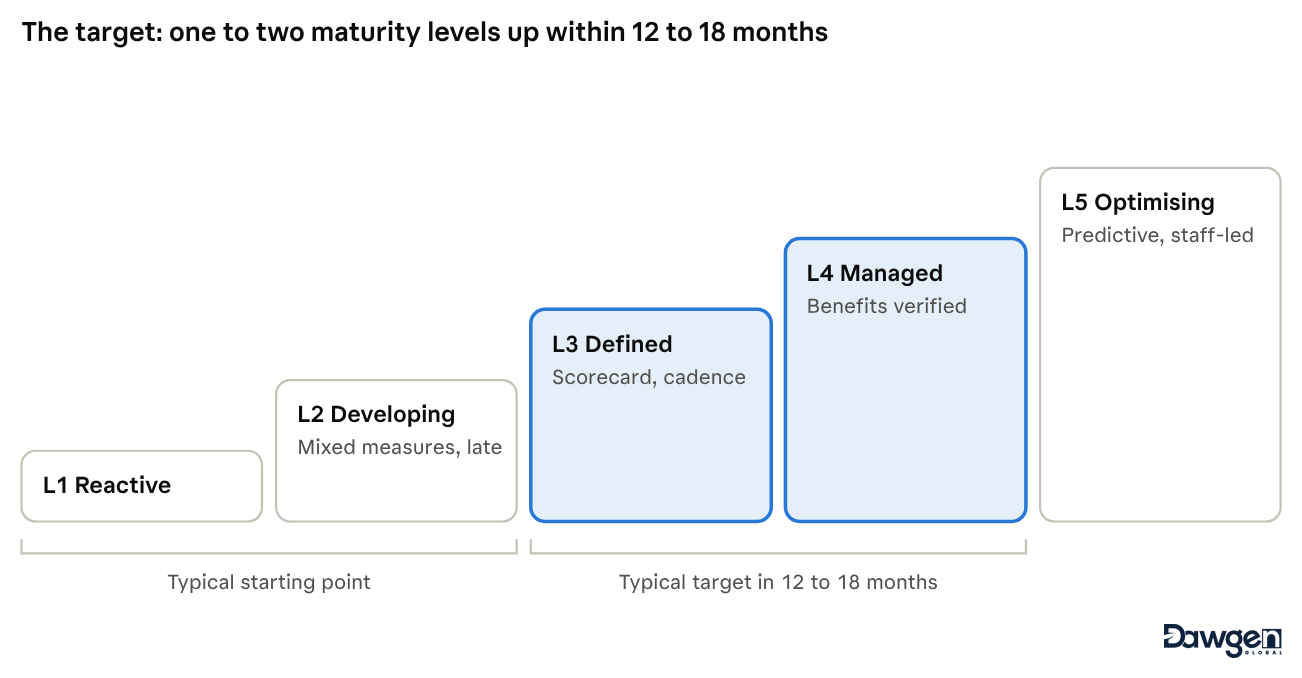
Exhibit 7 · The CARIMETRIX–CARIVANCE™ maturity journey
Design principles and delivery
Six principles govern every CARIMETRIX–CARIVANCE™ engagement. Strategy comes first: every measure traces to a stated objective, and measures without an owner or a decision attached are retired. Measures are few, balanced and decision-grade. Evidence comes before action: no improvement starts without a baseline, and none closes without verified, sustained results. Ownership and cadence are fixed: named owners meet on a set rhythm to review results and commit to dated actions. The system is built for Caribbean reality: thin data, lean teams, multi-territory groups, regulatory demands and exposure to climate and economic shocks. And Dawgen Global owns delivery, then transfers capability: the firm builds the system and completes the improvement work, then trains the client’s team to run it.
Clients can engage through five service modules, individually or as an integrated programme: a Performance Diagnostic (maturity assessment, measurement health check and value-at-stake estimate); a CARIMETRIX Scorecard Build covering steps M1 to M8; a CARIVANCE Improvement Wave of three to seven initiatives taken through all six phases; Performance Reporting as a Service, delivering monthly scorecards and board packs; and Assurance over Performance Information, an independent review of KPI data, definitions and published performance statements. In an indicative integrated programme, measurement is live within about four months and the first verified gains arrive within about nine, because the first improvement wave begins while the scorecard is being finished.
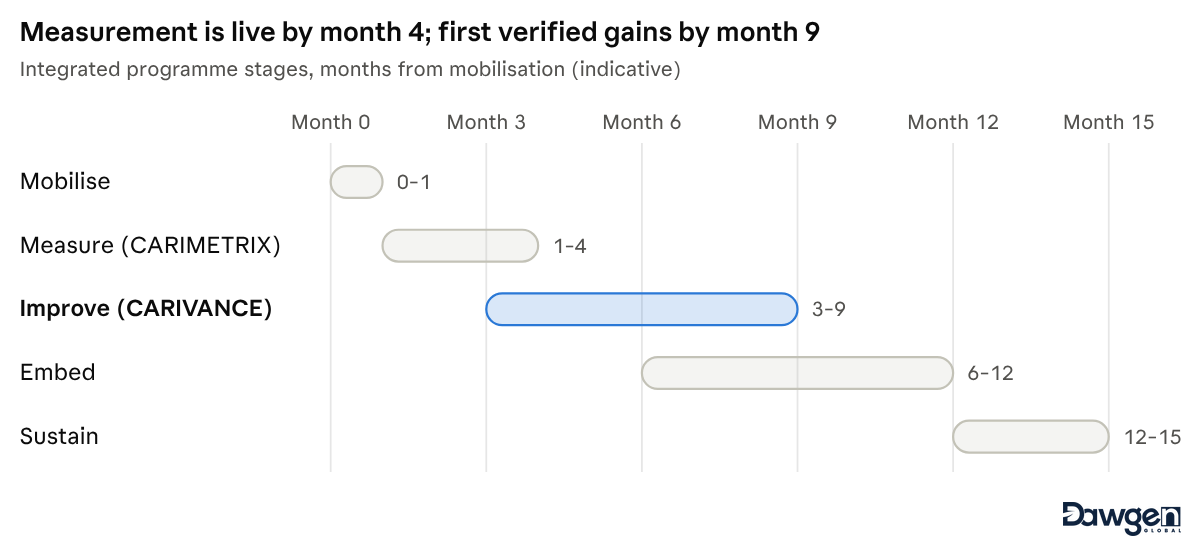
Exhibit 8 · Indicative integrated programme roadmap
Quality controls protect the result: every scorecard measure must trace to an objective; no measure goes live without an approved definition card; each KPI is reconciled to its source for at least two periods; two parallel reporting cycles run before go-live; each CARIVANCE gate is evidenced and signed by the sponsor; Finance signs off financial benefits; and a senior reviewer independent of the delivery team reviews final deliverables. These controls guard against the most common pitfalls: measuring what is easy rather than what matters, targets that drive the wrong behaviour, dashboards nobody uses, too many initiatives at once, solutions chosen before causes are proven, benefits claimed but never banked, and gains that fade once the project team leaves.
Where to begin
The temptation, once a board recognises these failure patterns, is to launch a dashboard project or buy a performance software licence. Both can help later; neither is the right first step. The right first step is a candid diagnosis.
That diagnosis asks four questions. Can the board name the three outcomes the strategy commits to, and does the current pack measure them? Which existing measures would anyone notice if they disappeared tomorrow? Where are the largest gaps between performance and potential, and what are they worth in money terms? And which of the ten failure patterns are present?
The answers usually reveal that the organisation needs fewer measures, better defined; a much shorter path from data to decision; and a disciplined way to convert persistent gaps into finished improvements. They also reveal value: in almost every diagnosis, the cost of the gaps far exceeds the cost of closing them.
The remaining eleven articles in this series take each part of the system in turn. Articles two to six examine the five CARIMETRIX dimensions. Article seven sets out the CARIVANCE improvement method. Article eight covers governance, the link to people and the maturity journey. Articles nine to twelve apply the whole system to banking and credit unions, public bodies, tourism and hospitality, and distribution, retail and manufacturing.
Taking the next step
A performance system should help leaders decide, not only describe what has already happened. Dawgen Global’s Growth & Recovery and Finance & BPO teams deliver CARIMETRIX–CARIVANCE™ engagements across the Caribbean, beginning with a Performance Diagnostic that assesses maturity, tests the health of current measures and estimates the value at stake. To discuss your organisation’s performance system, write to info@dawgen.global or visit dawgen.global.
Dawgen Global is an independent, integrated multidisciplinary professional services firm serving 35 territories across the Caribbean and the Americas, and is not affiliated with any international network. As a multidisciplinary firm, Dawgen Global offers some regulated services; in each case the head of the regulated division holds the appropriate professional practice licence in the respective jurisdiction. CARIMETRIX-CARIVANCE are proprietary frameworks of Dawgen Global.
About Dawgen Global
Dawgen Global is an independent, integrated multidisciplinary professional services firm headquartered at 47 Trinidad Terrace, New Kingston, Jamaica, serving 35 territories across the Caribbean. Founded and led by Dr. Dawkins Brown, Executive Chairman, the firm is independent and not affiliated with any international network. It delivers a full suite of professional services under one roof: audit and assurance; tax advisory; IT and digital transformation; risk management; cybersecurity; actuarial and insurance regulatory advisory; HR advisory; mergers and acquisitions; corporate recovery; business advisory and strategy; accounting BPO and virtual CFO services; and legal process outsourcing.
The proposition is simple: big-firm capability without the big-firm price. Dawgen Global’s integrated approach is built for the specific complexities and opportunities of the Caribbean market, helping organizations make sharper, better-informed decisions that drive measurable progress.
To explore a partnership, reach out:
- Website: dawgen.global
- Email: info@dawgen.global
- WhatsApp (Global): +1 555-795-9071
- Caribbean offices: +1 876-665-5926 | +1 876-929-3670 | +1 876-926-5210