![]()
Theory Meets Reality
For the past seven articles, we have built the intellectual architecture of the WC-PULSE Framework™ piece by piece. The five diagnostic layers. The Trigger Zone Matrix. The predictive P-Layer. The ecosystem S-Layer. The governance model. The repricing playbook. The macro E-Layer. Each article has presented concepts, methodologies, and quantified examples.
This article is different. This is a case study. It is the story of a real engagement – names, geographies, and identifying details changed to protect client confidentiality – that demonstrates what happens when the WC-PULSE Framework moves from theory to practice. It is the story of a company we will call Caribbean Industrial Holdings, a multi-division manufacturing and distribution group that implemented the full PULSE Framework in 90 days and, in the process, released US$12 million in trapped working capital and shortened its Cash Conversion Cycle by 14 days.
This is not a success story told in hindsight with the rough edges polished away. It includes the obstacles, the surprises, the moments when progress stalled, and the decisions that made the difference between a framework on paper and a capability in practice. Because the value of a case study is not in the outcome – it is in the journey.
The Starting Point: A Company That Looked Fine on Paper
Caribbean Industrial Holdings was, by any conventional measure, a well-managed company. Annual revenue of US$185 million across three operating divisions: industrial manufacturing, consumer goods, and wholesale distribution. EBITDA margins of 14 per cent. A current ratio of 1.7. A Cash Conversion Cycle of 56 days. The board was satisfied. The banks were comfortable. The CFO, a seasoned professional with two decades of experience, described the working-capital position as “adequate.”
The engagement began not because of a crisis but because the CEO had read Article 1 of this series and recognised the description of the CCC’s blind spots in her own organisation. She contacted Dawgen Global with a deceptively simple question: “We think we’re fine. Are we?”
The answer, as the PULSE Diagnostic would reveal, was no. The company was not fine. It was in the Amber Zone with two layers trending towards Red, sitting on US$12 million in trapped working capital that no one had identified because no one had the framework to see it.
Phase 1: The PULSE Diagnostic (Weeks 1–2)
The first two weeks were devoted to the PULSE Diagnostic – a rapid, data-intensive assessment that maps all five framework layers to the client’s actual data ecosystem and produces a Baseline PULSE Scorecard.
The Data Assembly
The Dawgen Global team extracted 18 months of transactional data from the company’s ERP system, banking platforms, and accounts-receivable and accounts-payable subledgers. This data was normalised, cleaned, and fed into the PULSE scoring engine. The process revealed the first surprise: approximately 15 per cent of the company’s receivables data was inconsistent between the ERP and the banking records, creating phantom transactions that had been inflating the reported collections figures for months. This data-hygiene issue, invisible to the finance team because they had never reconciled at the granular level the PULSE Diagnostic requires, was immediately flagged for remediation.
The Baseline Scorecard
The PULSE Baseline Scorecard revealed a very different picture from the one the board had been seeing:
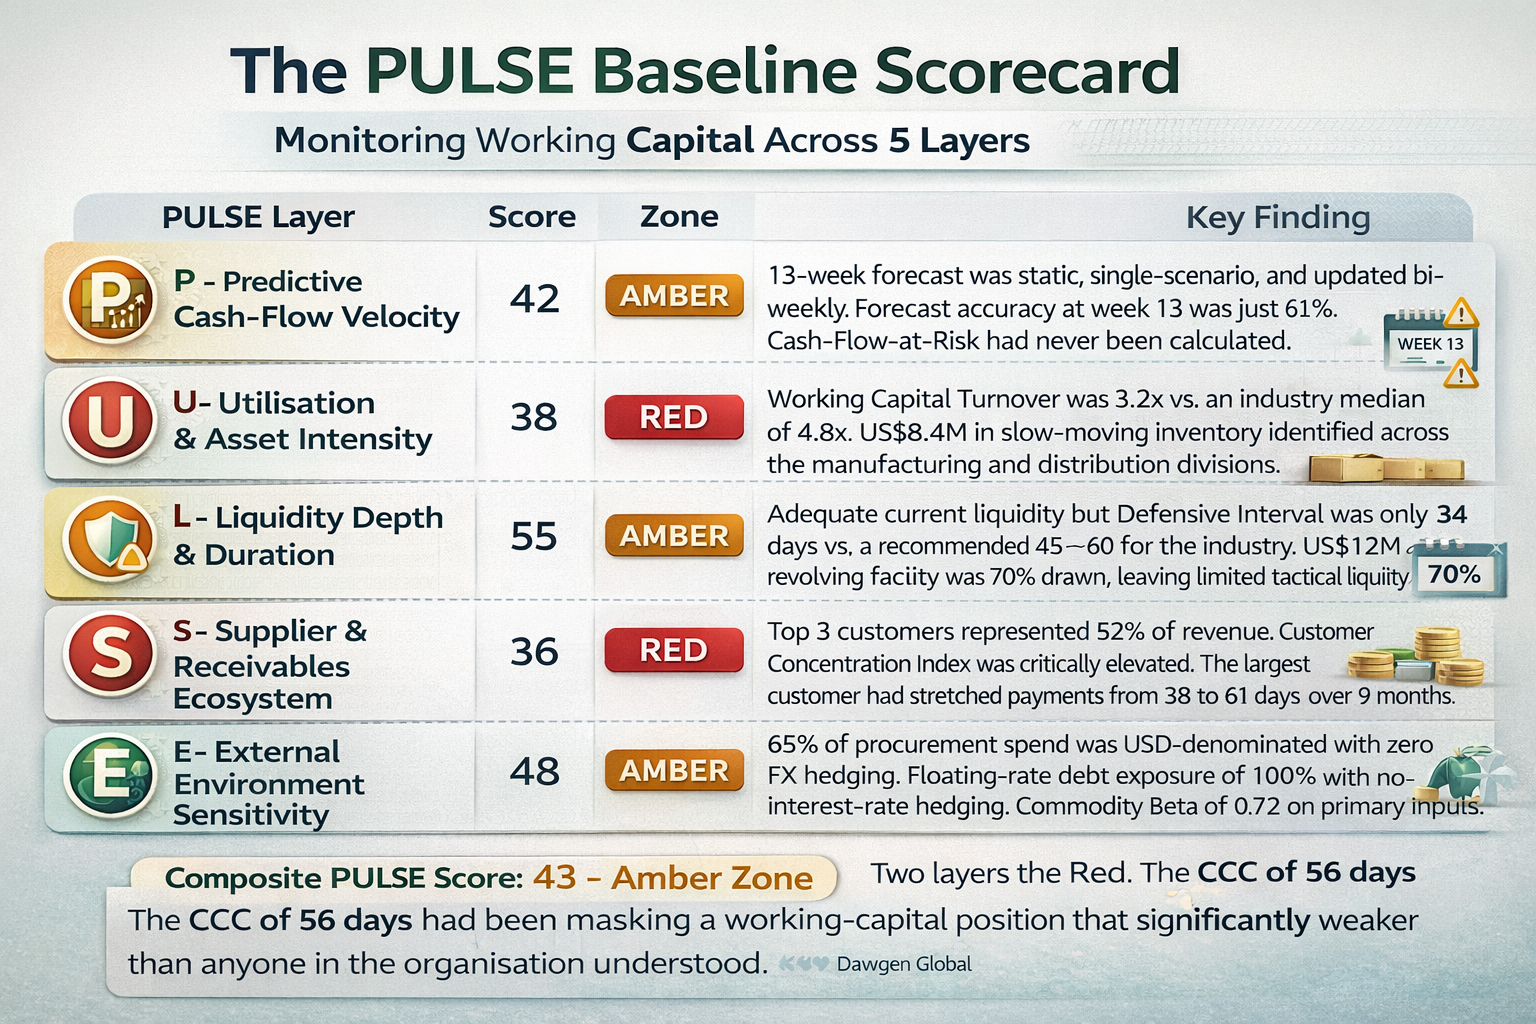
| PULSE Layer | Score | Zone | Key Finding |
| P – Predictive Cash-Flow Velocity | 42 | AMBER | 13-week forecast was static, single-scenario, and updated bi-weekly. Forecast accuracy at week 13 was just 61%. Cash-Flow-at-Risk had never been calculated. |
| U – Utilisation & Asset Intensity | 38 | RED | Working Capital Turnover was 3.2x vs. an industry median of 4.8x. US$8.4M in slow-moving inventory identified across the manufacturing and distribution divisions. Return on Net Operating Assets was 340bps below peer median. |
| L – Liquidity Depth & Duration | 55 | AMBER | Adequate current liquidity but Defensive Interval was only 34 days vs. a recommended 45–60 for the industry. US$12M revolving facility was 70% drawn, leaving limited tactical liquidity. |
| S – Supplier & Receivables Ecosystem | 36 | RED | Top 3 customers represented 52% of revenue. Customer Concentration Index was critically elevated. The largest customer had stretched payments from 38 to 61 days over 9 months without triggering any alert. Supplier Concentration Index: top supplier provided 44% of primary packaging material. |
| E – External Environment Sensitivity | 48 | AMBER | 65% of procurement spend was USD-denominated with zero FX hedging. Floating-rate debt exposure of 100% with no interest-rate hedging. Commodity Beta of 0.72 on primary inputs. |
Composite PULSE Score: 43 – Amber Zone. Two layers in the Red. The CCC of 56 days had been masking a working-capital position that was significantly weaker than anyone in the organisation understood.
The CFO’s reaction when she saw the Baseline Scorecard: “We’ve been reporting to the board that working capital is under control. This tells me we’ve been looking at the wrong dashboard.”
Phase 2: Trigger Calibration (Weeks 3–4)
With the baseline established, the Dawgen Global team worked with the CFO, Treasurer, and divisional finance heads to calibrate the Trigger Zone Matrix to Caribbean Industrial Holdings’ specific risk profile.
The calibration process produced several critical decisions. The default PULSE layer weights were adjusted: the S-Layer was elevated from 20 to 25 per cent given the extreme customer and supplier concentration, and the E-Layer was elevated from 10 to 15 per cent given the unhedged FX and rate exposure. The U-Layer and P-Layer were correspondingly reduced by 5 per cent each.
Zone thresholds were refined. The Red Zone boundary was set at 38 rather than the default 39, reflecting the company’s relatively strong liquidity position despite the other weaknesses. Emergency Red Overrides were calibrated: a payment delay of more than 15 days by either of the top two customers, or a JMD depreciation exceeding 8 per cent in any 30-day window, would trigger immediate Red Zone protocols regardless of the composite score.
The output of Phase 2 was the Calibrated Trigger Zone Matrix, an Escalation Playbook specifying the RACI assignments for every trigger signal, and the design specification for the PULSE Dashboard that would be built in Phase 3.
Phase 3: Dashboard and Automation (Weeks 5–8)
Phase 3 was the most technically intensive period. The Dawgen Global analytics team built the PULSE Dashboard on the company’s existing Power BI platform, integrating live data feeds from three sources: the SAP ERP system (for receivables, payables, inventory, and general-ledger data), the company’s primary banking platform (for cash balances, facility utilisation, and transaction flows), and a market-data feed (for exchange rates, benchmark interest rates, and commodity indices).
The integration uncovered the second major obstacle of the engagement: the SAP system’s accounts-payable module was recording supplier invoices at the date of receipt rather than the date of goods delivery, creating a systematic 5-to-8-day distortion in the DPO calculation. This meant the company had been reporting a DPO of 42 days when the economic reality was closer to 35 days – a discrepancy that had been flattering the CCC by nearly a week. The data-correction exercise required collaboration between the IT team, the procurement department, and the finance function, and took ten days to resolve completely.
By the end of week eight, the live PULSE Dashboard was operational. For the first time, the CFO could see all five layer scores updating weekly, the composite PULSE Score with trend indicators, the 13-week rolling forecast with three scenarios, and the automated trigger alerts that would fire when any metric breached its calibrated threshold. The dashboard was not a reporting tool. It was a decision engine.
Phase 4: Embed and Sustain (Weeks 9–12)
The final phase focused on embedding the framework into the organisation’s operating rhythm and transferring full ownership to the internal team. This phase contained the highest-impact actions of the entire engagement, because the framework’s value is not in its architecture but in the decisions it drives.
The Quick Wins
Armed with the Baseline Scorecard and the live Dashboard, the Working Capital Council – established in week four as part of the governance model design – authorised three immediate interventions:
- Customer Collections Campaign: The S-Layer data revealed that the top customer’s payment drift from 38 to 61 days represented US$3.2 million in trapped receivables. The VP of Sales, now a Council member with visibility into the DSO impact, personally engaged the customer’s CFO. The outcome was a structured payment plan that brought the account current within six weeks, releasing US$2.8 million in cash. Critically, this conversation happened because the Dashboard made the cost visible to Sales, not just to Treasury.
- Inventory Right-Sizing: The U-Layer’s identification of US$8.4 million in slow-moving inventory triggered a divisional review. The manufacturing division discovered that US$3.1 million in raw materials had been over-ordered 14 months earlier to capture a bulk discount – a procurement decision that had never been assessed for its working-capital carrying cost. The distribution division identified US$2.3 million in finished goods with declining sell-through rates that were consuming warehouse space and insurance cost. A targeted liquidation programme was launched, releasing US$4.8 million over eight weeks through a combination of discounted sales, supplier returns, and production-schedule adjustments.
- FX Hedging Programme: The E-Layer’s finding that 65 per cent of procurement spend was USD-denominated with zero hedging led to the immediate implementation of a rolling three-month forward-contract programme covering 50 per cent of the anticipated USD exposure. This did not release working capital directly, but it reduced the Cash-Flow-at-Risk metric by 18 per cent, improving the P-Layer score and contributing to the composite PULSE Score improvement.
The Structural Changes
Beyond the quick wins, Phase 4 embedded three structural changes that would sustain the working-capital improvement:
- Weekly PULSE Review: Every Monday morning at 8:30, the Treasurer reviewed the updated Dashboard and prepared a five-minute briefing for the CFO highlighting any trigger signals, score movements, or forecast changes. This 30-minute weekly cadence replaced the previous bi-weekly, manually assembled cash-flow update and provided superior visibility with less effort.
- Monthly Council Meeting: The Working Capital Council met on the first Wednesday of each month for 45 minutes. The agenda followed the structured format described in Article 5: Score Review, Layer Exceptions, Decision Impact, and Forward Look. Within two months, the Council had reviewed and modified three commercial proposals that would have extended payment terms beyond policy, and approved two capex timing adjustments that improved cash-flow alignment with the 13-week forecast.
- Quarterly Recalibration: Every 90 days, the Dawgen Global team conducted a remote recalibration session to review the PULSE layer weights, zone thresholds, and trigger parameters, adjusting them based on observed performance and any changes in the business environment. This ensured that the framework evolved with the organisation rather than becoming a static tool.
The Results: 90 Days Later
Twelve weeks after the engagement began, Caribbean Industrial Holdings had achieved a measurable transformation in its working-capital position. The results were presented to the board at the quarterly review, using the PULSE Dashboard as the reporting format for the first time.
| Metric | Day 1 | Day 90 | Change |
| Composite PULSE Score | 43 (Amber) | 64 (Amber-High) | +21 points |
| Cash Conversion Cycle | 56 days | 42 days | -14 days |
| Working Capital Released | — | US$12.1M | US$12.1M |
| DSO | 58 days | 47 days | -11 days |
| DIO | 41 days | 33 days | -8 days |
| Revolving Facility Utilisation | 70% | 42% | -28pp |
| 13-Week Forecast Accuracy | 61% | 84% | +23pp |
| Annualised Interest Savings | — | US$420K | US$420K/yr |
| PULSE Layers in Red Zone | 2 | 0 | -2 layers |
The US$12.1 million in released working capital came from three sources: US$4.8 million from inventory right-sizing, US$4.5 million from receivables acceleration (the collections campaign plus improved credit-term governance), and US$2.8 million from payables optimisation through a new dynamic-discounting programme that also captured US$180,000 in annualised supplier discounts. The revolving facility drawdown declined from 70 to 42 per cent, reducing annual interest expense by US$420,000 and restoring US$3.4 million in available tactical liquidity.
Lessons from the Transformation
Every PULSE implementation teaches us something. Caribbean Industrial Holdings confirmed five lessons that we have seen in engagement after engagement:
- The data is the hardest part: The most time-consuming element of the implementation was not building the framework or designing the governance model. It was cleaning, reconciling, and integrating the data. The 15 per cent receivables inconsistency and the payables-dating error consumed nearly a quarter of the total engagement effort. Organisations considering a PULSE implementation should expect data remediation to be a significant workstream and should begin an internal data audit before the engagement starts.
- Quick wins fund the transformation: The US$12.1 million in released working capital was not a promise delivered at the end of the project. The first US$4.8 million from inventory right-sizing was achieved by week eight, and the collections-campaign results began flowing from week three. These early wins created organisational momentum, funded the ongoing implementation effort, and silenced the sceptics who questioned whether the framework would deliver tangible results.
- The governance model matters more than the analytics: The PULSE Dashboard was technically impressive, but it was the Working Capital Council that drove the results. The Dashboard provided visibility. The Council provided accountability. Without the cross-functional governance structure, the data insights would have remained observations rather than actions.
- Incentive alignment accelerates adoption: When the VP of Sales saw that DSO was now part of his performance scorecard, his engagement with customer-payment behaviour transformed overnight. When Procurement saw that total cost of ownership had replaced purchase-price variance as the primary metric, bulk-purchase decisions began incorporating carrying-cost analysis. The incentive changes were modest in scale but transformative in impact.
- The framework must evolve: By week twelve, Caribbean Industrial Holdings had already identified three refinements to its PULSE configuration: a new trigger signal specific to government receivables (the company’s second-largest customer segment), a seasonal adjustment to the U-Layer weights during the annual hurricane season, and a commodity sub-index for packaging materials that was more granular than the generic commodity index initially used. The quarterly recalibration process ensures these refinements are captured and the framework grows with the business.
EVERY DAY OF DELAYED ACTION COSTS REAL CASH.
Start Your Own 90-Day Transformation with a PULSE Diagnostic Sprint:
Dawgen Global is a full-spectrum advisory firm delivering transformation across Strategy, Finance, Operations, Technology, and Governance. Our Working Capital Advisory practice is powered by the proprietary WC-PULSE Framework™, designed to convert working-capital management from a reactive function into a strategic capability that drives shareholder value. We serve mid-market and large enterprises across the Caribbean, North America, and international markets.
In just two weeks, we’ll deliver your Baseline PULSE Scorecard and a prioritised action plan. No multi-month consulting engagement – just clarity and speed. The quick wins typically identified in the Diagnostic Sprint alone deliver 3–5x the cost of the engagement.
| Start Your Sprint Today :[email protected]
The WC-PULSE Thought Leadership Series
Articles 1–7: CCC Blind Spots → Buffer vs. Reprice → 13-Week Crystal Ball → Supplier Ecosystem → Governance → Reprice Playbook → E-Layer
Article 8: “The 90-Day Working Capital Transformation: A PULSE Implementation Case Study” (You are here)
Coming Next – Article 9: “Caribbean CFO Survival Guide: Working Capital in a Small, Open Economy” – Applying the WC-PULSE Framework to the unique pressures facing Caribbean finance leaders: FX volatility, import dependency, limited credit markets, and concentrated customer bases.
About Dawgen Global
“Embrace BIG FIRM capabilities without the big firm price at Dawgen Global, your committed partner in carving a pathway to continual progress in the vibrant Caribbean region. Our integrated, multidisciplinary approach is finely tuned to address the unique intricacies and lucrative prospects that the region has to offer. Offering a rich array of services, including audit, accounting, tax, IT, HR, risk management, and more, we facilitate smarter and more effective decisions that set the stage for unprecedented triumphs. Let’s collaborate and craft a future where every decision is a steppingstone to greater success. Reach out to explore a partnership that promises not just growth but a future beaming with opportunities and achievements.
 Email: [email protected]
  Visit: Dawgen Global Website

 WhatsApp Global Number : +1 555-795-9071
Caribbean Office: +1876-6655926 / 876-9293670/876-9265210  WhatsApp Global: +1 5557959071
USA Office: 855-354-2447
Join hands with Dawgen Global. Together, let’s venture into a future brimming with opportunities and achievements

